As two of the most populous cities in the Pacific Northwest, Seattle, Washington, and Salem, Oregon, both offer distinctive living and visiting experiences. While Seattle is famed for its technological edge and vibrant art scene, Salem is indeed celebrated for its rich historical roots and calmer pace of life. Each city has unique draws in areas such as crime/safety, weather, living costs, education, work and economy, and many more essential elements of good living or visiting experiences.
Distance between
Seattle, WA and
Salem, OR : 189.2 miles
Seattle's population is larger by 313%. Its population has grown by 170,545 people (30.3%) since 2000. The population of Salem has grown by 40,799 people (29.8%) during that time.
Seattle tends to have a higher crime rate compared to the national average, including property and violent crimes. Despite this, some areas like Windermere and Laurelhurst have very low crime rates, attracting both residents and visitors. Salem, on the other hand, has safety rates near the national median, with certain areas like West Salem and South Central Salem showing lower crime rates.
City-data.com crime index counts serious crimes and violent crime more heavily. It adjusts for the number of visitors and daily workers commuting into cities. (higher means more crime, U.S. average = 301.1)
City-data.com crime index counts serious crimes and violent crime more heavily. It adjusts for the number of visitors and daily workers commuting into cities. (higher means more crime, U.S. average = 301.1)
Sex Offenders
According to our data, there are 481 registered sex offenders living in Seattle and 161 registered sex offenders living in . The ratio of residents to sex offenders in Seattle is 1,464 to 1; the ratio in Salem is 1,040 to 1. The number of registered sex offenders compared to the number of residents is a smaller in Seattle than in Salem.
Cost of Living
In terms of the cost of living, Seattle is notably more expensive than Salem. This includes housing, grocery, and transportation costs. However, the higher cost of living in Seattle can be offset by higher median salaries, especially for those in tech and related industries.
Income Tax
In contrast taxation, Washington, including Seattle, doesn't impose a state income tax. However, Oregon does levy a state income tax, which is something to consider for potential Salem residents.
Property Tax
Property taxes also differ; Seattle has a relatively high property tax. Salem has a lower property tax rate compared to the national average.
Sales Tax
Washington has a 6.5% state sales tax, with Seattle having an additional city sale tax, making it quite high. On the contrary, Oregon has no sales tax, which can be a significant saving for residents and visitors alike.
Income
Type
Seattle
Salem
Estimated median household income
$110,781
$63,927
Estimated per capita income
$74,733
$32,046
Cost of living index (U.S. average is 100)
118.5
96.8
If you make $50,000 in Salem, you will have to make $61,209 in Seattle to maintain the same standard of living.
Geographical Conditions
Seattle is framed by water, hills, and greenery with stunning views of Mount Rainier and proximity to outdoor activities. Salem is nestled in the Willamette Valley, surrounded by farmland, vineyards and has easy access to beaches and the Cascade Mountains.
Seattle has a robust educational ecosystem with several prestigious universities such as the University of Washington. It also has a highly-rated public school system. Salem, while smaller, has commendable education institutions like Willamette University and excellent public schools.
Seattle has a very strong economy, fueled by a thriving tech industry. Companies like Amazon, Microsoft, and Starbucks have headquarters here. Salem's economy is more government and agriculture-led. The state of Oregon is a significant employer in Salem.
Biggest Employers
Seattle's biggest employers are Amazon, Microsoft, and the University of Washington. For Salem, the State of Oregon, Salem Health Hospitals, and Clinics, and Salem-Keizer Public Schools lead the employment industry.
There were 264 building permits issued in Seattle in 2012 (52 less than in 2011) compared to 447 building permits issued in Salem in 2012 (287 more than in 2011).
In Seattle (King County), 69.0% voted for Democrats and 28.5% for Republicans in 2012 Presidential Election. In Salem (Marion County), 46.8% voted for Democrats and 50.0% for Republicans.
Elections
Type
Democrats
Republicans
Other
Year
Seattle
Salem
Seattle
Salem
Seattle
Salem
2020
75.1%
48.9%
22.3%
47.7%
2.6%
3.4%
2016
70.0%
42.2%
21.1%
46.3%
8.9%
11.5%
2012
69.0%
46.8%
28.5%
50.0%
2.5%
3.2%
2008
70.2%
49.6%
28.1%
47.4%
1.7%
3.0%
2004
65.1%
44.5%
33.8%
53.9%
1.1%
1.6%
2000
60.3%
43.7%
34.5%
50.8%
5.2%
5.4%
1996
56.4%
45.3%
31.4%
43.2%
12.2%
11.5%
Breakdown of population affiliated with a religious congregation
Type
Adherents
Congregations
Religion
Seattle
Salem
Seattle
Salem
CATHOLIC CHURCH
14.4%
19.9%
4.9%
5.2%
EVANGELICAL LUTHERAN CHURCH IN AMERICA
1.3%
1.1%
4.7%
3.1%
EPISCOPAL CHURCH
0.8%
0.4%
2.4%
1.7%
AMERICAN BAPTIST CHURCHES IN THE USA
0.6%
0.1%
2.9%
0.7%
MUSLIM ESTIMATE
0.6%
0.0%
1.4%
0.0%
SEVENTH DAY ADVENTIST CHURCH
0.6%
1.3%
2.3%
3.5%
LUTHERAN CHURCH
0.5%
0.5%
2.0%
2.4%
SOUTHERN BAPTIST CONVENTION
0.3%
0.2%
3.8%
1.4%
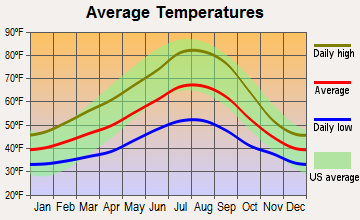
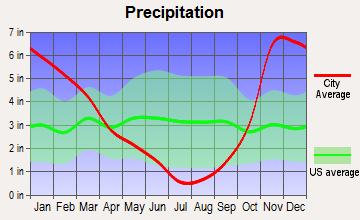
Weather
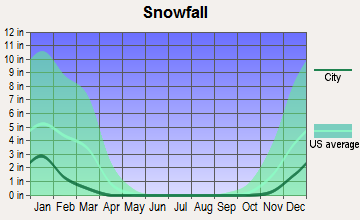
Seattle is known for its rainy weather, with a moderate climate throughout the year and occasional snowfall during winter. Salem also has a moderate climate but experiences less rainfall than Seattle. Both cities are known for their green surroundings, thanks to their mild, wet winters.
Weather and climate
Type
Seattle
Salem
Temperature - Average
52.5°F
52.5°F
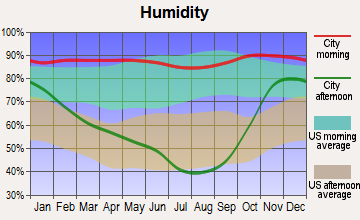
Humidity - Average morning or afternoon humidity
78.5%
77.6%
Humidity - Differences between morning and afternoon humidity
38%
49%
Humidity - Maximum monthly morning or afternoon humidity
86%
88%
Humidity - Minimum monthly morning or afternoon humidity
48%
39%
Precipitation - Yearly average
36.6 in
40.7 in
Snowfall - Yearly average
21.4 in
14 in
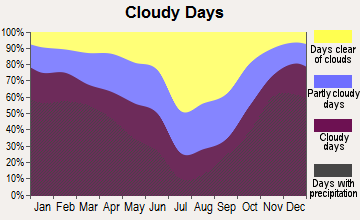
Clouds - Number of days clear of clouds
11.6%
12.9%
Sunshine amount - Average
49.4%
54.6%
Sunshine amount - Differences during a year
44%
51.9%
Sunshine amount - Maximum monthly
64%
71.9%
Sunshine amount - Minimum monthly
20%
20%
Wind speed - Average
8.6 mph
7.1 mph
Average climate in Seattle, Washington
Average climate in Salem, Oregon
Air pollution
Type
AQI
CO
NO2
OZONE
PB
PM10
PM25
SO2
Year
Seattle
Salem
Seattle
Seattle
Seattle
Seattle
Seattle
Seattle
Salem
Seattle
2018
82
69
0.21
N/A
10.6
N/A
20.7
N/A
N/A
N/A
N/A
N/A
8.3
N/A
0.7
N/A
2017
92
78
0.23
N/A
11.1
N/A
21.0
N/A
N/A
N/A
N/A
N/A
8.8
6.2
0.3
N/A
2016
67
63
0.22
N/A
11.9
N/A
20.3
N/A
N/A
N/A
N/A
N/A
6.6
5.4
0.6
N/A
2015
81
89
0.23
N/A
10.8
N/A
19.3
N/A
N/A
N/A
N/A
N/A
8.5
7.2
0.8
N/A
2014
75
76
0.24
N/A
11.5
N/A
19.5
N/A
N/A
N/A
N/A
N/A
7.4
6.4
N/A
N/A
2013
81
75
0.24
N/A
N/A
N/A
17.4
N/A
N/A
N/A
N/A
N/A
9.1
8.0
0.8
N/A
2012
77
70
0.23
N/A
N/A
N/A
19.5
N/A
N/A
N/A
N/A
N/A
7.7
5.9
1.0
N/A
2011
72
70
0.24
N/A
N/A
N/A
18.6
N/A
N/A
N/A
N/A
N/A
7.5
6.9
1.1
N/A
2010
71
68
0.24
N/A
N/A
N/A
18.0
N/A
N/A
N/A
N/A
N/A
6.7
5.9
1.1
N/A
2009
94
83
0.27
N/A
N/A
N/A
17.7
N/A
N/A
N/A
N/A
N/A
8.0
7.6
1.4
N/A
2008
80
80
0.30
N/A
N/A
N/A
17.8
N/A
N/A
N/A
N/A
N/A
6.5
6.9
1.3
N/A
2007
83
79
0.30
N/A
N/A
N/A
18.2
N/A
N/A
N/A
20.3
N/A
7.9
6.4
1.5
N/A
2006
98
84
N/A
N/A
N/A
N/A
18.3
N/A
N/A
N/A
22.6
N/A
8.7
6.6
N/A
N/A
2005
101
88
0.80
N/A
18.3
N/A
N/A
N/A
N/A
N/A
24.5
N/A
9.5
7.7
3.5
N/A
2004
102
77
0.81
N/A
17.9
N/A
N/A
N/A
N/A
N/A
N/A
N/A
10.3
8.2
3.0
N/A
2003
91
N/A
0.78
N/A
18.5
N/A
N/A
N/A
N/A
N/A
N/A
N/A
9.9
N/A
2.4
N/A
2002
87
N/A
0.82
N/A
19.3
N/A
N/A
N/A
N/A
N/A
N/A
N/A
11.7
N/A
2.7
N/A
2001
88
N/A
0.90
N/A
20.7
N/A
N/A
N/A
0.005
N/A
N/A
N/A
12.3
N/A
3.7
N/A
2000
98
N/A
1.06
N/A
20.9
N/A
N/A
N/A
N/A
N/A
N/A
N/A
13.3
N/A
3.2
N/A
Natural disasters
Type
Seattle
Salem
Tornado activity compared to U.S. average
5.5%
6.9%
Earthquake activity compared to U.S. average
1,394.2%
1,490.4%
Natural disasters compared to U.S. average
30%
10%
Transportation
Seattle features an extensive public transportation network which includes buses, a light rail system, and ferries. Salem's transportation is served mainly by Cherriots bus service, along with Amtrak service. Both cities support biking and walking.
Transport
Type
Seattle
Salem
Amtrak stations
1
1
Amtrak stations nearby
2
1
FAA registered aircraft
1
293
FAA registered aircraft manufacturers and dealers
2
2
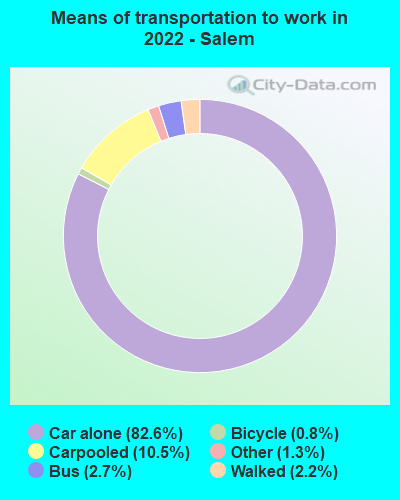
Means of transportation to work
Type
Seattle
Salem
Bicycle
2.1%
1.3%
Bus
8.9%
2%
Carpooled
8.7%
11.1%
Car alone
67.8%
81.5%
Ferryboat
0.7%
0%
Motorcycle
0.3%
0.1%
Railroad
1.2%
0%
Streetcar
0.3%
0%
Subway
0.6%
0%
Taxicab
0.1%
0%
Walked
8%
2.9%
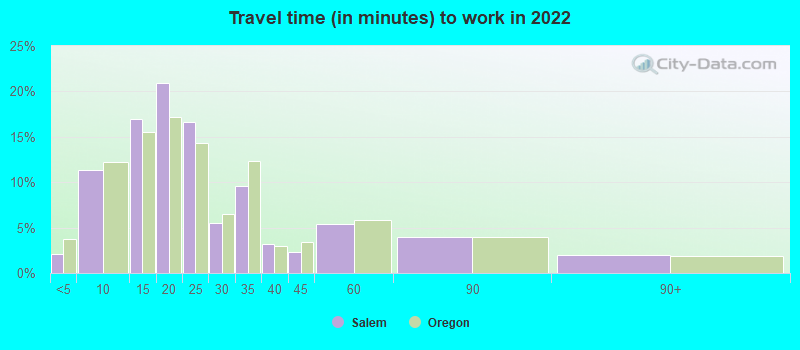
Average travel time to work
Type
Seattle
Salem
Average
35 min
23 min
Other means
23.5 min
23.3 min
Public transportation
35.6 min
36.9 min
Private vehicle occupancy
Type
Seattle
Salem
Average
1.2
1.2
Drove alone
89%
88.7%
In 2 person carpool
8.7%
9%
In 3 person carpool
0.8%
1.4%
In 4 person carpool
0.2%
0.2%
In 5-6 person carpool
1.1%
0.5%
In 7+ person carpool
0.2%
0.2%
How many people usually rode to work in the car, truck or van.
Real Estate
Seattle real estate is booming but also notably expensive, with a diverse range of properties from luxury condos to suburban homes. In contrast, Salem’s real estate is more affordable, offering a mix of historic homes, condos, and new construction.
Neighborhoods
Both Seattle and Salem boast diverse neighborhoods. Seattle has bustling downtown districts like Belltown and Capitol Hill, while Fremont is for art lovers. Salem has charming areas like West Salem, known for its natural beauty, and downtown Salem, known for shopping and dining.
Houses and residents
Type
Seattle
Salem
Houses
384,799
69,247
Average household size (people)
2.1
2.6
Median year apartment built
1987
1977
Median year house/condo built
1955
1979
Length of stay in the house since moving in
12.4 years
10.3 years
Houses occupied
351,650 (91.4%)
64,959 (93.8%)
Houses occupied by owners
161,587 (46%)
36,174 (55.7%)
Houses occupied by renters
190,063 (54%)
28,785 (44.3%)
Median rent asked for vacant for-rent units
$2,780
$831.65
Median monthly housing costs
$1,984
$1,301
Median price asked for vacant for-sale houses and condos
$860,506
$310,346
Estimated median house or condo value
$848,100
$351,300
Median numbers of rooms
4.1
5.1
Median number of rooms in apartments
3
4
Median number of rooms in houses and condos
6.3
6.1
Median house price - detached houses
Over $1,000,000
$367,136
Median house price - in 2-unit structures
$764,579
$201,756
Median house price - in 3-to-4-unit structures
$719,049
$497,197
Median house price - in 5 or more unit structures
$626,370
$199,063
Median house price - mobile homes
$226,727
$97,644
Median house price - occupied boats, rvs, vans etc.
Over $1,000,000
$202,145
Median house price - Townhouses or other attached units
$925,507
$266,067
Median house price - All housing units
Over $1,000,000
$339,269
Median house age
47
44
Renting percentage
51.9%
44.3%
Housing density (houses/condos per square mile)
4,587.9
1,514.1
House value disparities
20.6%
24.3%
Household income disparities
42.2%
43.1%
Median household income for houses/condes with a mortgage
$189,767
$101,803
Median household income for apartments without a mortgage
$112,771
$68,528
Housing units without a mortgage
2,459 (2.1%)
233 (0.9%)
Housing units with both a second mortgage and home equity loan
12,354 (10.5%)
1,570 (6.1%)
Housing units with a mortgage
115,481 (97.9%)
25,349 (99.1%)
Housing units with a home equity loan
240 (0.2%)
0 (0%)
Housing units with a second mortgage
13,881 (11.8%)
1,885 (7.4%)
House/condo owner moved in on average (years ago)
8
7
House/condo renter moved in on average (years ago)
1
2
Housing units lacking complete kitchen facilities
2.2%
3.2%
Housing units lacking complete plumbing facilities
0.4%
1.2%
Housing units in structures
Housing units in structures
Seattle
Salem
One, detached
39.6%
58.8%
One, attached
6.0%
4.5%
Two
2.0%
3.2%
3 or 4
3.2%
5.0%
5 to 9
5.7%
9.7%
10 to 19
7.0%
5.5%
20 to 49
11.9%
4.1%
50 or more
24.4%
4.6%
Mobile homes
0.1%
4.2%
Boats, RVs, vans, etc.
0.0%
0.3%
Median real estate property taxes paid for housing units
Self-employed workers in own not incorporated business
24,994
4,012
State government workers
27,235
10,376
Unpaid family workers
947
160
Industries and Occupations
In Seattle, the major industries are technology, healthcare, and manufacturing, with high demand for IT professionals, healthcare workers, and skilled technicians. Salem's economy is rooted around government, agriculture, education, and healthcare sectors.
Seattle has top-ranked healthcare facilities like the University of Washington Medical Center. Salem, while smaller, has reputable healthcare institutions such as Salem Hospital.
Health (county statistics)
Type
Seattle
Salem
General health status score of residents in this county from 1 (poor) to 5 (excellent)
Seattle, being a larger city, has more developed infrastructure, including a variety of housing options, advanced healthcare facilities, shopping centers, and recreational facilities. Salem provides a more small-town feel with its simpler infrastructure that nevertheless includes all the basic amenities a resident might need.
Infrastructure
Type
Seattle
Salem
Hospitals
22
4
TV stations
17
11
Arenas or stadiums
5
1
Bank branches located here
236
53
Bank institutions located here
37
14
Drinking water stations with no reported violations in the past
3
2
Drinking water stations with reported violations in the past
HMDA - Conventional home purchase loans - Applications denied
Year
Seattle
Salem
1999
1,357
550
2000
1,148
295
2001
890
240
2002
840
164
2003
1,421
366
2004
1,810
536
2005
2,341
724
2006
2,789
676
2007
2,273
512
2008
1,113
240
2009
748
98
Culture and Food
Seattle is known for its diverse culture and cuisine, including the famous Seattle coffee culture, seafood, and thriving art scene. Salem boasts a rich historical culture, excellent wineries, and a relaxed culinary scene, showcasing Oregon's agricultural bounty.
Sports Teams
For sports enthusiasts, Seattle offers professional sports teams like the Seattle Seahawks (NFL), Seattle Mariners (MLB), and Seattle Sounders (MLS). Salem, however, doesn't have major league teams, but supports local college sports fervently.

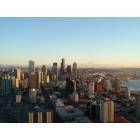

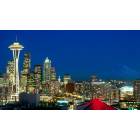
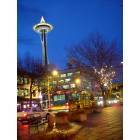
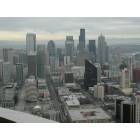

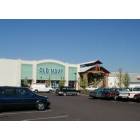
 Seattle, WA
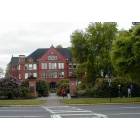
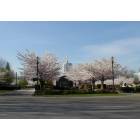
 Salem, OR