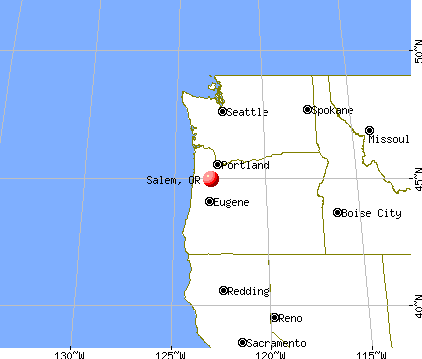
Salem, Oregon
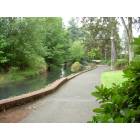
Salem: Creek and Path around State offices
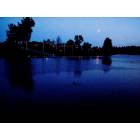
Salem: Willamette River evening

Salem: River Front Park and Carousel
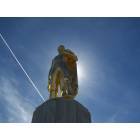
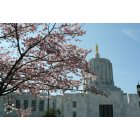
Salem: The Golden Pioneer statue on top of the Capitol building
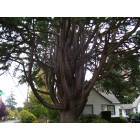
Salem: Amazing Tree!
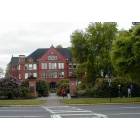
Salem: Willamette University
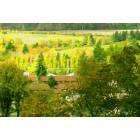
Salem: Hilltop view of Minto Brown Island Park
Salem: Oregon State Capitol, Salem Oregon
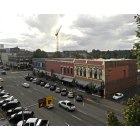
Salem: View of Downtown
Salem: State Capitol
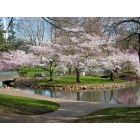
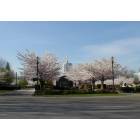
Salem: Downtown City Park
- see
23
more - add
your
Submit your own pictures of this city and show them to the world
- OSM Map
- General Map
- Google Map
- MSN Map
Population change since 2000: +29.6%
 |
| Males: 88,352 | |
| Females: 89,135 |
| Median resident age: | 37.0 years |
| Oregon median age: | 40.5 years |
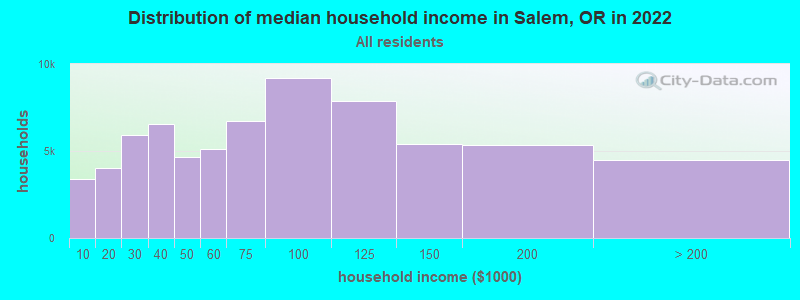
| Salem: | $70,220 |
| OR: | $75,657 |
Estimated per capita income in 2022: $35,766 (it was $19,141 in 2000)
Salem city income, earnings, and wages data
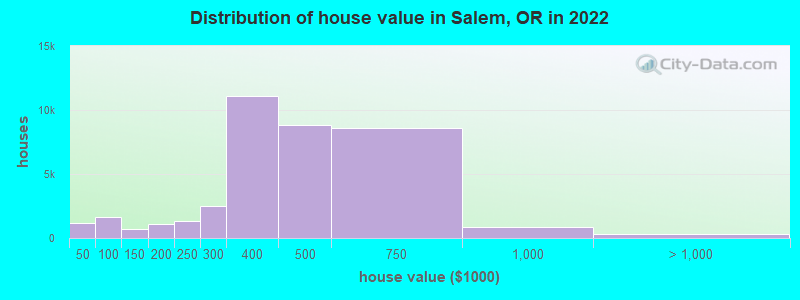
Estimated median house or condo value in 2022: $398,300 (it was $126,300 in 2000)
| Salem: | $398,300 |
| OR: | $475,600 |
Mean prices in 2022: all housing units: $392,774; detached houses: $430,055; townhouses or other attached units: $202,040; in 2-unit structures: $387,474; in 3-to-4-unit structures: $594,823; in 5-or-more-unit structures: $323,491; mobile homes: $120,942; occupied boats, rvs, vans, etc.: $51,170
Median gross rent in 2022: $1,304.
(12.6% for White Non-Hispanic residents, 22.3% for Black residents, 24.1% for Hispanic or Latino residents, 21.1% for American Indian residents, 27.7% for Native Hawaiian and other Pacific Islander residents, 22.3% for other race residents, 19.1% for two or more races residents)
Detailed information about poverty and poor residents in Salem, OR


Compare current foreclosures in Salem, OR:
| Photo | Address | Area | Beds / Baths | Price | Details |
|---|---|---|---|---|---|

|
#1
Hawksview Ave SE
Salem, OR 97306
|
1,683 sq. feet
|
3 baths 3 beds |
show details | |

|
#2
20th St NE
Salem, OR 97301
|
1,020 sq. feet
|
2 baths 3 beds |
show details | |

|
#3
Golden Eagle St NW
Salem, OR 97304
|
2,753 sq. feet
|
3 baths 4 beds |
show details | |

|
#4
Grassland Ct NE
Salem, OR 97305
|
2,705 sq. feet
|
3 baths 3 beds |
show details | |

|
#5
Michigan City Ln NW
Salem, OR 97304
|
1,568 sq. feet
|
2 baths 3 beds |
show details | |

|
#6
Waller St SE
Salem, OR 97302
|
1,112 sq. feet
|
1 baths 3 beds |
show details | |

|
#7
Norman Ave NE
Salem, OR 97301
|
1,329 sq. feet
|
2 baths 3 beds |
show details | |

|
#8
Hazelgreen Rd NE
Salem, OR 97305
|
1,236 sq. feet
|
2 baths 3 beds |
show details | |

|
#9
Regal Dr NE
Salem, OR 97301
|
1,732 sq. feet
|
3 baths 5 beds |
show details | |

|
#10
Hoffman Rd NE
Salem, OR 97301
|
1,566 sq. feet
|
2 baths 3 beds |
show details |
| Photo | Address | Area | Beds / Baths | Price | Details |
|---|---|---|---|---|---|

|
#11
Jackpine St NE
Salem, OR 97305
|
1,473 sq. feet
|
1 baths 3 beds |
show details | |

|
#12
Arroyo Ridge Dr NW
Salem, OR 97304
|
1,770 sq. feet
|
2 baths 4 beds |
show details | |

|
#13
Hoffman Rd NE
Salem, OR 97301
|
1,296 sq. feet
|
2 baths 3 beds |
show details | |

|
#14
Janice Ave NE
Salem, OR 97305
|
1,304 sq. feet
|
2 baths 3 beds |
show details | |

|
#15
Fieldview St NE
Salem, OR 97303
|
2,520 sq. feet
|
2 baths 4 beds |
show details | |

|
#16
Fairway Ave SE
Salem, OR 97306
|
1,120 sq. feet
|
1 baths 2 beds |
show details | |

|
#17
Argyle Dr S
Salem, OR 97302
|
2,498 sq. feet
|
3 baths 4 beds |
show details | |

|
#18
Summer St SE
Salem, OR 97302
|
1,430 sq. feet
|
2 baths 3 beds |
show details | |

|
#19
Mcleod Ln NE
Salem, OR 97303
|
1,624 sq. feet
|
2 baths 3 beds |
show details | |

|
#20
Coloma Dr SE
Salem, OR 97302
|
1,279 sq. feet
|
2 baths 3 beds |
show details |
| Photo | Address | Area | Beds / Baths | Price | Details |
|---|---|---|---|---|---|

|
#21
45th Ave NE
Salem, OR 97301
|
1,504 sq. feet
|
1 baths 3 beds |
show details | |

|
#22
Doaks Ferry Rd NW
Salem, OR 97304
|
1,600 sq. feet
|
2 baths 3 beds |
show details | |

|
#23
Bridgeport Ave SE
Salem, OR 97306
|
2,388 sq. feet
|
2 baths 4 beds |
show details | |

|
#24
Summit Ave NW
Salem, OR 97304
|
2,156 sq. feet
|
2 baths 4 beds |
show details | |

|
#25
Gary St NE
Salem, OR 97303
|
988 sq. feet
|
2 baths 3 beds |
show details | |

|
#26
Rivergrove Ct N
Salem, OR 97303
|
1,516 sq. feet
|
2 baths 3 beds |
show details | |

|
#27
Hampden Ln NE Unit 38
Salem, OR 97305
|
720 sq. feet
|
1 baths 2 beds |
show details | |

|
#28
Gerth Ave NW
Salem, OR 97304
|
798 sq. feet
|
1 baths 2 beds |
show details | |

|
#29
Denise St SE
Salem, OR 97306
|
1,008 sq. feet
|
1 baths 3 beds |
show details | |

|
#30
Compton Ln SE
Salem, OR 97306
|
1,057 sq. feet
|
2 baths 3 beds |
show details |
| Photo | Address | Area | Beds / Baths | Price | Details |
|---|---|---|---|---|---|

|
#31
45th Ave NE
Salem, OR 97305
|
2,184 sq. feet
|
2 baths 3 beds |
show details | |

|
#32
Joyce St NE # 93
Salem, OR 97303
|
1,296 sq. feet
|
2 baths 3 beds |
show details | |

|
#33
Boulder Dr SE
Salem, OR 97317
|
1,126 sq. feet
|
1 baths 3 beds |
show details | |

|
#34
Maine Ave NE
Salem, OR 97303
|
1,832 sq. feet
|
1 baths 4 beds |
show details | |

|
#35
Dakota Rd SE
Salem, OR 97302
|
1,915 sq. feet
|
2 baths 3 beds |
show details | |

|
#36
San Francisco Dr NE Apt 20
Salem, OR 97305
|
1,512 sq. feet
|
2 baths 3 beds |
show details | |

|
#37
22nd St SE
Salem, OR 97301
|
1,421 sq. feet
|
2 baths 3 beds |
show details | |

|
#38
Ward Dr NE
Salem, OR 97305
|
1,457 sq. feet
|
1 baths 3 beds |
show details | |

|
#39
Melissa St SE
Salem, OR 97306
|
1,768 sq. feet
|
2 baths 3 beds |
show details | |

|
#40
Fair Oaks Way NW
Salem, OR 97304
|
2,127 sq. feet
|
2 baths 4 beds |
show details |
| Photo | Address | Area | Beds / Baths | Price | Details |
|---|---|---|---|---|---|

|
#41
Idylwood Dr SE
Salem, OR 97302
|
1,550 sq. feet
|
2 baths 3 beds |
show details | |

|
#42
Krystie Ct NE
Salem, OR 97303
|
1,008 sq. feet
|
1 baths 3 beds |
show details | |

|
#43
Robins Ln SE Unit 68
Salem, OR 97306
|
1,620 sq. feet
|
2 baths 2 beds |
show details | |

|
#44
Nightingale Ct NE
Salem, OR 97303
|
1,516 sq. feet
|
2 baths 3 beds |
show details | |

|
#45
Lockhaven Dr NE
Salem, OR 97303
|
1,219 sq. feet
|
2 baths 2 beds |
show details | |

|
#46
24th St SE
Salem, OR 97301
|
1,548 sq. feet
|
1 baths 2 beds |
show details | |

|
#47
Briana Ct NW
Salem, OR 97304
|
2,052 sq. feet
|
2 baths 3 beds |
show details | |

|
#48
St Charles St NE
Salem, OR 97303
|
1,574 sq. feet
|
1 baths 3 beds |
show details | |

|
#49
Terrace Dr NW
Salem, OR 97304
|
1,122 sq. feet
|
1 baths 2 beds |
show details | |

|
Check over 1 million property listings on Foreclosure.com!
|
browse all offers | |||


- 105,37159.4%White alone
- 51,36028.9%Hispanic
- 8,6384.9%Two or more races
- 4,3752.5%Asian alone
- 2,8521.6%Native Hawaiian and Other
Pacific Islander alone - 2,4941.4%Black alone
- 1,4980.8%American Indian alone
- 9020.5%Other race alone
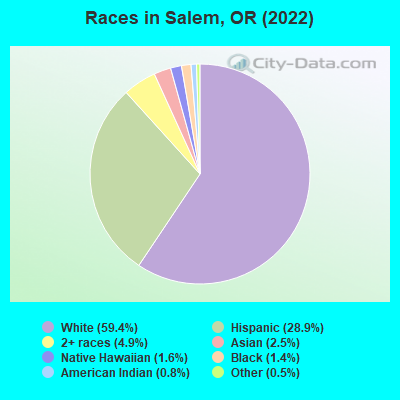
Races in Salem detailed stats: ancestries, foreign born residents, place of birth
According to our research of Oregon and other state lists, there were 159 registered sex offenders living in Salem, Oregon as of April 27, 2024.
The ratio of all residents to sex offenders in Salem is 1,053 to 1.
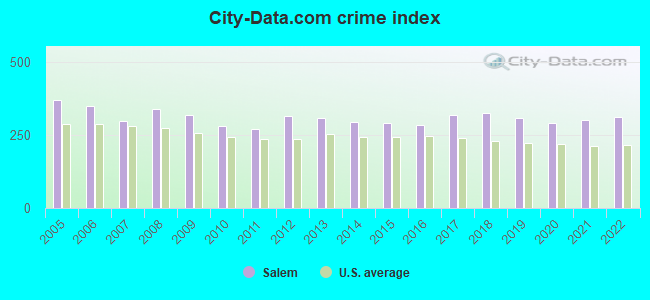
The City-Data.com crime index weighs serious crimes and violent crimes more heavily. Higher means more crime, U.S. average is 246.1. It adjusts for the number of visitors and daily workers commuting into cities.
- means the value is smaller than the state average.- means the value is about the same as the state average.
- means the value is bigger than the state average.
- means the value is much bigger than the state average.
Crime rate in Salem detailed stats: murders, rapes, robberies, assaults, burglaries, thefts, arson
Full-time law enforcement employees in 2021, including police officers: 245 (180 officers - 157 male; 23 female).
| Officers per 1,000 residents here: | 1.01 |
| Oregon average: | 1.48 |
 Recent articles from our blog. Our writers, many of them Ph.D. graduates or candidates, create easy-to-read articles on a wide variety of topics.

 | Looking for suggestions of places to live near Salem (10 replies) |
| Looking at Salem property (13 replies) |
| Which is better to live in, Salem OR or Vancouver WA? (52 replies) |
| Salem vs Bend (12 replies) |
| Moving to Salem, good and bad areas to live?? (2 replies) |
| Salem vs Portland (18 replies) |
Latest news from Salem, OR collected exclusively by city-data.com from local newspapers, TV, and radio stations
Salem, OR City Guides:
Ancestries: German (9.6%), English (7.9%), European (7.2%), American (5.8%), Irish (4.6%), Norwegian (1.5%).
Current Local Time: PST time zone
Incorporated in 1857
Elevation: 154 feet
Land area: 45.7 square miles.
Population density: 3,881 people per square mile (average).
20,757 residents are foreign born (6.8% Latin America, 2.5% Asia).
| This city: | 11.8% |
| Oregon: | 9.8% |
Median real estate property taxes paid for housing units with mortgages in 2022: $3,753 (0.9%)
Median real estate property taxes paid for housing units with no mortgage in 2022: $3,543 (1.0%)
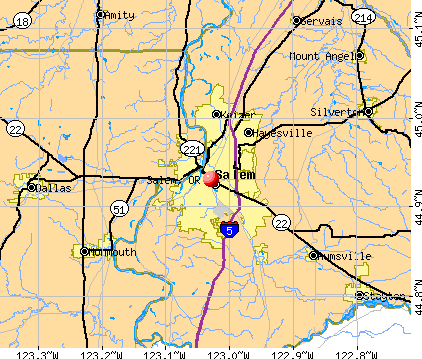
Nearest city with pop. 200,000+: Northwest Clackamas, OR (37.9 miles  , pop. 224,220).
Nearest city with pop. 1,000,000+: Los Angeles, CA (789.8 miles , pop. 3,694,820).
Nearest cities:
), ), ), ), ), Latitude: 44.93 N, Longitude: 123.03 W
Daytime population change due to commuting: +17,435 (+9.8%)
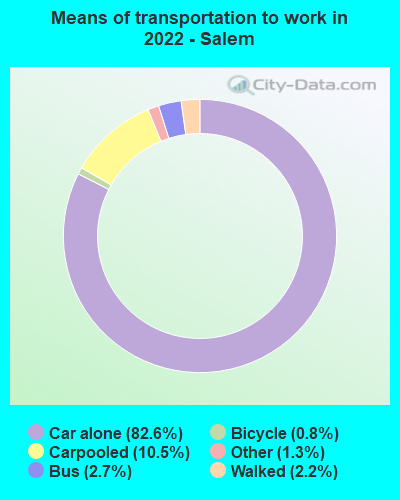
Workers who live and work in this city: 53,860 (65.2%)
Area codes: 503, 971
Detailed articles:
Salem tourist attractions:
- Lancaster Mall - Salem, OR - a mall with a number of stores and conference facilities
- Salem Center - Salem, OR - a place to hold virtually any event
- A.C. Gilbert's Discovery Village has over 20,000 square feet of indoor and outdoor activities
- Enchanted Forest Theme Park, Salem, OR
- Enchanted Forest Theme Park -Salem, OR - a theme park in a forest setting
- Phoenix Grand Hotel - Salem, OR - a hotel offering meeting facilities and a number of amenities
- Phoenix Grand Hotel, Salem, OR
Salem, Oregon accommodation & food services, waste management - Economy and Business Data
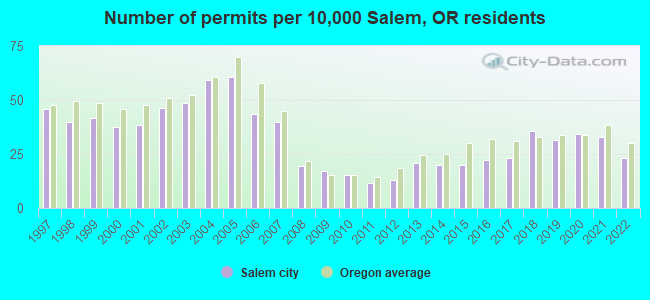
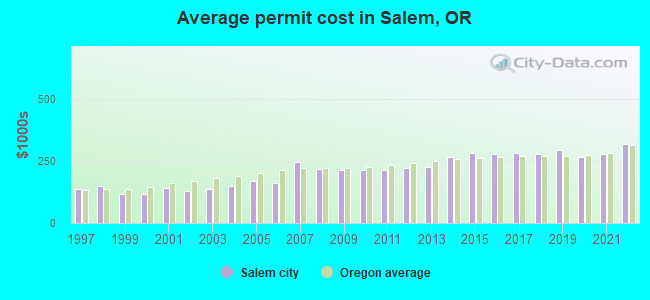
Single-family new house construction building permits:
- 2022: 318 buildings, average cost: $317,600
- 2021: 447 buildings, average cost: $280,200
- 2020: 472 buildings, average cost: $266,800
- 2019: 432 buildings, average cost: $295,600
- 2018: 489 buildings, average cost: $278,600
- 2017: 319 buildings, average cost: $281,400
- 2016: 302 buildings, average cost: $278,700
- 2015: 271 buildings, average cost: $283,400
- 2014: 270 buildings, average cost: $267,100
- 2013: 283 buildings, average cost: $225,500
- 2012: 179 buildings, average cost: $222,600
- 2011: 160 buildings, average cost: $215,300
- 2010: 211 buildings, average cost: $211,600
- 2009: 237 buildings, average cost: $213,900
- 2008: 269 buildings, average cost: $215,800
- 2007: 543 buildings, average cost: $244,100
- 2006: 594 buildings, average cost: $163,300
- 2005: 828 buildings, average cost: $168,200
- 2004: 814 buildings, average cost: $151,200
- 2003: 668 buildings, average cost: $136,600
- 2002: 636 buildings, average cost: $128,000
- 2001: 526 buildings, average cost: $140,400
- 2000: 516 buildings, average cost: $116,800
- 1999: 573 buildings, average cost: $115,900
- 1998: 545 buildings, average cost: $148,000
- 1997: 629 buildings, average cost: $135,900
| Here: | 4.0% |
| Oregon: | 3.9% |
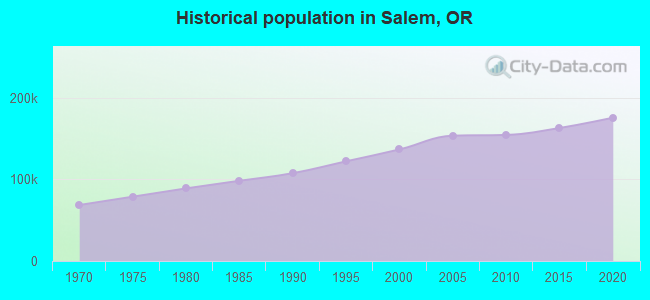
Population change in the 1990s: +27,473 (+25.1%).
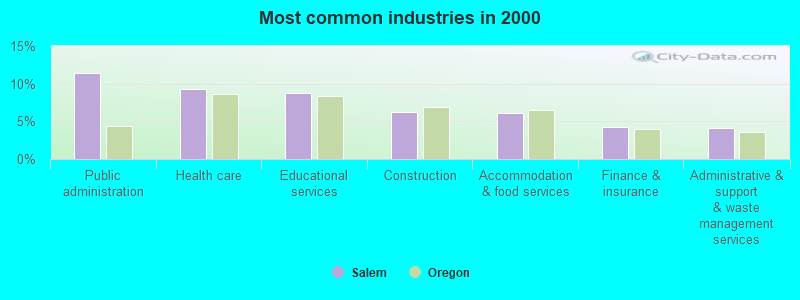
- Public administration (11.5%)
- Health care (9.3%)
- Educational services (8.7%)
- Construction (6.3%)
- Accommodation & food services (6.1%)
- Finance & insurance (4.3%)
- Administrative & support & waste management services (4.1%)
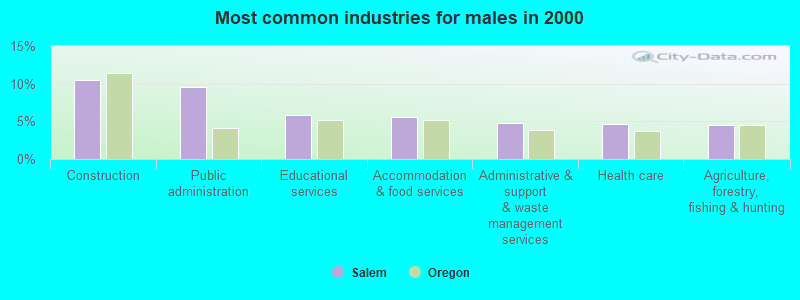
- Construction (10.5%)
- Public administration (9.5%)
- Educational services (5.8%)
- Accommodation & food services (5.5%)
- Administrative & support & waste management services (4.8%)
- Health care (4.6%)
- Agriculture, forestry, fishing & hunting (4.6%)
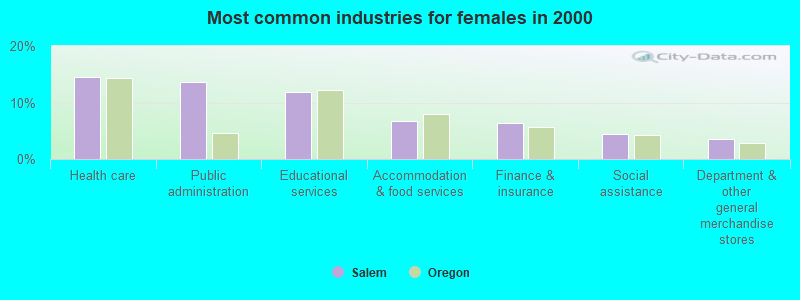
- Health care (14.5%)
- Public administration (13.6%)
- Educational services (11.9%)
- Accommodation & food services (6.7%)
- Finance & insurance (6.3%)
- Social assistance (4.5%)
- Department & other general merchandise stores (3.5%)
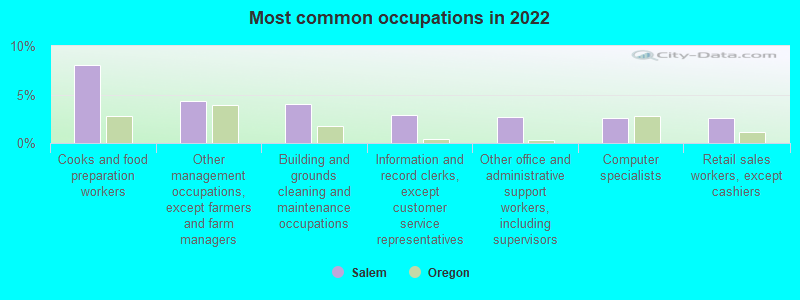
- Cooks and food preparation workers (8.0%)
- Other management occupations, except farmers and farm managers (4.3%)
- Building and grounds cleaning and maintenance occupations (4.0%)
- Information and record clerks, except customer service representatives (2.9%)
- Other office and administrative support workers, including supervisors (2.6%)
- Computer specialists (2.6%)
- Retail sales workers, except cashiers (2.6%)
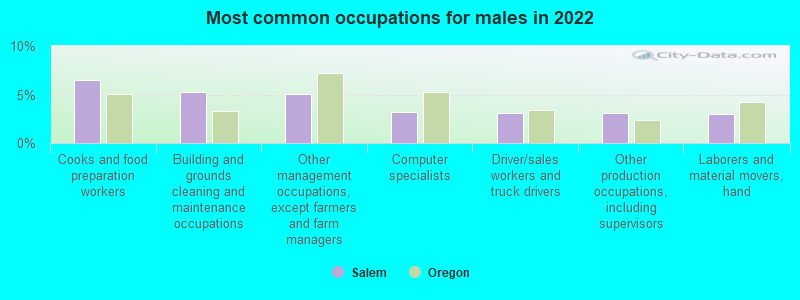
- Cooks and food preparation workers (6.5%)
- Building and grounds cleaning and maintenance occupations (5.3%)
- Other management occupations, except farmers and farm managers (5.1%)
- Computer specialists (3.2%)
- Driver/sales workers and truck drivers (3.1%)
- Other production occupations, including supervisors (3.1%)
- Laborers and material movers, hand (3.0%)
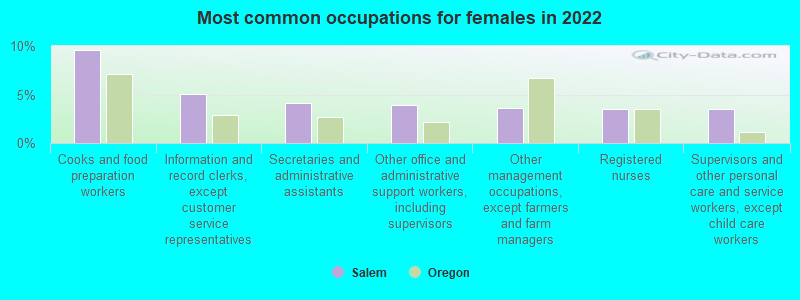
- Cooks and food preparation workers (9.6%)
- Information and record clerks, except customer service representatives (5.0%)
- Secretaries and administrative assistants (4.1%)
- Other office and administrative support workers, including supervisors (3.9%)
- Other management occupations, except farmers and farm managers (3.6%)
- Registered nurses (3.6%)
- Supervisors and other personal care and service workers, except child care workers (3.5%)
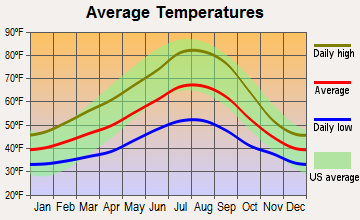
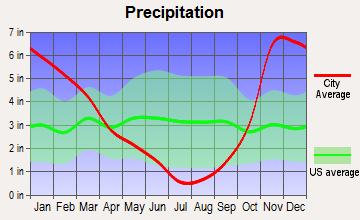
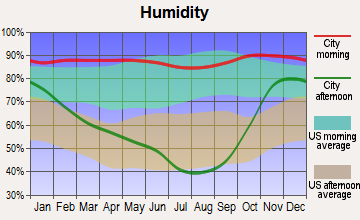
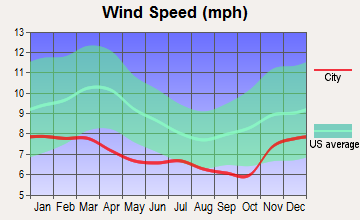
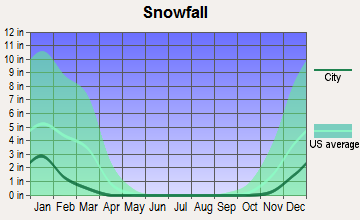
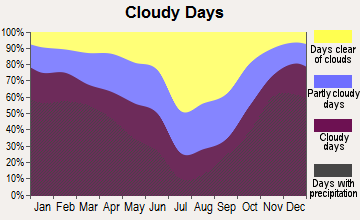
Average climate in Salem, Oregon
Based on data reported by over 4,000 weather stations

|
|


(lower is better)
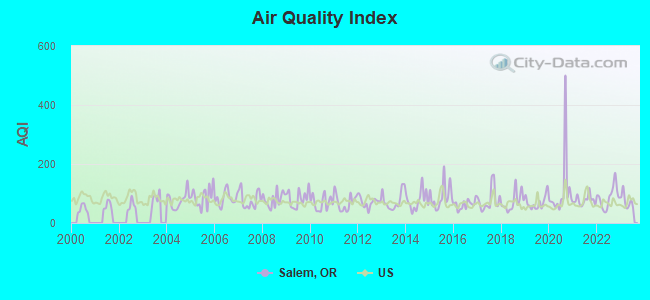
Air Quality Index (AQI) level in 2023 was 74.2. This is about average.
| City: | 74.2 |
| U.S.: | 72.6 |
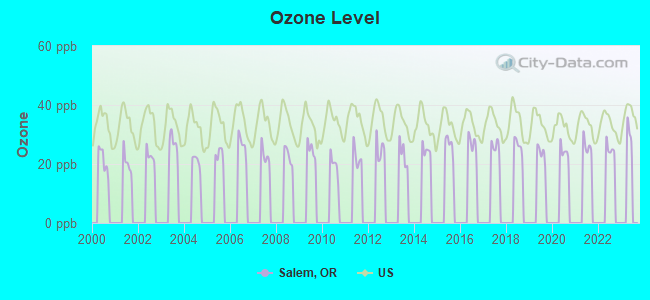
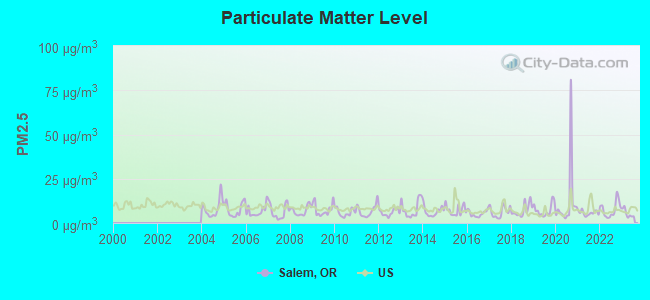
Particulate Matter (PM2.5) [µg/m3] level in 2023 was 5.39. This is significantly better than average. Closest monitor was 1.4 miles away from the city center.
| City: | 5.39 |
| U.S.: | 8.11 |
Earthquake activity:
Salem-area historical earthquake activity is significantly above Oregon state average. It is 1390% greater than the overall U.S. average.On 4/13/1949 at 19:55:42, a magnitude 7.0 (7.0 UK, Class: Major, Intensity: VIII - XII) earthquake occurred 162.4 miles away from the city center, causing $80,000,000 total damage
On 1/31/1922 at 13:17:28, a magnitude 7.6 (7.6 UK) earthquake occurred 319.4 miles away from Salem center
On 2/28/2001 at 18:54:32, a magnitude 6.8 (6.5 MB, 6.6 MS, 6.8 MW, Class: Strong, Intensity: VII - IX) earthquake occurred 150.9 miles away from the city center, causing $2,000,000,000 total damage and $305,000,000 insured losses
On 2/28/2001 at 18:54:32, a magnitude 6.8 (6.8 MD, Depth: 32.2 mi) earthquake occurred 154.1 miles away from Salem center
On 11/8/1980 at 10:27:34, a magnitude 7.2 (6.2 MB, 7.2 MS, 7.2 MW, 7.0 ML) earthquake occurred 272.0 miles away from the city center
On 8/17/1991 at 22:17:14, a magnitude 7.1 (6.2 MB, 7.1 MS, 7.1 MW, 6.8 ML, Depth: 8.4 mi) earthquake occurred 255.0 miles away from the city center
Magnitude types: body-wave magnitude (MB), duration magnitude (MD), local magnitude (ML), surface-wave magnitude (MS), moment magnitude (MW)
Natural disasters:
The number of natural disasters in Marion County (10) is smaller than the US average (15).Major Disasters (Presidential) Declared: 8
Emergencies Declared: 1
Causes of natural disasters: Floods: 4, Winter Storms: 3, Landslides: 2, Mudslides: 2, Snows: 2, Storms: 2, Earthquake: 1, Fire: 1, Heavy Rain: 1, Hurricane: 1, Wind: 1, Other: 1 (Note: some incidents may be assigned to more than one category).
Hospitals in Salem:
- OREGON STATE HOSPITAL (2600 CENTER STREET NE)
- OREGON STATE HOSPITAL DISTINCT PART (2600 CENTER STREET NE)
- SALEM HOSPITAL (Voluntary non-profit - Other, 890 OAK STREET, SE)
- WILLAMETTE VALLEY HOSPICE (1015 3RD STREET, NW)
Nursing Homes in Salem:
- AVAMERE REHABILITATION OF SALEM (4120 KURTH STREET S.)
- CAPITOL VIEW HEALTH CARE CTR (875 OAK ST SE)
- KEIZER RETIREMENT AND HEALTH C VILL (5210 RIVER ROAD NORTH)
- KINDRED NURSING AND REHABILITATION - SUNNYSIDE (4515 SUNNYSIDE ROAD SE)
- MAGNOLIA MANOR (2630 CHURCH STREET NE)
- OAK CREST REHAB AND HEALTH SERV CENTER (2933 CENTER ST)
- SALEM HOSPITAL DUERKSEN (665 WINTER ST. SE, 6TH FLR)
- SOUTH SALEM CARE CENTER (4120 KURTH ST S)
- TIERRA ROSE CARE CENTER (4254 WEATHERS STREET NE)
- WINDSOR HEALTH AND REHABILITATION CENTER (820 COTTAGE STREET NE)
Dialysis Facilities in Salem:
- FMC WEST SALEM (1060 2ND ST NW)
- QUALICENTERS - SALEM LTD (440 LANCASTER DR NE)
- SALEM DIALYSIS (3550 LIBERTY RD S SUITE 100)
- SALEM NORTH DIALYSIS (1220 LIBERTY ST NE)
Home Health Centers in Salem:
Airports and heliports located in Salem:
- Mcnary Fld Airport (SLE) (Runways: 2, Air Taxi Ops: 1,569, Itinerant Ops: 18,287, Local Ops: 11,776, Military Ops: 2,673)
- Blue Skies Farm Airport (OR87) (Runways: 1)
- Fly 'N' W Airport (4OR5) (Runways: 1)
- Lusardi Field Airport (4OR7) (Runways: 1)
- Wagoner Airport (4OR8) (Runways: 1)
- Elkins Heliport (3OR5)
- Mcnary Arng Fld Heliport (4OR1)
- Pge Heliport (51OR)
- Reforestation Services Heliport (9OR2)
- Salem Hospital Heliport (OG37)
Colleges/Universities in Salem:
- Chemeketa Community College (Full-time enrollment: 10,746; Location: 4000 Lancaster Dr NE; Public; Website: www.chemeketa.edu)
- Willamette University (Full-time enrollment: 2,551; Location: 900 State St; Private, not-for-profit; Website: www.willamette.edu; Offers Doctor's degree)
- Corban University (Full-time enrollment: 1,005; Location: 5000 Deer Park Dr SE; Private, not-for-profit; Website: www.corban.edu; Offers Doctor's degree)
- Institute of Technology Inc (Full-time enrollment: 444; Location: 4700 Silverton Road NE; Private, for-profit; Website: www.it-colleges.edu/iot/t-salem.html)
- ITT Technical Institute-Salem (Full-time enrollment: 137; Location: 4825 Commercial Street SE; Private, for-profit; Website: www.itt-tech.edu)
- College of Hair Design Careers (Full-time enrollment: 96; Location: 1684 Clay St NE; Private, for-profit; Website: www.collegeofhairdesigncareers.com)
- Phagans School of Beauty (Full-time enrollment: 80; Location: 622 Lancaster Dr NE; Private, for-profit; Website: www.phagans-schools.com)
- Academy of Hair Design-Salem (Full-time enrollment: 66; Location: 305 Court NE; Private, for-profit; Website: academyofhairdesign.info)
Other colleges/universities with over 2000 students near Salem:
- Western Oregon University (about 12 miles; Monmouth, OR; Full-time enrollment: 5,131)
- Linn-Benton Community College (about 25 miles; Albany, OR; FT enrollment: 4,511)
- George Fox University (about 26 miles; Newberg, OR; FT enrollment: 2,954)
- Oregon State University (about 29 miles; Corvallis, OR; FT enrollment: 23,206)
- Pioneer Pacific College (about 30 miles; Wilsonville, OR; FT enrollment: 2,194)
- Clackamas Community College (about 36 miles; Oregon City, OR; FT enrollment: 4,261)
- Portland Community College (about 38 miles; Portland, OR; FT enrollment: 23,600)
Biggest public high schools in Salem:
- NORTH SALEM HIGH SCHOOL (Students: 2,022, Location: 765 14TH ST NE, Grades: 9-12)
- MCKAY HIGH SCHOOL (Students: 1,916, Location: 2440 LANCASTER DR NE, Grades: 9-12)
- SOUTH SALEM HIGH SCHOOL (Students: 1,894, Location: 1910 CHURCH ST SE, Grades: 9-12)
- SPRAGUE HIGH SCHOOL (Students: 1,727, Location: 2373 KUEBLER BLVD S, Grades: 9-12)
- WEST SALEM HIGH SCHOOL (Students: 1,621, Location: 1776 TITAN WAY, Grades: 9-12)
- ROBERTS HIGH SCHOOL (Students: 693, Location: 3620 STATE ST SE, Grades: 7-12)
- EARLY COLLEGE HIGH SCHOOL (Students: 350, Location: 4071 WINEMA PL BLDG 50, Grades: 9-12)
- ROBERT S FARRELL HIGH SCHOOL (Students: 182, Location: 2450 STRONG RD SE, Grades: 6-12)
- OREGON SCHOOL FOR THE DEAF (Students: 117, Location: 999-A LOCUST ST NE, Grades: KG-12)
- WAKE ROBIN SCHOOL (Location: 1520 PLAZA ST NW STE 100, Grades: PK-12)
Private high schools in Salem:
- SALEM ACADEMY (Students: 672, Location: 942 LANCASTER DR NE, Grades: PK-12)
- BLANCHET SCHOOL (Students: 369, Location: 4373 MARKET ST NE, Grades: 6-12)
- WESTERN MENNONITE SCHOOL (Students: 230, Location: 9045 WALLACE RD NW, Grades: 6-12)
- LIVINGSTONE ADVENTIST ACADEMY (Students: 215, Location: 5771 FRUITLAND RD NE, Grades: PK-12)
- WILLAMETTE VALLEY CHRISTIAN SCHOOL (Students: 120, Location: 9075 PUEBLO AVE NE, Grades: KG-12)
- GRACE ACADEMY (Students: 4, Location: 4105 LANCASTER DR NE, Grades: 5-12)
Biggest public elementary/middle schools in Salem:
- WALKER MIDDLE SCHOOL (Students: 1,091, Location: 1075 8TH ST NW, Grades: 6-8)
- HOUCK MIDDLE SCHOOL (Students: 997, Location: 1155 CONNECTICUT, Grades: 6-8)
- STEPHENS MIDDLE SCHOOL (Students: 955, Location: 4962 HAYSVILLE DR NE, Grades: 6-8)
- JUDSON MIDDLE SCHOOL (Students: 905, Location: 4512 JONES RD S, Grades: 6-8)
- LESLIE MIDDLE SCHOOL (Students: 875, Location: 3850 PRINGLE RD SE, Grades: 6-8)
- WALDO MIDDLE SCHOOL (Students: 737, Location: 2805 LANSING AVE NE, Grades: 6-8)
- CROSSLER MIDDLE SCHOOL (Students: 721, Location: 1155 DAVIS RD S, Grades: 6-8)
- AUBURN ELEMENTARY SCHOOL (Students: 666, Location: 4612 AUBURN RD NE, Grades: KG-5)
- PARRISH MIDDLE SCHOOL (Students: 655, Location: 802 CAPITOL ST NE, Grades: 6-8)
- SCOTT ELEMENTARY SCHOOL (Students: 635, Location: 4700 ARIZONA AVE NE, Grades: KG-5)
Private elementary/middle schools in Salem:
- ST JOSEPH SCHOOL (Students: 196, Location: 373 WINTER ST NE, Grades: PK-6)
- RIVIERA CHRISTIAN SCHOOL (Students: 154, Location: 1650 BRUSH COLLEGE RD NW, Grades: PK-5)
- ABIQUA SCHOOL (Students: 149, Location: 4985 BATTLE CREEK RD SE STE 107, Grades: KG-8)
- QUEEN OF PEACE SCHOOL (Students: 145, Location: 4227 LONE OAK RD SE, Grades: PK-6)
- ST VINCENT DE PAUL SCHOOL (Students: 75, Location: 1015 COLUMBIA ST NE, Grades: PK-6)
- IMMANUEL EVANGELICAL LUTHERAN SCHOOL (Students: 61, Location: 510 IDYLWOOD DR SE, Grades: KG-8)
- HERITAGE SCHOOL (Students: 34, Location: 2050 STRONG RD SE, Grades: 1-7)
Library in Salem:
User-submitted facts and corrections:
- Please add to TV broadcast stations around Salem: KWVT (channel 52); Salem, OR; operator Northwest Television, LLC)
- KWBP is licensed to Salem Oregon and serves NOT ONLY Salem but most of the Willamette Valley channel 32, channel 4 is only a translator.
- I didn't see City View Cemetery in your list of seven cemeteries in Salem. It is at 390 Hoyt St. S., Salem, OR 97302 and would be just to the west of your location 4 for Pioneer Cemetery
- Professional baseball player: Born & raised in Salem, Oregon. Brett Evert. Drafted to the Braves in 1999, traded to Marines, and now with the Milwaukee Brewers. All AAA organizations.
Points of interest:
Notable locations in Salem: Swegle (A), Mitchell Corner (B), Minto (C), Oregon State Fairgrounds (D), Bush (E), Battle Creek Country Club (F), Oregon State Correctional Institution (G), Oregon State Penitentiary (H), Salem Golf Club (I), Salem Gun Club (J), Labish (K), Renard (L), L B Day Amphitheatre (M), Greyhound Station Salem (N), Cherriots Wal - Mart North Park and Ride (O), Cherriots Wal - Mart South Park and Ride (P), Cherriots Salem Keizer Transit Downtown Station (Q), Cherriots Salem Keizer Transit Dispatch Facilities (R), Cherriots Rite Aid Park and Ride (S), Cherriots Fred Meyer South Park and Ride (T). Display/hide their locations on the map
Churches in Salem include: Skyline Baptist Church (A), Messiah Lutheran Church (B), Salem Christian Center (C), Saint Pauls Episcopal Church (D), First Christian Church (E), Evergreen Church (F), West Hills Community Church (G), Kingwood Bible Church (H), Gateway Foursquare Church (I). Display/hide their locations on the map
Cemeteries: Hayesville Cemetery (1), Penitentiary Annex Cemetery (2), Saint Barbara Cemetery (3), Pioneer Cemetery (4), Lee Mission Cemetery (5), City View Cemetery (6), Belcrest Memorial Park (7). Display/hide their locations on the map
Lakes and reservoirs: Wirth Lake (A), Stone Quarry Lake (B), Berger Lake (C), Nelsons Pond (D), Blue Gill Lake (E). Display/hide their locations on the map
Streams, rivers, and creeks: Clark Creek (A), Laurel Creek (B), Mill Creek (C), Pettijohn Creek (D), Pringle Creek (E), Willamette Slough (F), Chatnicka Creek (G), Croisan Creek (H), Jory Creek (I). Display/hide their locations on the map
Parks in Salem include: Wes Bennett City Park (1), State Lands Ballfields City Park (2), South Village City Park (3), Woodmansee City Park (4), Fircrest City Park (5), Aldrich City Park (6), Barrick Field City Park (7), Gracemont City Park (8), Brush College City Park (9). Display/hide their locations on the map
Tourist attractions: Hallie Ford Museum of Art (900 State Street) (1), Marion County Historical Society And Museum (260 12th St SE) (2), Historic Deepwood Estate (Museums; 1116 Mission Street Southeast) (3), Brooks Historical Society (Museums; 3995 Brooklake Road Northeast) (4), Bush Barn Art Center (Museums; 600 Mission Street Southeast) (5), Keizer Heritage Foundation (Museums; 980 Chemawa Road Northeast) (6), Mission Mill Museum (1313 Mill Street Southeast) (7), Ac Gilbert's Discovery Village (Museums; 116 Marion Street Northeast) (8), Brunk House (Museums; 5705 Salem Dallas Highway Northwest) (9). Display/hide their approximate locations on the map
Hotels: Red Lion Hotel-Salem Reservations (3301 Market Street Northeast) (1), Shilo Inn Salem (3304 Market Street) (2), Econo Lodge Salem (3195 Portland Road Northeast) (3), Crossland - Salem (3535 Fisher Rd NE) (4), Best Western Mill Creek Inn (3125 Ryan Drive Southeast) (5), Best Value (3340 Astoria Way Northeast) (6), Best Western Pacific Highway (4646 Portland Road Northeast) (7), Howard Johnson Inn Salem (2250 Mission Street Southeast) (8), Phoenix Inn (4370 Commercial Street Southeast) (9). Display/hide their approximate locations on the map
Courts: Marion County - District Attorney-Walter Beglau- Da-Family Court (3030 Center Street Northeast) (1), Salem City - Municipal Court- Court (City Hall) (2), Fountain Court (950 Fir Street South) (3), Marion County - For Circuit Court Information- If Unable To Locate Desired Number (555 Court Northeast) (4), Oregon State - Finance & Corporate Securities Div (410 Labor Industries B) (5), Hooley Darlene Congresswoman (315 Mission Street Southeast) (6), Oregon State - Tax Court- Magistrate Division (Floor 3) (7), Oregon State - Tax Court (1241 State Street) (8), Oregon State - Courts- Office Of The State Court Administrator- Citizen Review B (1241 State Street) (9). Display/hide their approximate locations on the map
Birthplace of: Cathy McMorris Rodgers - Legislator, Charles L. McNary - Senator, John Zerzan - Philosopher, Kat Bjelland - Female singer, James E. West (politician) - Politician, Monroe Sweetland - Politician, Slats Gill - Basketball player-coach, Allen Weh - Recipient of the Purple Heart medal, Ann Aiken - Attorney and jurist, John B. Waldo - Politician.
Drinking water stations with addresses in Salem and their reported violations in the past:
OTE SANTIAM RIVER RA-NORTH (Population served: 2,000, Groundwater):Past monitoring violations:OTE SANTIAM RIVER RA-SOUTH (Population served: 2,000, Groundwater):
- Failure to Conduct Assessment Monitoring - Between JAN-2012 and DEC-2012, Contaminant: COLIPHAGE. Follow-up actions: St Violation/Reminder Notice (FEB-04-2013), St Compliance achieved (NOV-06-2013)
- One routine major monitoring violation
- 3 minor monitoring violations
- 2 regular monitoring violations
Past monitoring violations:OTE MANZANITA REST AREA (Population served: 1,200, Groundwater):
- Failure to Conduct Assessment Monitoring - Between JAN-2012 and DEC-2012, Contaminant: COLIPHAGE. Follow-up actions: St Violation/Reminder Notice (FEB-04-2013), St Compliance achieved (NOV-06-2013)
- One routine major monitoring violation
- 3 minor monitoring violations
- 3 regular monitoring violations
Past monitoring violations:ODOT HD CABIN CREEK REST AREA (Population served: 1,000, Groundwater):
- Failure to Conduct Assessment Monitoring - Between JAN-2013 and DEC-2013, Contaminant: COLIPHAGE
- Failure to Conduct Assessment Monitoring - Between JAN-2013 and DEC-2013, Contaminant: COLIPHAGE
- 8 routine major monitoring violations
- 2 minor monitoring violations
- 4 regular monitoring violations
Past monitoring violations:OTE BOARDMAN REST AREA (Population served: 999, Groundwater):
- Monitoring, Source Water (GWR) - In DEC-23-2012, Contaminant: E. COLI. Follow-up actions: St Violation/Reminder Notice (2 times from DEC-31-2012 to FEB-04-2013), St Compliance achieved (MAR-13-2013)
- Failure to Conduct Assessment Monitoring - Between JAN-2012 and DEC-2012, Contaminant: COLIPHAGE. Follow-up actions: St Violation/Reminder Notice (FEB-04-2013), St Compliance achieved (MAR-13-2013)
- Failure to Conduct Assessment Monitoring - Between JAN-2012 and DEC-2012, Contaminant: COLIPHAGE. Follow-up actions: St Violation/Reminder Notice (FEB-04-2013), St Compliance achieved (MAR-13-2013)
- Monitoring, Repeat Major (TCR) - Between JAN-2007 and MAR-2007, Contaminant: Coliform (TCR). Follow-up actions: St Compliance achieved (MAR-14-2008)
- 10 routine major monitoring violations
- One minor monitoring violation
- One regular monitoring violation
Past monitoring violations:OTE MEMALOOSE REST AREA (Population served: 800, Groundwater):
- One routine major monitoring violation
- 4 regular monitoring violations
Past monitoring violations:OTE WEATHERBY REST AREA (Population served: 500, Groundwater):
- Failure to Conduct Assessment Monitoring - Between JAN-2012 and DEC-2012, Contaminant: COLIPHAGE. Follow-up actions: St Violation/Reminder Notice (FEB-04-2013), St Compliance achieved (MAY-17-2013)
- 2 routine major monitoring violations
- 2 regular monitoring violations
Past monitoring violations:ODOT DEADMANS PASS REST AREA (Population served: 500, Groundwater):
- Failure to Conduct Assessment Monitoring - Between JAN-2012 and DEC-2012, Contaminant: COLIPHAGE. Follow-up actions: St Violation/Reminder Notice (FEB-04-2013), St Compliance achieved (NOV-05-2013)
- 5 routine major monitoring violations
- 3 regular monitoring violations
Past monitoring violations:
- 2 minor monitoring violations
- 4 regular monitoring violations
Drinking water stations with addresses in Salem that have no violations reported:
- OREGON 4-H CENTER (Population served: 284, Primary Water Source Type: Groundwater)
- SCHROEDERS GUEST HOUSE (Population served: 250, Primary Water Source Type: Groundwater)
| This city: | 2.5 people |
| Oregon: | 2.5 people |
| This city: | 63.3% |
| Whole state: | 63.4% |
| This city: | 8.0% |
| Whole state: | 8.0% |
Likely homosexual households (counted as self-reported same-sex unmarried-partner households)
- Lesbian couples: 0.5% of all households
- Gay men: 0.3% of all households
People in group quarters in Salem in 2010:
- 3,569 people in state prisons
- 1,828 people in college/university student housing
- 766 people in local jails and other municipal confinement facilities
- 639 people in nursing facilities/skilled-nursing facilities
- 610 people in group homes intended for adults
- 300 people in mental (psychiatric) hospitals and psychiatric units in other hospitals
- 281 people in emergency and transitional shelters (with sleeping facilities) for people experiencing homelessness
- 208 people in correctional facilities intended for juveniles
- 140 people in residential treatment centers for adults
- 114 people in other noninstitutional facilities
- 81 people in correctional residential facilities
- 52 people in workers' group living quarters and job corps centers
- 18 people in in-patient hospice facilities
- 16 people in group homes for juveniles (non-correctional)
- 13 people in residential treatment centers for juveniles (non-correctional)
People in group quarters in Salem in 2000:
- 3,742 people in state prisons
- 1,341 people in college dormitories (includes college quarters off campus)
- 1,063 people in nursing homes
- 691 people in other noninstitutional group quarters
- 681 people in local jails and other confinement facilities (including police lockups)
- 601 people in mental (psychiatric) hospitals or wards
- 281 people in homes for the mentally retarded
- 142 people in training schools for juvenile delinquents
- 90 people in short-term care, detention or diagnostic centers for delinquent children
- 70 people in other nonhousehold living situations
- 63 people in other group homes
- 56 people in homes for the mentally ill
- 33 people in hospitals/wards and hospices for chronically ill
- 33 people in other hospitals or wards for chronically ill
- 15 people in agriculture workers' dormitories on farms
- 8 people in residential treatment centers for emotionally disturbed children
- 3 people in homes or halfway houses for drug/alcohol abuse
- 3 people in religious group quarters
Banks with most branches in Salem (2011 data):
- U.S. Bank National Association: 10 branches. Info updated 2012/01/30: Bank assets: $330,470.8 mil, Deposits: $236,091.5 mil, headquarters in Cincinnati, OH, positive income, 3121 total offices, Holding Company: U.S. Bancorp
- Wells Fargo Bank, National Association: 8 branches. Info updated 2011/04/05: Bank assets: $1,161,490.0 mil, Deposits: $905,653.0 mil, headquarters in Sioux Falls, SD, positive income, 6395 total offices, Holding Company: Wells Fargo & Company
- JPMorgan Chase Bank, National Association: 8 branches. Info updated 2011/11/10: Bank assets: $1,811,678.0 mil, Deposits: $1,190,738.0 mil, headquarters in Columbus, OH, positive income, International Specialization, 5577 total offices, Holding Company: Jpmorgan Chase & Co.
- West Coast Bank: 7 branches. Info updated 2010/09/16: Bank assets: $2,424.8 mil, Deposits: $1,925.6 mil, headquarters in Lake Oswego, OR, positive income, Commercial Lending Specialization, 63 total offices, Holding Company: West Coast Bancorp
- KeyBank National Association: North Salem Branch, West Salem Branch, State Street Branch, Lancaster Branch, Battle Creek Branch. Info updated 2008/03/03: Bank assets: $86,198.8 mil, Deposits: $64,214.8 mil, headquarters in Cleveland, OH, positive income, Commercial Lending Specialization, 1067 total offices, Holding Company: Keycorp
- Umpqua Bank: Lancaster Branch, Salem Main Branch, Candalaria Branch. Info updated 2011/09/02: Bank assets: $11,556.7 mil, Deposits: $9,325.3 mil, headquarters in Roseburg, OR, positive income, Commercial Lending Specialization, 193 total offices, Holding Company: Umpqua Holdings Corporation
- Bank of America, National Association: Salem Branch at 390 High St N E, branch established on 1890/01/01; Lancaster Branch at 3803 Center Street Northeast, branch established on 1997/09/29. Info updated 2009/11/18: Bank assets: $1,451,969.3 mil, Deposits: $1,077,176.8 mil, headquarters in Charlotte, NC, positive income, 5782 total offices, Holding Company: Bank Of America Corporation
- Washington Federal: North Salem at 2955 Broadway Street Ne, branch established on 1934/03/01; West Salem Branch at 777 Wallace Road N.W., branch established on 1934/03/01. Info updated 2011/12/19: Bank assets: $13,653.0 mil, Deposits: $8,905.8 mil, headquarters in Seattle, WA, positive income, Mortgage Lending Specialization, 174 total offices
- Pioneer Trust Bank, National Association: at 109 Commercial Street, N.E., branch established on 1924/01/01; Medical Center Branch at 1190 Oak Street, S.E., branch established on 1975/02/19. Info updated 2006/11/03: Bank assets: $307.6 mil, Deposits: $262.4 mil, local headquarters, positive income, Commercial Lending Specialization, 2 total offices, Holding Company: Ptb Corporation
- 5 other banks with 6 local branches
For population 15 years and over in Salem:
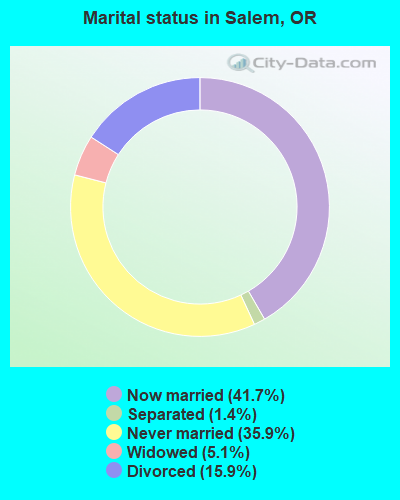
- Never married: 35.9%
- Now married: 41.7%
- Separated: 1.4%
- Widowed: 5.1%
- Divorced: 15.9%
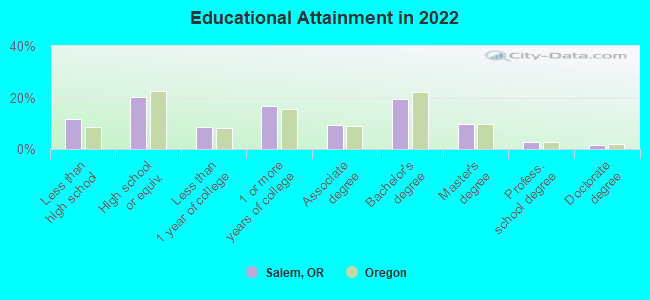
For population 25 years and over in Salem:
- High school or higher: 88.4%
- Bachelor's degree or higher: 33.4%
- Graduate or professional degree: 14.0%
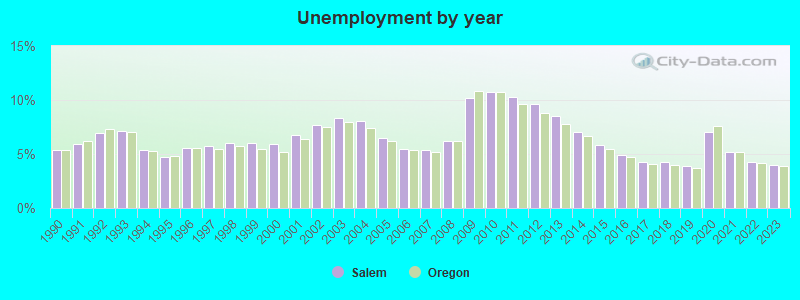
- Unemployed: 4.8%
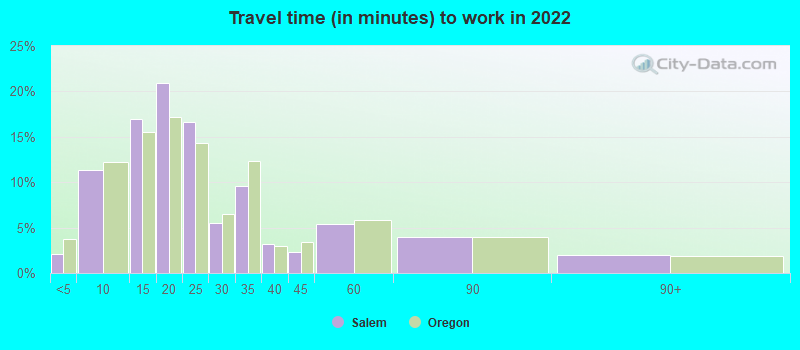
- Mean travel time to work (commute): 19.4 minutes
| Here: | 13.3 |
| Oregon average: | 11.6 |

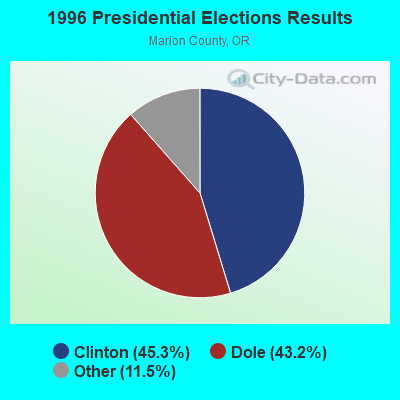
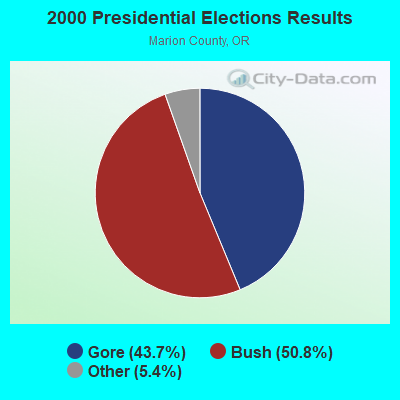
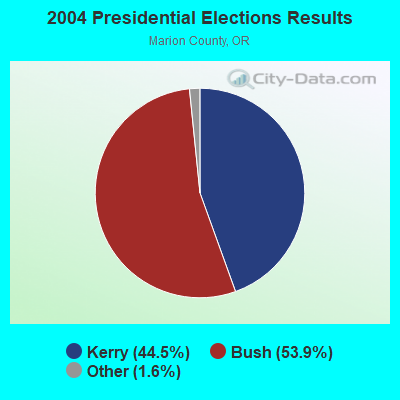
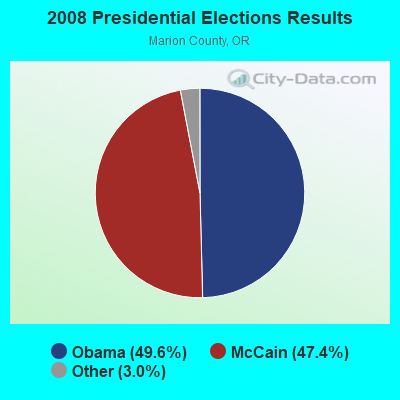
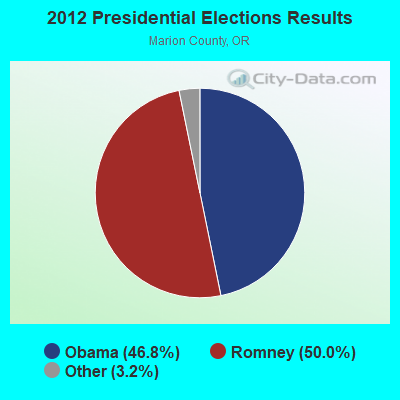
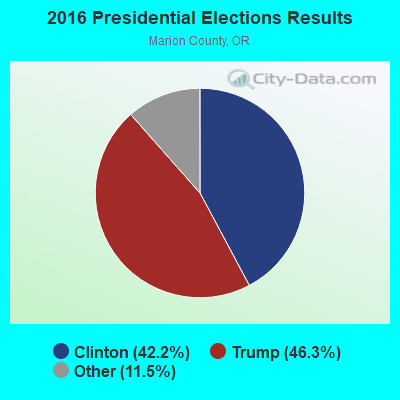
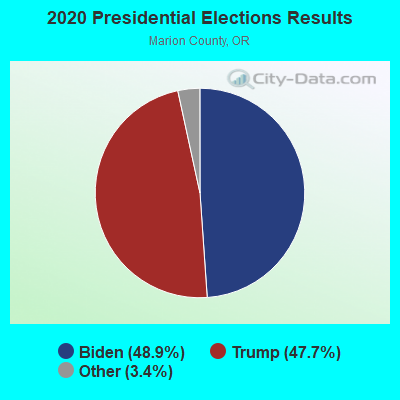
Graphs represent county-level data. Detailed 2008 Election Results
Neighborhoods in Salem:
(Salem, Oregon Neighborhood Map)Religion statistics for Salem, OR (based on Marion County data)
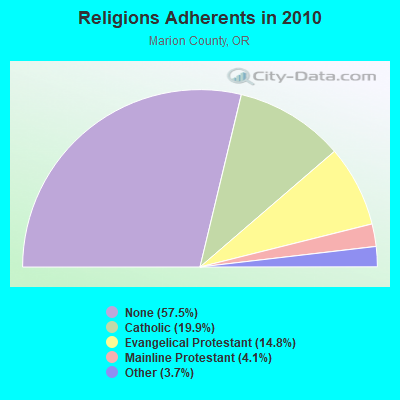
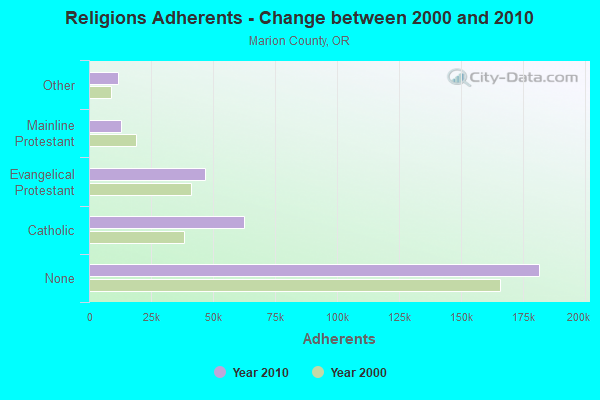
| Religion | Adherents | Congregations |
|---|---|---|
| Catholic | 62,607 | 15 |
| Evangelical Protestant | 46,619 | 186 |
| Mainline Protestant | 12,797 | 41 |
| Other | 11,663 | 46 |
| Black Protestant | 189 | 1 |
| Orthodox | - | - |
| None | 181,460 | - |
Food Environment Statistics:
| This county: | 1.71 / 10,000 pop. |
| Oregon: | 2.03 / 10,000 pop. |
| Here: | 0.29 / 10,000 pop. |
| Oregon: | 0.33 / 10,000 pop. |
| Marion County: | 1.61 / 10,000 pop. |
| State: | 2.01 / 10,000 pop. |
| This county: | 1.52 / 10,000 pop. |
| Oregon: | 1.69 / 10,000 pop. |
| Marion County: | 6.68 / 10,000 pop. |
| Oregon: | 9.93 / 10,000 pop. |
| Marion County: | 8.2% |
| Oregon: | 7.4% |
| Marion County: | 29.5% |
| Oregon: | 25.6% |
| This county: | 18.4% |
| Oregon: | 14.2% |
Health and Nutrition:
| This city: | 48.8% |
| Oregon: | 49.6% |
| Salem: | 46.4% |
| State: | 46.8% |
| This city: | 28.2 |
| Oregon: | 28.5 |
| Here: | 20.9% |
| State: | 21.2% |
| Salem: | 10.0% |
| Oregon: | 10.1% |
| Salem: | 6.8 |
| Oregon: | 6.8 |
| This city: | 31.7% |
| Oregon: | 33.3% |
| Salem: | 56.4% |
| Oregon: | 56.5% |
| Salem: | 79.3% |
| Oregon: | 78.7% |
More about Health and Nutrition of Salem, OR Residents
| Local government employment and payroll (March 2022) | |||||
| Function | Full-time employees | Monthly full-time payroll | Average yearly full-time wage | Part-time employees | Monthly part-time payroll |
|---|---|---|---|---|---|
| Police Protection - Officers | 181 | $1,728,686 | $114,609 | 0 | $0 |
| Other and Unallocable | 180 | $1,212,839 | $80,856 | 1 | $5,293 |
| Firefighters | 158 | $1,718,062 | $130,486 | 0 | $0 |
| Sewerage | 104 | $661,453 | $76,322 | 1 | $1,703 |
| Financial Administration | 86 | $657,545 | $91,750 | 9 | $12,924 |
| Water Supply | 73 | $426,309 | $70,078 | 0 | $0 |
| Fire - Other | 72 | $547,162 | $91,194 | 6 | $17,526 |
| Other Government Administration | 57 | $416,058 | $87,591 | 3 | $3,174 |
| Streets and Highways | 52 | $302,880 | $69,895 | 0 | $0 |
| Parks and Recreation | 50 | $266,258 | $63,902 | 23 | $38,847 |
| Welfare | 45 | $236,300 | $63,013 | 0 | $0 |
| Police - Other | 42 | $248,393 | $70,969 | 15 | $37,864 |
| Local Libraries | 33 | $177,408 | $64,512 | 13 | $27,064 |
| Judicial and Legal | 27 | $204,991 | $91,107 | 7 | $16,087 |
| Housing and Community Development (Local) | 16 | $125,686 | $94,265 | 1 | $2,236 |
| Natural Resources | 13 | $72,230 | $66,674 | 0 | $0 |
| Health | 9 | $70,538 | $94,051 | 0 | $0 |
| Solid Waste Management | 7 | $33,593 | $57,588 | 0 | $0 |
| Airports | 4 | $27,378 | $82,134 | 0 | $0 |
| Totals for Government | 1,209 | $9,133,769 | $90,658 | 79 | $162,717 |
Salem government finances - Expenditure in 2021 (per resident):
- Construction - Regular Highways: $45,678,000 ($257.36)
General - Other: $23,426,000 ($131.99)
Sewerage: $20,931,000 ($117.93)
Water Utilities: $9,887,000 ($55.71)
Housing and Community Development: $1,976,000 ($11.13)
- Current Operations - Police Protection: $46,771,000 ($263.52)
Sewerage: $46,337,000 ($261.07)
Housing and Community Development: $40,825,000 ($230.02)
Local Fire Protection: $36,450,000 ($205.37)
Water Utilities: $27,940,000 ($157.42)
General - Other: $27,298,000 ($153.80)
Regular Highways: $14,911,000 ($84.01)
Parks and Recreation: $12,920,000 ($72.79)
Libraries: $4,712,000 ($26.55)
Protective Inspection and Regulation - Other: $4,600,000 ($25.92)
Judicial and Legal Services: $4,395,000 ($24.76)
General Public Buildings: $4,177,000 ($23.53)
Financial Administration: $3,694,000 ($20.81)
Central Staff Services: $2,874,000 ($16.19)
Parking Facilities: $1,563,000 ($8.81)
Air Transportation: $1,281,000 ($7.22)
Health - Other: $766,000 ($4.32)
- General - Interest on Debt: $25,462,000 ($143.46)
- Intergovernmental to Local - Other - General - Other: $894,000 ($5.04)
- Other Capital Outlay - General - Other: $325,000 ($1.83)
Health - Other: $161,000 ($0.91)
Parks and Recreation: $61,000 ($0.34)
Regular Highways: $58,000 ($0.33)
- Water Utilities - Interest on Debt: $3,202,000 ($18.04)
Salem government finances - Revenue in 2021 (per resident):
- Charges - Sewerage: $65,542,000 ($369.28)
Other: $6,474,000 ($36.48)
Parks and Recreation: $3,869,000 ($21.80)
Housing and Community Development: $3,448,000 ($19.43)
Parking Facilities: $1,651,000 ($9.30)
Air Transportation: $1,235,000 ($6.96)
Regular Highways: $223,000 ($1.26)
- Federal Intergovernmental - Housing and Community Development: $22,395,000 ($126.18)
- Local Intergovernmental - Other: $12,166,000 ($68.55)
- Miscellaneous - Interest Earnings: $25,714,000 ($144.88)
Special Assessments: $8,159,000 ($45.97)
Sale of Property: $2,723,000 ($15.34)
General Revenue - Other: $2,394,000 ($13.49)
Fines and Forfeits: $2,335,000 ($13.16)
Rents: $1,526,000 ($8.60)
- Revenue - Water Utilities: $42,292,000 ($238.28)
- State Intergovernmental - Highways: $26,379,000 ($148.62)
Other: $14,775,000 ($83.25)
General Local Government Support: $7,000,000 ($39.44)
Housing and Community Development: $4,410,000 ($24.85)
Health and Hospitals: $21,000 ($0.12)
- Tax - Property: $108,005,000 ($608.52)
Public Utilities Sales: $22,789,000 ($128.40)
Other License: $20,380,000 ($114.83)
Other Selective Sales: $4,806,000 ($27.08)
Salem government finances - Debt in 2021 (per resident):
- Long Term Debt - Beginning Outstanding - Public Debt for Private Purpose: $605,666,000 ($3412.45)
Outstanding Nonguaranteed - Industrial Revenue: $524,019,000 ($2952.44)
Beginning Outstanding - Unspecified Public Purpose: $291,415,000 ($1641.89)
Outstanding Unspecified Public Purpose: $261,710,000 ($1474.53)
Retired Nonguaranteed - Public Debt for Private Purpose: $81,647,000 ($460.02)
Retired Unspecified Public Purpose: $29,705,000 ($167.36)
Salem government finances - Cash and Securities in 2021 (per resident):
- Bond Funds - Cash and Securities: $88,969,000 ($501.27)
- Other Funds - Cash and Securities: $342,990,000 ($1932.48)
- Sinking Funds - Cash and Securities: $1,318,690,000 ($7429.78)
| Businesses in Salem, OR | ||||
| Name | Count | Name | Count | |
|---|---|---|---|---|
| 24 Hour Fitness | 1 | Lane Furniture | 5 | |
| 7-Eleven | 4 | LensCrafters | 1 | |
| AMF Bowling | 1 | Little Caesars Pizza | 3 | |
| AT&T | 6 | Lowe's | 1 | |
| Ace Hardware | 2 | Macy's | 2 | |
| Aeropostale | 1 | MasterBrand Cabinets | 2 | |
| American Eagle Outfitters | 1 | Maurices | 1 | |
| Applebee's | 3 | Mazda | 1 | |
| Arby's | 2 | McDonald's | 12 | |
| Ashley Furniture | 1 | Motel 6 | 1 | |
| AutoZone | 3 | Motherhood Maternity | 3 | |
| BMW | 1 | New Balance | 6 | |
| Baja Fresh Mexican Grill | 1 | Nike | 10 | |
| Baskin-Robbins | 6 | Nissan | 1 | |
| Bath & Body Works | 2 | Nordstrom | 1 | |
| Best Western | 2 | Office Depot | 2 | |
| Blockbuster | 3 | OfficeMax | 1 | |
| Budget Car Rental | 1 | Olive Garden | 1 | |
| Burger King | 6 | Outback | 1 | |
| Burlington Coat Factory | 1 | Outback Steakhouse | 1 | |
| Carl\s Jr. | 4 | Pac Sun | 2 | |
| Casual Male XL | 1 | Panda Express | 2 | |
| Catherines | 1 | Papa John's Pizza | 1 | |
| Chevrolet | 1 | Payless | 2 | |
| Chipotle | 1 | Penske | 2 | |
| Chuck E. Cheese's | 1 | PetSmart | 1 | |
| Circle K | 5 | Pier 1 Imports | 1 | |
| Cold Stone Creamery | 2 | Pizza Hut | 3 | |
| Comfort Inn | 1 | Plato's Closet | 1 | |
| Comfort Suites | 1 | Popeyes | 1 | |
| Costco | 1 | Quiznos | 4 | |
| Cricket Wireless | 7 | RadioShack | 3 | |
| Crossland Economy Studios | 1 | Red Lobster | 1 | |
| Curves | 3 | Red Robin | 1 | |
| DHL | 3 | Rite Aid | 3 | |
| Dairy Queen | 8 | Rodeway Inn | 1 | |
| Days Inn | 1 | Rue21 | 1 | |
| Deb | 1 | SAS Shoes | 2 | |
| Dennys | 2 | SONIC Drive-In | 1 | |
| Discount Tire | 1 | Safeway | 4 | |
| Domino's Pizza | 3 | Sears | 3 | |
| Famous Footwear | 2 | Sephora | 1 | |
| Fashion Bug | 1 | Spencer Gifts | 1 | |
| FedEx | 15 | Sprint Nextel | 3 | |
| Firestone Complete Auto Care | 2 | Starbucks | 14 | |
| Foot Locker | 2 | Subaru | 1 | |
| Ford | 1 | Subway | 16 | |
| GNC | 3 | Super 8 | 1 | |
| GameStop | 3 | T-Mobile | 10 | |
| Gymboree | 1 | T.J.Maxx | 1 | |
| H&R Block | 10 | Taco Bell | 5 | |
| Home Depot | 2 | Target | 1 | |
| HomeTown Buffet | 1 | The Room Place | 1 | |
| Honda | 1 | Torrid | 1 | |
| Hot Topic | 1 | Toyota | 1 | |
| Howard Johnson | 1 | Toys"R"Us | 1 | |
| IHOP | 1 | Trader Joe's | 1 | |
| JCPenney | 1 | Travelodge | 1 | |
| Jack In The Box | 5 | True Value | 1 | |
| Jamba Juice | 3 | U-Haul | 12 | |
| Jones New York | 2 | UPS | 19 | |
| Journeys | 1 | Vans | 6 | |
| Justice | 1 | Verizon Wireless | 2 | |
| KFC | 4 | Victoria's Secret | 2 | |
| Kincaid | 4 | Volkswagen | 1 | |
| Kmart | 1 | Vons | 4 | |
| Kohl's | 1 | Walgreens | 6 | |
| Kroger | 8 | Walmart | 3 | |
| La Quinta | 1 | Wendy's | 2 | |
| La-Z-Boy | 1 | YMCA | 1 | |
Strongest AM radio stations in Salem:
- KSLM (1390 AM; 10 kW; SALEM, OR)
- KBZY (1490 AM; 1 kW; SALEM, OR; Owner: CAPITAL BROADCASTING, INC.)
- KYKN (1430 AM; 5 kW; KEIZER, OR; Owner: WILLAMETTE BROADCASTING CO., INC.)
- KCCS (1220 AM; 1 kW; SALEM, OR; Owner: CHRISTIAN CENTER OF SALEM)
- KPOJ (620 AM; 50 kW; PORTLAND, OR; Owner: CITICASTERS LICENSES, L.P.)
- KXL (750 AM; 50 kW; PORTLAND, OR; Owner: ROSE CITY RADIO CORPORATION)
- KWIP (880 AM; 5 kW; DALLAS, OR; Owner: JUPITER COMMUNICATIONS CORPORATION)
- KEX (1190 AM; 50 kW; PORTLAND, OR; Owner: CITICASTERS LICENSES, L.P.)
- KKSN (1520 AM; 50 kW; OREGON CITY, OR; Owner: ENTERCOM PORTLAND LICENSE, LLC)
- KPAM (860 AM; 50 kW; TROUTDALE, OR; Owner: PAMPLIN BROADCASTING-OREGON, INC.)
- KOTK (1080 AM; 50 kW; PORTLAND, OR; Owner: FISHER BROADCASTING - PORTLAND RADIO, L.L.C.)
- KOAC (550 AM; 5 kW; CORVALLIS, OR; Owner: OREGON PUBLIC BROADCASTING)
- KKAD (1550 AM; 50 kW; VANCOUVER, WA; Owner: PAMPLIN BROADCASTING-WASHINGTON, INC)
Strongest FM radio stations in Salem:
- K242AB (96.3 FM; SALEM, OR; Owner: CITICASTERS LICENSES, L.P.)
- K231AB (94.1 FM; TURNER, OR; Owner: STATE OF OREGON / STATE BOARD OF EDUCATION)
- KLVU (107.1 FM; SWEET HOME, OR; Owner: EDUCATIONAL MEDIA FOUNDATION)
- KHPE (107.9 FM; ALBANY, OR; Owner: INTEGRITY MEDIA, INC.)
- K264AA (100.7 FM; CORVALLIS, ETC., OR; Owner: THE KBOO FOUNDATION)
- KLOO-FM (106.3 FM; CORVALLIS, OR; Owner: CITICASTERS LICENSES, L.P.)
- KRSK (105.1 FM; MOLALLA, OR; Owner: ENTERCOM PORTLAND LICENSE, LLC)
- KRKT-FM (99.9 FM; ALBANY, OR; Owner: CITICASTERS LICENSES, L.P.)
- K243AL (96.5 FM; CORVALLIS, OR; Owner: CUMULUS LICENSING CORP.)
- K228DT (93.5 FM; HAPPY HOLLOW, OR; Owner: OREGON PUBLIC BROADCASTING)
- K276BU (103.1 FM; CORVALLIS, OR; Owner: OREGON PUBLIC BROADCASTING)
- K273AJ (102.5 FM; ELWOOD, OR; Owner: CALVARY CHAPEL OF TWIN FALLS, INC.)
- KXPC-FM (103.7 FM; LEBANON, OR; Owner: PORTLAND BROADCASTING, L.L.C.)
- KDUK-FM (104.7 FM; FLORENCE, OR; Owner: CAPSTAR TX LIMITED PARTNERSHIP)
- K207BX (89.3 FM; EUGENE, OR; Owner: PENSACOLA CHRISTIAN COLLEGE, INC.)
- KFLY (101.5 FM; CORVALLIS, OR; Owner: CITICASTERS LICENSES, L.P.)
- K225AI (92.9 FM; PORTLAND, OR; Owner: EDUCATIONAL MEDIA FOUNDATION)
- K203BT (88.5 FM; EUGENE, OR; Owner: CALVARY CHAPEL OF TWIN FALLS, INC.)
- K214CI (90.7 FM; EUGENE, OR; Owner: EDUCATIONAL MEDIA FOUNDATION)
- KINK (101.9 FM; PORTLAND, OR; Owner: INFINITY RADIO OPERATIONS INC.)
TV broadcast stations around Salem:
- KPXG (Channel 22; SALEM, OR; Owner: PAXSON SALEM LICENSE, INC.)
- K61CC (Channel 61; SALEM, OR; Owner: NORTHWEST CHRISTIAN BROADCASTING)
- K50GG (Channel 50; SALEM, OR; Owner: MEREDITH CORPORATION)
- K67GU (Channel 67; EUREKA, CA; Owner: MS COMMUNICATIONS, LLC)
- KATU (Channel 2; PORTLAND, OR; Owner: FISHER BROADCASTING - PORTLAND TV, L.L.C.)
- KWBP (Channel 32; SALEM, OR; Owner: TRIBUNE BROADCAST HOLDINGS, INC.)
- KPDX (Channel 49; VANCOUVER, WA; Owner: MEREDITH CORPORATION)
- KPTV (Channel 12; PORTLAND, OR; Owner: MEREDITH CORPORATION)
- K57IF (Channel 57; SALEM, OR; Owner: LaGRANDE BROADCASTING, INC.)
- KOIN (Channel 6; PORTLAND, OR; Owner: EMMIS TELEVISION LICENSE CORPORATION)
- KNMT (Channel 24; PORTLAND, OR; Owner: NATIONAL MINORITY T.V., INC.)
- National Bridge Inventory (NBI) Statistics
- 174Number of bridges
- 2,382ft / 726mTotal length
- $106,556,000Total costs
- 4,682,922Total average daily traffic
- 644,917Total average daily truck traffic
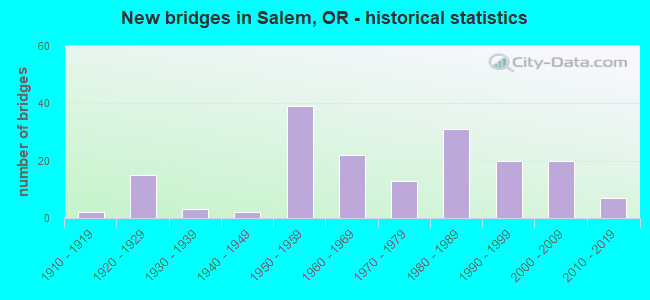
- New bridges - historical statistics
- 21910-1919
- 151920-1929
- 31930-1939
- 21940-1949
- 391950-1959
- 221960-1969
- 131970-1979
- 311980-1989
- 201990-1999
- 202000-2009
- 72010-2019
FCC Registered Antenna Towers: 934 (See the full list of FCC Registered Antenna Towers)
FCC Registered Commercial Land Mobile Towers: 10 (See the full list of FCC Registered Commercial Land Mobile Towers in Salem, OR)
FCC Registered Private Land Mobile Towers: 12 (See the full list of FCC Registered Private Land Mobile Towers)
FCC Registered Broadcast Land Mobile Towers: 181 (See the full list of FCC Registered Broadcast Land Mobile Towers)
FCC Registered Microwave Towers: 238 (See the full list of FCC Registered Microwave Towers in this town)
FCC Registered Paging Towers: 36 (See the full list of FCC Registered Paging Towers)
FCC Registered Maritime Coast & Aviation Ground Towers: 11 (See the full list of FCC Registered Maritime Coast & Aviation Ground Towers)
FCC Registered Amateur Radio Licenses: 1,756 (See the full list of FCC Registered Amateur Radio Licenses in Salem)
FAA Registered Aircraft Manufacturers and Dealers: 2 (See the full list of FAA Registered Manufacturers and Dealers in Salem)
FAA Registered Aircraft: 293 (See the full list of FAA Registered Aircraft)
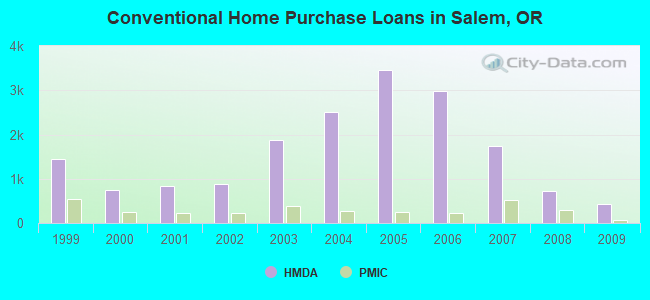
| Home Mortgage Disclosure Act Aggregated Statistics For Year 2009 (Based on 14 full and 15 partial tracts) | ||||||||||||||
| A) FHA, FSA/RHS & VA Home Purchase Loans | B) Conventional Home Purchase Loans | C) Refinancings | D) Home Improvement Loans | E) Loans on Dwellings For 5+ Families | F) Non-occupant Loans on < 5 Family Dwellings (A B C & D) | G) Loans On Manufactured Home Dwelling (A B C & D) | ||||||||
|---|---|---|---|---|---|---|---|---|---|---|---|---|---|---|
| Number | Average Value | Number | Average Value | Number | Average Value | Number | Average Value | Number | Average Value | Number | Average Value | Number | Average Value | |
| LOANS ORIGINATED | 622 | $174,754 | 440 | $172,721 | 2,543 | $176,697 | 90 | $95,990 | 18 | $645,082 | 194 | $142,771 | 42 | $84,906 |
| APPLICATIONS APPROVED, NOT ACCEPTED | 57 | $167,712 | 75 | $183,768 | 362 | $179,875 | 30 | $31,905 | 1 | $65,000 | 33 | $158,485 | 17 | $61,946 |
| APPLICATIONS DENIED | 109 | $164,886 | 98 | $148,403 | 994 | $179,043 | 85 | $78,126 | 1 | $639,770 | 106 | $135,334 | 43 | $85,787 |
| APPLICATIONS WITHDRAWN | 65 | $165,416 | 67 | $197,395 | 730 | $183,118 | 22 | $120,826 | 3 | $307,000 | 46 | $132,335 | 4 | $118,998 |
| FILES CLOSED FOR INCOMPLETENESS | 7 | $155,071 | 16 | $141,489 | 111 | $178,474 | 6 | $113,420 | 0 | $0 | 11 | $151,711 | 4 | $67,370 |
Detailed mortgage data for all 29 tracts in Salem, OR
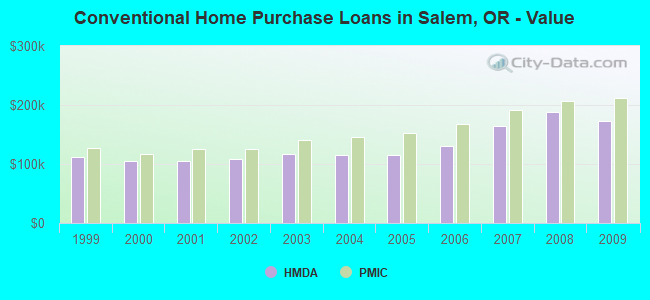
| Private Mortgage Insurance Companies Aggregated Statistics For Year 2009 (Based on 14 full and 14 partial tracts) | ||||||
| A) Conventional Home Purchase Loans | B) Refinancings | C) Non-occupant Loans on < 5 Family Dwellings (A & B) | ||||
|---|---|---|---|---|---|---|
| Number | Average Value | Number | Average Value | Number | Average Value | |
| LOANS ORIGINATED | 73 | $211,041 | 56 | $220,725 | 1 | $180,530 |
| APPLICATIONS APPROVED, NOT ACCEPTED | 23 | $252,338 | 32 | $224,999 | 2 | $221,320 |
| APPLICATIONS DENIED | 12 | $252,365 | 22 | $216,873 | 0 | $0 |
| APPLICATIONS WITHDRAWN | 2 | $316,540 | 8 | $213,992 | 1 | $176,000 |
| FILES CLOSED FOR INCOMPLETENESS | 1 | $87,600 | 1 | $267,620 | 0 | $0 |
2002 - 2018 National Fire Incident Reporting System (NFIRS) incidents
- Fire incident types reported to NFIRS in Salem, OR
- 5,04049.9%Outside Fires
- 3,23032.0%Structure Fires
- 1,72217.1%Mobile Property/Vehicle Fires
- 991.0%Other
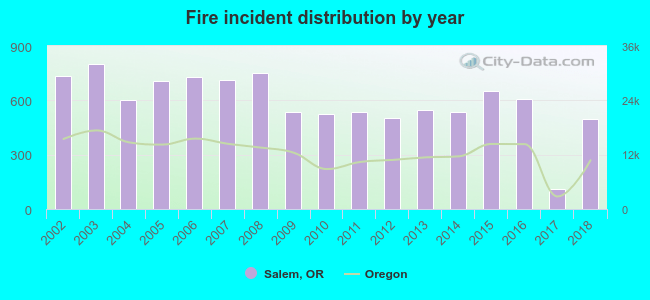 According to the data from the years 2002 - 2018 the average number of fire incidents per year is 594. The highest number of reported fires - 803 took place in 2003, and the least - 112 in 2017. The data has a dropping trend.
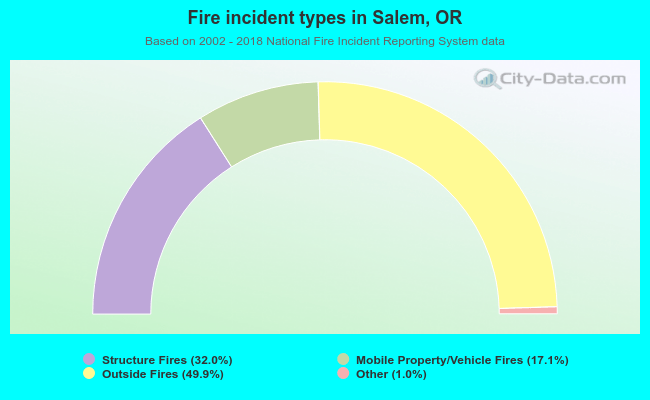 When looking into fire subcategories, the most reports belonged to: Outside Fires (49.9%), and Structure Fires (32.0%).
Fire-safe hotels and motels in Salem, Oregon:
- City Center Motel, 510 Liberty St Se, Salem, Oregon 97301 , Phone: (503) 364-0121, Fax: (503) 581-0554
- Howard Johnson Inn, 2250 Msn St SE, Salem, Oregon 97302 , Phone: (503) 375-7710, Fax: (503) 581-9300
- Red Lion Hotel, 3301 Market St NE, Salem, Oregon 97301 , Phone: (503) 370-7888, Fax: (503) 370-6305
- Super 8 Motel Salem, 1288 Hawthorne Ave Ne, Salem, Oregon 97301 , Phone: (503) 370-8888, Fax: (503) 370-8927
- Days Inn, 1600 Motor Ct N E, Salem, Oregon 97301 , Phone: (503) 581-1559, Fax: (503) 364-4272
- Best Western Mill Creek Inn, 3125 Ryan Dr Ne, Salem, Oregon 97301 , Phone: (503) 585-3332, Fax: (503) 375-9618
- Motel 6, 1401 Hawthorne Ave Ne, Salem, Oregon 97301 , Phone: (503) 371-8024, Fax: (503) 371-7691
- Phoenix Inn Suites, 4370 Commercial St SE, Salem, Oregon 97302 , Phone: (503) 588-9220, Fax: (505) 585-3616
- 14 other hotels and motels
| Most common first names in Salem, OR among deceased individuals | ||
| Name | Count | Lived (average) |
|---|---|---|
| John | 1,114 | 75.7 years |
| William | 1,024 | 75.7 years |
| Robert | 908 | 71.2 years |
| Mary | 890 | 80.4 years |
| James | 807 | 72.0 years |
| George | 691 | 77.7 years |
| Charles | 663 | 75.2 years |
| Helen | 537 | 81.3 years |
| Margaret | 491 | 81.6 years |
| Ruth | 455 | 82.0 years |
| Most common last names in Salem, OR among deceased individuals | ||
| Last name | Count | Lived (average) |
|---|---|---|
| Smith | 524 | 76.4 years |
| Johnson | 458 | 76.7 years |
| Miller | 312 | 78.3 years |
| Brown | 255 | 78.0 years |
| Wilson | 253 | 77.1 years |
| Jones | 252 | 78.0 years |
| Anderson | 237 | 75.8 years |
| Davis | 197 | 74.1 years |
| Nelson | 187 | 77.9 years |
| Williams | 182 | 74.8 years |
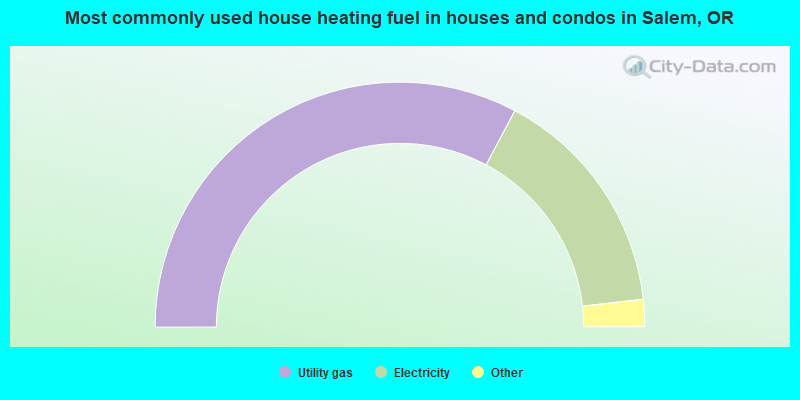
- 65.5%Utility gas
- 30.8%Electricity
- 1.4%Bottled, tank, or LP gas
- 1.0%Wood
- 0.9%Fuel oil, kerosene, etc.
- 0.2%Other fuel
- 0.1%No fuel used
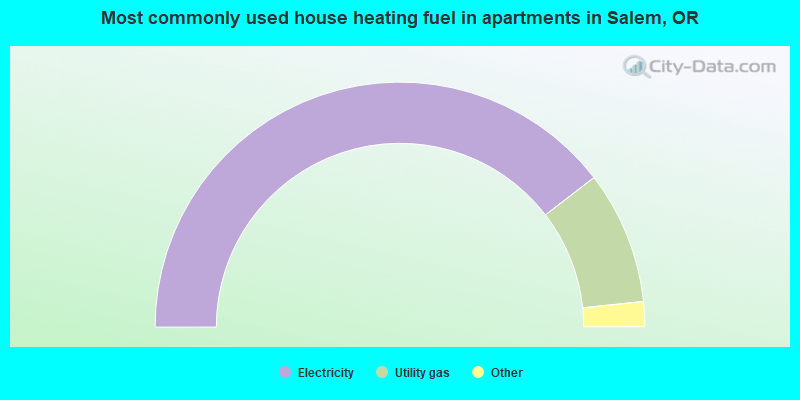
- 79.2%Electricity
- 17.6%Utility gas
- 1.2%Bottled, tank, or LP gas
- 1.0%No fuel used
- 0.7%Wood
- 0.1%Fuel oil, kerosene, etc.
- 0.1%Solar energy
- 0.1%Other fuel
Salem compared to Oregon state average:
- Unemployed percentage significantly below state average.
- Hispanic race population percentage above state average.
- Foreign-born population percentage above state average.
- Institutionalized population percentage above state average.
Salem, OR compared to other similar cities:
Salem on our top lists:
- #19 on the list of "Top 101 cities with largest percentage of females in occupations: farming, fishing, and forestry occupations (population 50,000+)"
- #22 on the list of "Top 101 cities with largest percentage of females in industries: agriculture, forestry, fishing and hunting (population 50,000+)"
- #24 on the list of "Top 101 cities with the lowest minimum monthly sunshine amount (population 50,000+)"
- #25 on the list of "Top 101 cities with largest percentage of females in occupations: food preparation and serving related occupations (population 50,000+)"
- #30 on the list of "Top 101 cities with largest percentage of females in industries: public administration (population 50,000+)"
- #36 on the list of "Top 101 cities with the lowest average sunshine amount (population 50,000+)"
- #37 on the list of "Top 101 cities with the lowest average wind speeds (population 50,000+)"
- #38 on the list of "Top 101 cities with the largest city-data.com crime index increase from 2011 to 2012 (population 50,000+)"
- #61 on the list of "Top 101 cities with largest percentage of males in occupations: healthcare support occupations (population 50,000+)"
- #72 on the list of "Top 101 cities with largest percentage of males in industries: health care and social assistance (population 50,000+)"
- #78 on the list of "Top 101 cities with largest percentage of males in occupations: health diagnosing and treating practitioners and other technical occupations (population 50,000+)"
- #87 on the list of "Top 101 cities with the largest city-data.com crime index decrease from 2002 to 2012 (population 50,000+)"
- #93 on the list of "Top 101 cities with largest percentage of males in occupations: farming, fishing, and forestry occupations (population 50,000+)"
- #94 on the list of "Top 101 cities with largest percentage of females in occupations: construction and extraction occupations (population 50,000+)"
- #97 on the list of "Top 101 cities with the largest sunshine amount differences during a year (population 50,000+)"
- #26 on the list of "Top 101 counties with the lowest percentage of residents relocating from foreign countries between 2010 and 2011"
- #40 on the list of "Top 101 counties with the lowest percentage of residents relocating to foreign countries in 2011"
- #66 on the list of "Top 101 counties with the lowest Ozone (1-hour) air pollution readings in 2012 (ppm)"
- #67 on the list of "Top 101 counties with the highest percentage of residents that drank alcohol in the past 30 days"
- #74 on the list of "Top 101 counties with the highest surface withdrawal of fresh water for public supply (pop. 50,000+)"

|
|
Total of 427 patent applications in 2008-2024.