Salem, OR (Oregon) Houses and Residents
Estimated median house or condo value in 2022: $398,300 (it was $126,300 in 2000 )
Salem:
$398,300Oregon:
$475,600
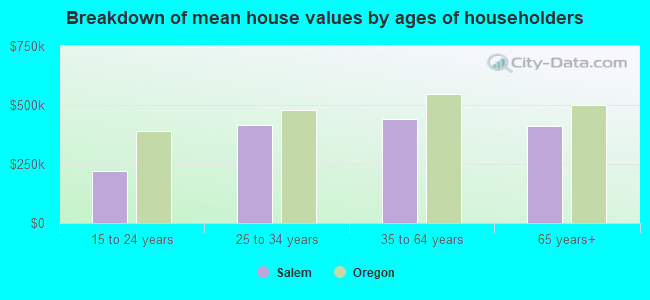
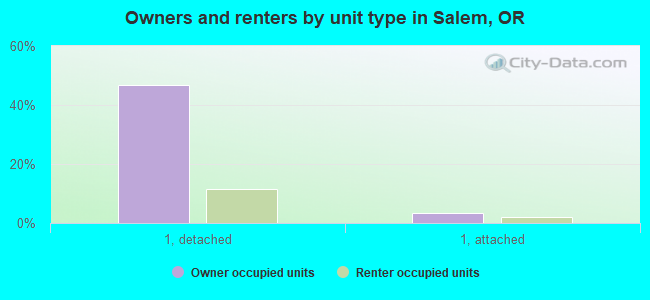
Lower value quartile - upper value quartile: $313,400 - $511,200Mean price in 2022: Detached houses: $430,055 Here:
$430,055State:
$562,872
Townhouses or other attached units: $202,040 Here:
$202,040State:
$463,029
In 2-unit structures: $387,474 Here:
$387,474State:
$505,105
In 3-to-4-unit structures: $594,823 Here:
$594,823State:
$419,673
In 5-or-more-unit structures: $323,491 Here:
$323,491State:
$420,389
Mobile homes: $120,942 Here:
$120,942State:
$214,044
Occupied boats, RVs, vans, etc.: $51,170 Here:
$51,170State:
$122,960
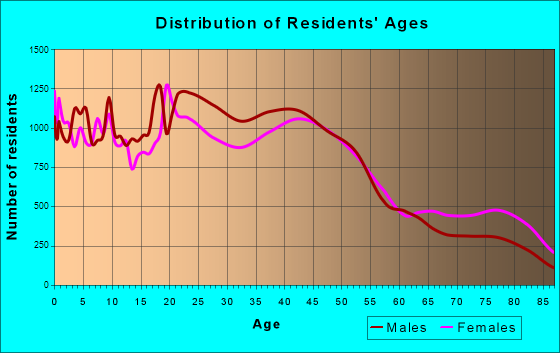
Total population: 161,637 (Urban population: 136,682, Rural population: 12 (all nonfarm) )
Houses: 70,335 (68,667 occupied: 37,666 owner occupied, 31,001 renter occupied )
% of renters here:
45%State:
37%
Housing density: 1,538 houses/condos per square mile
Median price asked for vacant for-sale houses and condos in 2022: $330,318.
Median contract rent in 2022: $1,150 (lower quartile is $916, upper quartile is $1,417)
Median rent asked for vacant for-rent units in 2022: $1,201
Median gross rent in Salem, OR in 2022: $1,304
Housing units in Salem with a mortgage: 25,634 (1,956 second mortgage, 88 home equity loan, 1,782 both second mortgage and home equity loan )Houses without a mortgage: 223
Median household income for houses/condos with a mortgage: $108,838
Median household income for apartments without a mortgage: $66,136
Median monthly housing costs: $1,379
Data:
Median house or condo value ($)
Median house or condo value ($ change since 2000)
Median house or condo value ($) - White
Median house or condo value ($) - Black or African American
Median house or condo value ($) - Asian
Median house or condo value ($) - Hispanic or Latino
Median house or condo value ($) - American Indian and Alaska Native
Median house or condo value ($) - Multirace
Median house or condo value ($) - Other Race
Median price asked for mobile homes ($)
Household density (households per square mile)
Mean house or condo value by units in structure - 1, detached ($)
Mean house or condo value by units in structure - 1, attached ($)
Mean house or condo value by units in structure - 2 ($)
Mean house or condo value by units in structure by units in structure - 3 or 4 ($)
Mean house or condo value by units in structure - 5 or more ($)
Mean house or condo value by units in structure - Boat, RV, van, etc. ($)
Mean house or condo value by units in structure - Mobile home ($)
Median contract rent ($)
Median contract rent - Lower quartile ($)
Median contract rent - Upper quartile ($)
Median gross rent ($)
Urban houses (%)
Rural houses (%)
Houses occupied (%)
Houses occupied (% change since 2000)
Houses owner occupied (%)
Houses owner occupied (% change since 2000)
Houses renter occupied (%)
Houses renter occupied (% change since 2000)
Vacant housing units - For rent (%)
Vacant housing units - For rent (% change since 2000)
Vacant housing units - For sale only (%)
Vacant housing units - For sale only (% change since 2000)
Vacant housing units - Rented or sold, not occupied (%)
Vacant housing units - Rented or sold, not occupied (% change since 2000)
Vacant housing units - For seasonal, recreational, or occasional use (%)
Vacant housing units - For seasonal, recreational, or occasional use (% change since 2000)
Vacant housing units - For migrant workers (%)
Vacant housing units - For migrant workers (% change since 2000)
Vacant housing units - Other vacant (%)
Vacant housing units - Other vacant (% change since 2000)
Median monthly housing costs ($)
Median household income for houses/condos with a mortgage ($)
Median household income for houses/condos without a mortgage ($)
Median household income ($)
Median household income ($) - White
Median household income ($) - Black or African American
Median household income ($) - Asian
Median household income ($) - Hispanic or Latino
Median household income ($) - American Indian and Alaska Native
Median household income ($) - Multirace
Median household income ($) - Other Race
Mortgage status - with mortgage (%)
Mortgage status - with second mortgage (%)
Mortgage status - with home equity loan (%)
Mortgage status - with both second mortgage and home equity loan (%)
Mortgage status - without a mortgage (%)
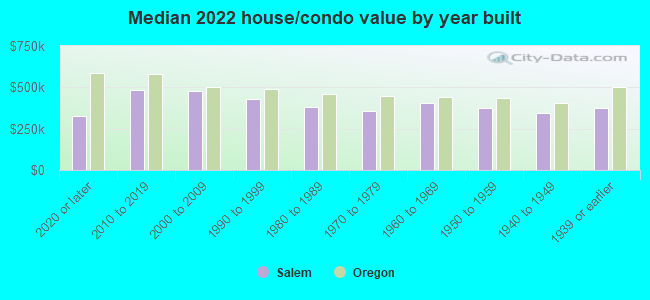
Median year house/condo built
Median year apartment built
Household type by relationship - Male householder living alone (%)
Household type by relationship - Male householder not living alone (%)
Household type by relationship - Female householder living alone (%)
Household type by relationship - Female householder not living alone (%)
Household type by relationship - Opposite-Sex spouse (%)
Household type by relationship - Same-Sex spouse (%)
Household type by relationship - Opposite-Sex unmarried partner (%)
Household type by relationship - Same-Sex unmarried partner (%)
Household type by relationship - In group quarters (%)
Size of family households - 2-person household (%)
Size of family households - 3-person household (%)
Size of family households - 4-person household (%)
Size of family households - 5-person household (%)
Size of family households - 6-person household (%)
Size of family households - 7-or-more-person household (%)
Size of nonfamily households - 1-person household (%)
Size of nonfamily households - 2-person household (%)
Size of nonfamily households - 3-person household (%)
Size of nonfamily households - 4-person household (%)
Size of nonfamily households - 5-person household (%)
Size of nonfamily households - 6-person household (%)
Size of nonfamily households - 7-or-moreperson household (%)
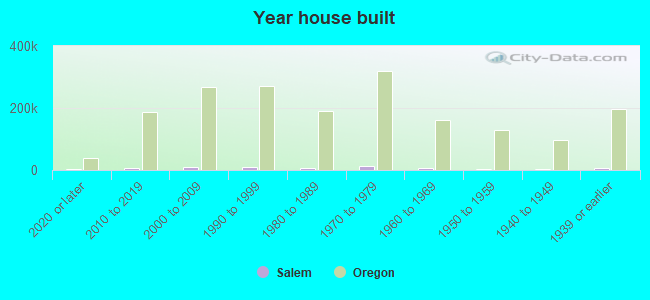
Year house built - Built 2010 or later (%)
Year house built - Built 2000 to 2009 (%)
Year house built - Built 1990 to 1999 (%)
Year house built - Built 1980 to 1989 (%)
Year house built - Built 1970 to 1979 (%)
Year house built - Built 1960 to 1969 (%)
Year house built - Built 1950 to 1959 (%)
Year house built - Built 1940 to 1949 (%)
Year house built - Built 1939 or earlier (%)
Median number of rooms in houses and condos
Median number of rooms in apartments
Median number of bedrooms in owner occupied houses
Mean number of bedrooms in owner occupied houses
Median number of bedrooms in renter occupied houses
Mean number of bedrooms in renter occupied houses
Median number of vehichles in owner occupied houses
Mean number of vehichles in owner occupied houses
Median number of vehichles in renter occupied houses
Mean number of vehichles in renter occupied houses
Rooms in owner-occupied houses - 1 room (%)
Rooms in owner-occupied houses - 2 rooms (%)
Rooms in owner-occupied houses - 3 rooms (%)
Rooms in owner-occupied houses - 4 rooms (%)
Rooms in owner-occupied houses - 5 rooms (%)
Rooms in owner-occupied houses - 6 rooms (%)
Rooms in owner-occupied houses - 7 rooms (%)
Rooms in owner-occupied houses - 8 rooms (%)
Rooms in owner-occupied houses - 9+ rooms (%)
Rooms in renter-occupied houses - 1 room (%)
Rooms in renter-occupied houses - 2 rooms (%)
Rooms in renter-occupied houses - 3 rooms (%)
Rooms in renter-occupied houses - 4 rooms (%)
Rooms in renter-occupied houses - 5 rooms (%)
Rooms in renter-occupied houses - 6 rooms (%)
Rooms in renter-occupied houses - 7 rooms (%)
Rooms in renter-occupied houses - 8 rooms (%)
Rooms in renter-occupied houses - 9+ rooms (%)
Bedrooms in owner-occupied houses - no bedrooms (%)
Bedrooms in owner-occupied houses - 1 bedroom (%)
Bedrooms in owner-occupied houses - 2 bedrooms (%)
Bedrooms in owner-occupied houses - 3 bedrooms (%)
Bedrooms in owner-occupied houses - 4 bedrooms (%)
Bedrooms in owner-occupied houses - 5+ bedrooms (%)
Bedrooms in renter-occupied houses - no bedrooms (%)
Bedrooms in renter-occupied houses - 1 bedroom (%)
Bedrooms in renter-occupied houses - 2 bedrooms (%)
Bedrooms in renter-occupied houses - 3 bedrooms (%)
Bedrooms in renter-occupied houses - 4 bedrooms (%)
Bedrooms in renter-occupied houses - 5+ bedrooms (%)
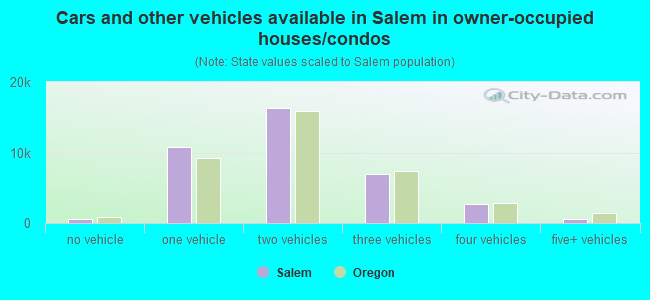
Vehicles available in owner-occupied houses - no vehicle available (%)
Vehicles available in owner-occupied houses - 1 vehicle available(%)
Vehicles available in owner-occupied houses - 2 Vehicles available (%)
Vehicles available in owner-occupied houses - 3 Vehicles available (%)
Vehicles available in owner-occupied houses - 4 Vehicles available (%)
Vehicles available in owner-occupied houses - 5+ Vehicles available (%)
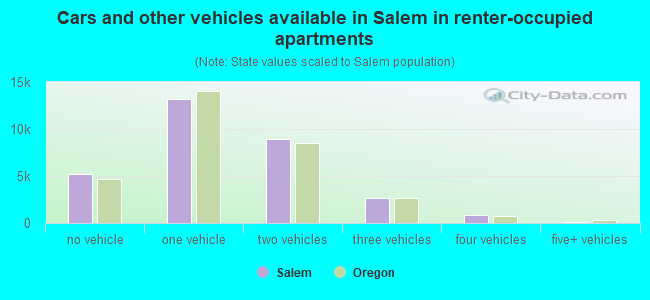
Vehicles available in renter-occupied houses - no vehicle available (%)
Vehicles available in renter-occupied houses - 1 vehicle available (%)
Vehicles available in renter-occupied houses - 2 Vehicles available (%)
Vehicles available in renter-occupied houses - 3 Vehicles available (%)
Vehicles available in renter-occupied houses - 4 Vehicles available (%)
Vehicles available in renter-occupied houses - 5+ Vehicles available (%)
Housing units in structures - 1, detached (%)
Housing units in structures - 1, attached (%)
Housing units in structures - 2 (%)
Housing units in structures - 3 or 4 (%)
Housing units in structures - 5 to 9 (%)
Housing units in structures - 10 to 19 (%)
Housing units in structures - 20 to 49 (%)
Housing units in structures - 50 or more (%)
Housing units in structures - Mobile home (%)
Housing units in structures - Boat, RV, van, etc. (%)
Housing units in structures - Owners - 1, detached (%)
Housing units in structures - Owners - 1, attached (%)
Housing units in structures - Owners - 2 (%)
Housing units in structures - Owners - 3 or 4 (%)
Housing units in structures - Owners - 5 to 9 (%)
Housing units in structures - Owners - 10 to 19 (%)
Housing units in structures - Owners - 20 to 49 (%)
Housing units in structures - Owners - 50 or more (%)
Housing units in structures - Owners - Mobile home (%)
Housing units in structures - Owners - Boat, RV, van, etc. (%)
Housing units in structures - Renters - 1, detached (%)
Housing units in structures - Renters - 1, attached (%)
Housing units in structures - Renters - 2 (%)
Housing units in structures - Renters - 3 or 4 (%)
Housing units in structures - Renters - 5 to 9 (%)
Housing units in structures - Renters - 10 to 19 (%)
Housing units in structures - Renters - 20 to 49 (%)
Housing units in structures - Renters - 50 or more (%)
Housing units in structures - Renters - Mobile home (%)
Housing units in structures - Renters - Boat, RV, van, etc. (%)
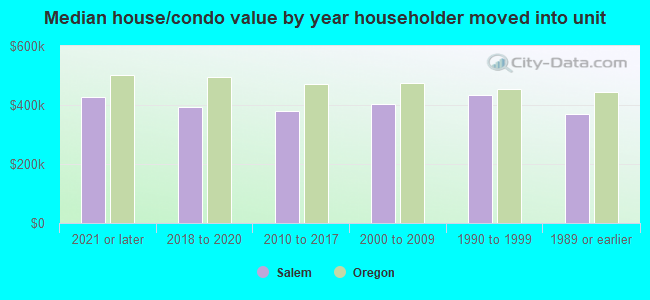
House/condo owner moved in on average (years ago)
Renter moved in on average (years ago)
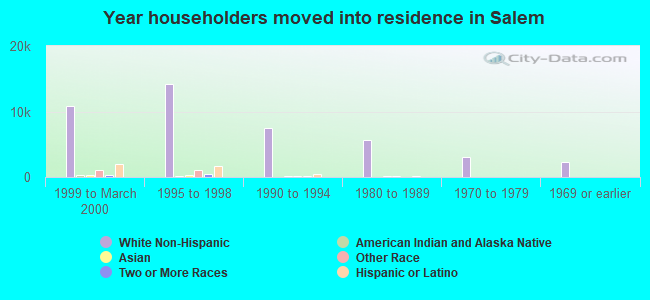
Year householder moved into unit - Moved in 1999 to March 2000 (%)
Year householder moved into unit - Moved in 1999 to March 2000 (%) - White
Year householder moved into unit - Moved in 1999 to March 2000 (%) - Black or African American
Year householder moved into unit - Moved in 1999 to March 2000 (%) - Asian
Year householder moved into unit - Moved in 1999 to March 2000 (%) - Hispanic or Latino
Year householder moved into unit - Moved in 1999 to March 2000 (%) - American Indian and Alaska Native
Year householder moved into unit - Moved in 1999 to March 2000 (%) - Multirace
Year householder moved into unit - Moved in 1999 to March 2000 (%) - Other Race
Year householder moved into unit - Moved in 1995 to 1998 (%)
Year householder moved into unit - Moved in 1995 to 1998 (%) - White
Year householder moved into unit - Moved in 1995 to 1998 (%) - Black or African American
Year householder moved into unit - Moved in 1995 to 1998 (%) - Asian
Year householder moved into unit - Moved in 1995 to 1998 (%) - Hispanic or Latino
Year householder moved into unit - Moved in 1995 to 1998 (%) - American Indian and Alaska Native
Year householder moved into unit - Moved in 1995 to 1998 (%) - Multirace
Year householder moved into unit - Moved in 1995 to 1998 (%) - Other Race
Year householder moved into unit - Moved in 1990 to 1994 (%)
Year householder moved into unit - Moved in 1990 to 1994 (%) - White
Year householder moved into unit - Moved in 1990 to 1994 (%) - Black or African American
Year householder moved into unit - Moved in 1990 to 1994 (%) - Asian
Year householder moved into unit - Moved in 1990 to 1994 (%) - Hispanic or Latino
Year householder moved into unit - Moved in 1990 to 1994 (%) - American Indian and Alaska Native
Year householder moved into unit - Moved in 1990 to 1994 (%) - Multirace
Year householder moved into unit - Moved in 1990 to 1994 (%) - Other Race
Year householder moved into unit - Moved in 1980 to 1989 (%)
Year householder moved into unit - Moved in 1980 to 1989 (%) - White
Year householder moved into unit - Moved in 1980 to 1989 (%) - Black or African American
Year householder moved into unit - Moved in 1980 to 1989 (%) - Asian
Year householder moved into unit - Moved in 1980 to 1989 (%) - Hispanic or Latino
Year householder moved into unit - Moved in 1980 to 1989 (%) - American Indian and Alaska Native
Year householder moved into unit - Moved in 1980 to 1989 (%) - Multirace
Year householder moved into unit - Moved in 1980 to 1989 (%) - Other Race
Year householder moved into unit - Moved in 1970 to 1979 (%)
Year householder moved into unit - Moved in 1970 to 1979 (%) - White
Year householder moved into unit - Moved in 1970 to 1979 (%) - Black or African American
Year householder moved into unit - Moved in 1970 to 1979 (%) - Asian
Year householder moved into unit - Moved in 1970 to 1979 (%) - Hispanic or Latino
Year householder moved into unit - Moved in 1970 to 1979 (%) - American Indian and Alaska Native
Year householder moved into unit - Moved in 1970 to 1979 (%) - Multirace
Year householder moved into unit - Moved in 1970 to 1979 (%) - Other Race
Year householder moved into unit - Moved in 1969 or earlier (%)
Year householder moved into unit - Moved in 1969 or earlier (%) - White
Year householder moved into unit - Moved in 1969 or earlier (%) - Black or African American
Year householder moved into unit - Moved in 1969 or earlier (%) - Asian
Year householder moved into unit - Moved in 1969 or earlier (%) - Hispanic or Latino
Year householder moved into unit - Moved in 1969 or earlier (%) - American Indian and Alaska Native
Year householder moved into unit - Moved in 1969 or earlier (%) - Multirace
Year householder moved into unit - Moved in 1969 or earlier (%) - Other Race
Housing units lacking complete plumbing facilities (%)
Housing units lacking complete kitchen facilities (%)
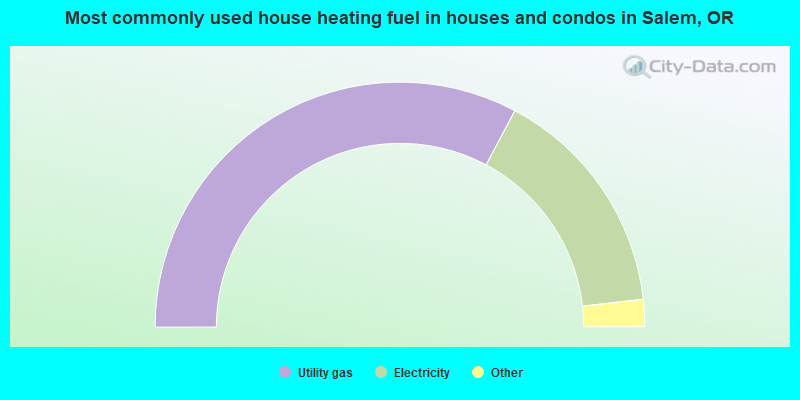
House heating fuel used in houses and condos - Utility gas (%)
House heating fuel used in houses and condos - Bottled, tank, or LP gas (%)
House heating fuel used in houses and condos - Electricity (%)
House heating fuel used in houses and condos - Fuel oil, kerosene, etc. (%)
House heating fuel used in houses and condos - Coal or coke (%)
House heating fuel used in houses and condos - Wood (%)
House heating fuel used in houses and condos - Solar energy (%)
House heating fuel used in houses and condos - Other fuel (%)
House heating fuel used in houses and condos - No fuel used (%)
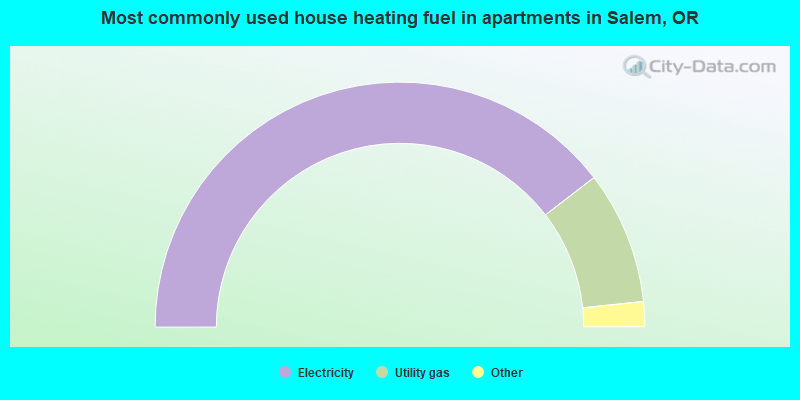
House heating fuel used in apartments - Utility gas (%)
House heating fuel used in apartments - Bottled, tank, or LP gas (%)
House heating fuel used in apartments - Electricity (%)
House heating fuel used in apartments - Fuel oil, kerosene, etc. (%)
House heating fuel used in apartments - Coal or coke (%)
House heating fuel used in apartments - Wood (%)
House heating fuel used in apartments - Solar energy (%)
House heating fuel used in apartments - Other fuel (%)
House heating fuel used in apartments - No fuel used (%)
Latest news about housing in Salem, OR collected exclusively by city-data.com from local newspapers, TV, and radio stations
Median year house/condo built: 1982Median year apartment built: 1982Household type by relationship:
Households: 177,490
Male householders: 31,070 (8,588 living alone ), Female householders: 37,597 (12,094 living alone )27,566 spouses (27,117 opposite-sex spouses ), 6,060 unmarried partners , (5,642 opposite-sex unmarried partners ), 46,426 children (43,515 natural , 1,339 adopted , 1,572 stepchildren ), 2,480 grandchildren , 2,602 brothers or sisters , 3,732 parents , 0 foster children , 2,273 other relatives , 9,502 non-relatives In group quarters: 8,182
Size of family households: 18,542 2-persons , 7,766 3-persons , 7,919 4-persons , 3,658 5-persons , 1,937 6-persons , 1,212 7-or-more-persons .
Size of nonfamily households: 20,682 1-person , 5,758 2-persons , 650 3-persons , 56 4-persons , 68 5-persons , 284 6-persons , 135 7-or-more-persons .
21,534 married couples with children. single-parent households (3,063 men , 9,812 women ).
77.6% of residents of Salem speak English at home. of residents speak Spanish at home (50% speak English very well , 24% speak English well , 14% speak English not well , 13% don't speak English at all ).of residents speak other Indo-European language at home (66% speak English very well , 8% speak English well , 19% speak English not well , 7% don't speak English at all ).of residents speak Asian or Pacific Island language at home (54% speak English very well , 29% speak English well , 13% speak English not well , 4% don't speak English at all ).of residents speak other language at home (88% speak English very well , 10% speak English well , 1% speak English not well , 1% don't speak English at all ).
Foreign born population: 25,852 (14.6%)of them are naturalized citizens )
Median number of rooms in houses and condos:
Median number of rooms in apartments
Owner-occupied Renter-occupied
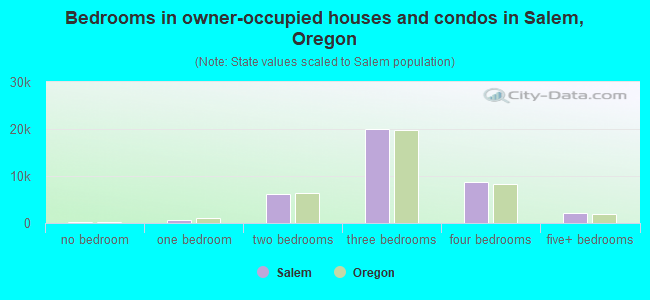
Bedrooms in owner-occupied houses and condos in Salem, Oregon
124 no bedroom 692 1 bedroom 6,084 2 bedrooms 20,053 3 bedrooms 8,631 4 bedrooms 2,082 5+ bedrooms
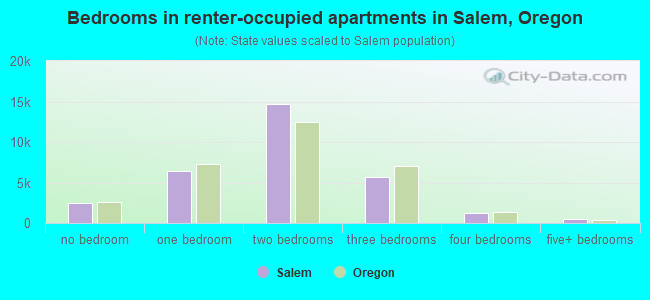
Bedrooms in renter-occupied apartments in Salem, Oregon
2,440 no bedroom 6,361 1 bedroom 14,675 2 bedrooms 5,727 3 bedrooms 1,281 4 bedrooms 517 5+ bedrooms
Owner-occupied Renter-occupied
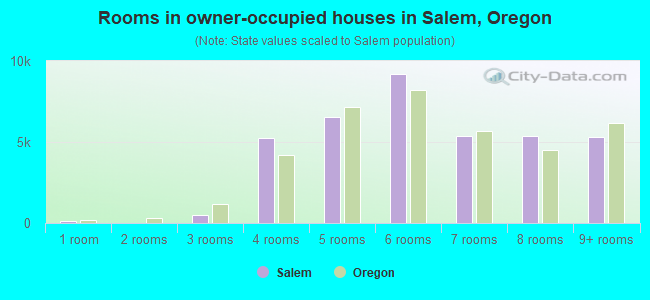
Rooms in owner-occupied houses in Salem, Oregon
124 1 room 0 2 rooms 463 3 rooms 5,236 4 rooms 6,567 5 rooms 9,203 6 rooms 5,347 7 rooms 5,396 8 rooms 5,330 9+ rooms
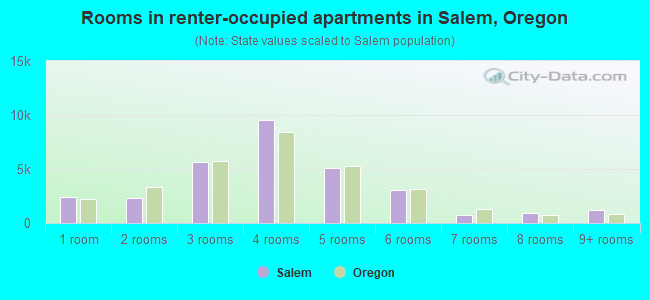
Rooms in renter-occupied apartments in Salem, Oregon
2,440 1 room 2,293 2 rooms 5,681 3 rooms 9,556 4 rooms 5,126 5 rooms 3,048 6 rooms 749 7 rooms 912 8 rooms 1,196 9+ rooms
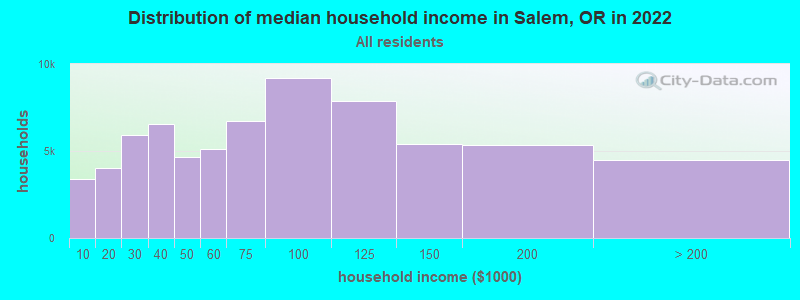
Salem, OR household income distribution 3,394 Less than $10,0004,028 $10,000 to $19,9995,928 $20,000 to $29,9996,523 $30,000 to $39,9994,649 $40,000 to $49,9995,123 $50,000 to $59,9996,746 $60,000 to $74,9999,174 $75,000 to $99,9997,900 $100,000 to $124,9995,377 $125,000 to $149,9995,322 $150,000 to $199,9994,503 $200,000 or more
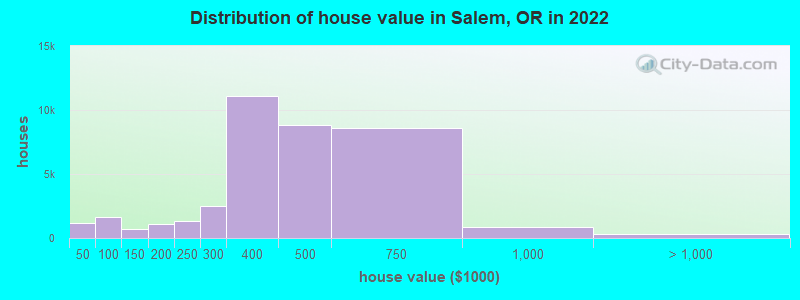
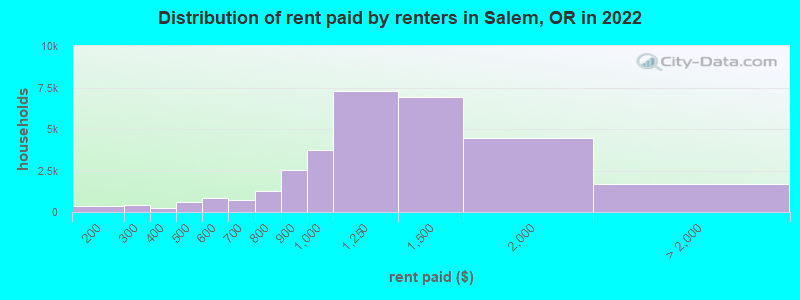
Home value of owner - occupied houses in 2022 in Salem, OR 164 Less than $10,00057 $15,000 to $19,999114 $20,000 to $24,99935 $25,000 to $29,999124 $30,000 to $34,999266 $35,000 to $39,999447 $40,000 to $49,999536 $60,000 to $69,999602 $70,000 to $79,99935 $90,000 to $99,999173 $100,000 to $124,999525 $125,000 to $149,999268 $150,000 to $174,999800 $175,000 to $199,9991,304 $200,000 to $249,9992,474 $250,000 to $299,99911,100 $300,000 to $399,9998,841 $400,000 to $499,9998,603 $500,000 to $749,999858 $750,000 to $999,999131 $1,000,000 to $1,499,999209 $2,000,000 or moreRent paid by renters in 2022 in Salem, OR 123 $100 to $149258 $150 to $199320 $200 to $24982 $250 to $299236 $350 to $399300 $400 to $449293 $450 to $499611 $500 to $549218 $550 to $599452 $600 to $649244 $650 to $699397 $700 to $749894 $750 to $7992,508 $800 to $8993,749 $900 to $9997,280 $1,000 to $1,2496,918 $1,250 to $1,4994,460 $1,500 to $1,999575 $2,000 to $2,49985 $2,500 to $2,999106 $3,500 or more892 No cash rent
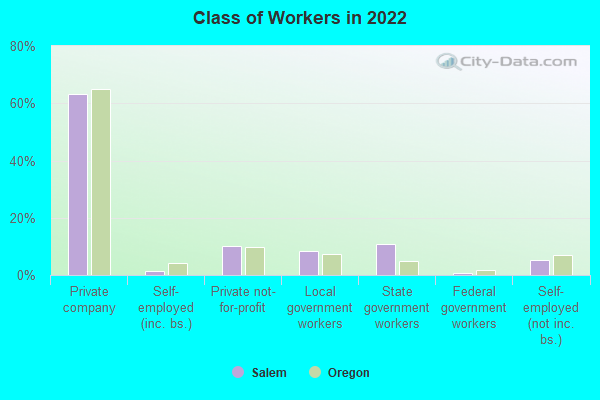
Percentage of workers working in this county: 72.8%Number of people working at home: 11,428 (13.8% of all workers )
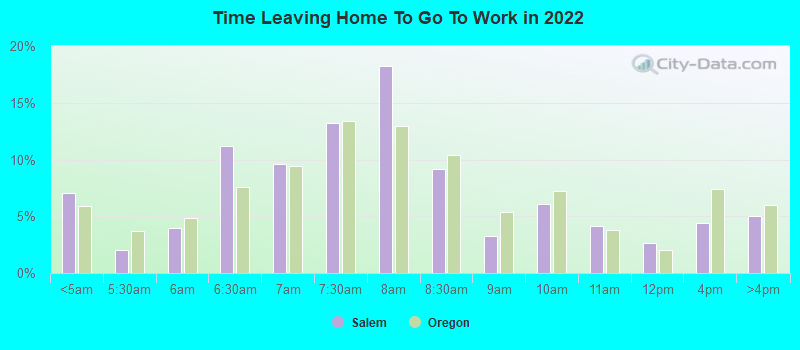
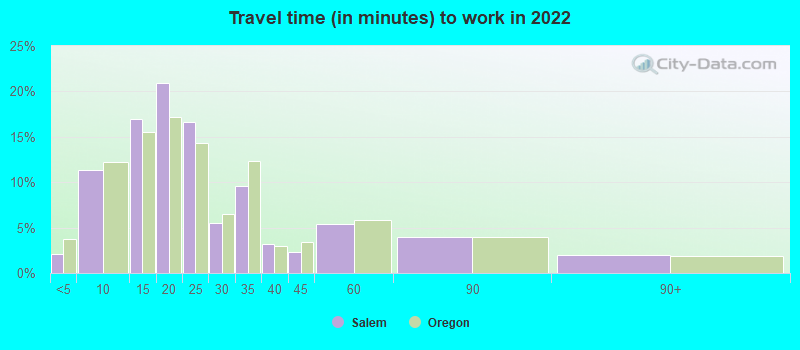
Travel time to work (commute)
Less than 5 minutes: 1,5535 to 9 minutes: 9,44210 to 14 minutes: 13,44515 to 19 minutes: 14,99120 to 24 minutes: 9,95325 to 29 minutes: 2,86830 to 34 minutes: 6,00735 to 39 minutes: 1,14240 to 44 minutes: 1,91845 to 59 minutes: 4,61960 to 89 minutes: 3,70290 or more minutes: 1,509
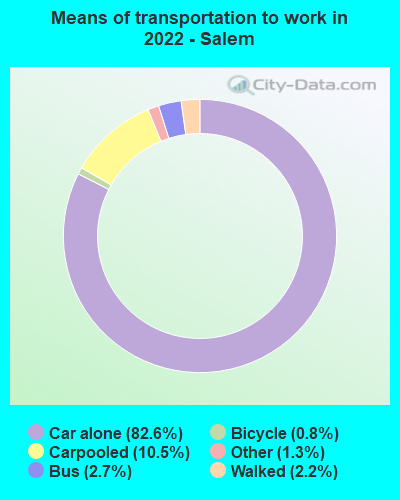
Means of transportation to work:
Drove a car alone: 73,152 (73.1%)Carpooled: 9,304 (9.3%)Bus : 2,388 (2.4%)Taxi: 1,160 (1.2%)Bicycle: 670 (0.7%)Walked: 1,910 (1.9%)Worked at home: 11,428 (11.4%)
Unemployment by race in 2022
Unemployment rate for White non-Hispanic residents 4.4% Males6.6% FemalesUnemployment rate for Black residents 13.7% Males13.3% FemalesUnemployment rate for American Indian and Alaska Native residents 4.5% Males11.1% FemalesUnemployment rate for Asian residents 2.4% Males0.6% FemalesUnemployment rate for other race residents 1.2% Males4.7% FemalesUnemployment rate for two or more race residents 7.8% Males5.2% FemalesUnemployment rate for Hispanic or Latino residents 4.1% Males6.0% Females
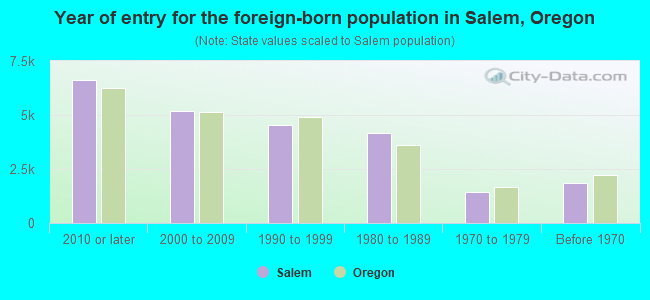
Year of entry for the foreign-born population in Salem, Oregon
6,629 2010 or later 5,203 2000 to 2009 4,515 1990 to 1999 4,174 1980 to 1989 1,441 1970 to 1979 1,854 Before 1970
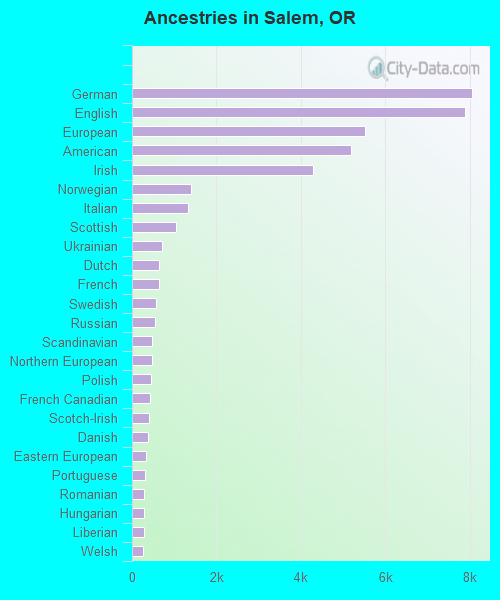
First ancestries reported:
German: 8,058 (9.3%)
English: 7,894 (9.1%)
European: 5,528 (6.4%)
American: 5,196 (6.0%)
Irish: 4,286 (4.9%)
Norwegian: 1,405 (1.6%)
Italian: 1,339 (1.5%)
Scottish: 1,032 (1.2%)
Ukrainian: 707 (0.8%)
Dutch: 645 (0.7%)
French: 644 (0.7%)
Swedish: 562 (0.6%)
Russian: 553 (0.6%)
Scandinavian: 471 (0.5%)
Northern European: 467 (0.5%)
Polish: 454 (0.5%)
French Canadian: 417 (0.5%)
Scotch-Irish: 401 (0.5%)
Danish: 391 (0.5%)
Eastern European: 336 (0.4%)
Portuguese: 303 (0.3%)
Romanian: 291 (0.3%)
Hungarian: 290 (0.3%)
Liberian: 289 (0.3%)
Welsh: 260 (0.3%)
Austrian: 216 (0.2%)
British: 195 (0.2%)
Czechoslovakian: 144 (0.2%)
Czech: 123 (0.1%)
African: 119 (0.1%)
Ethiopian: 97 (0.1%)
Palestinian: 87 (0.1%)
Greek: 86 (0.10%)
Swiss: 84 (0.10%)
Lithuanian: 74 (0.09%)
Finnish: 73 (0.08%)
Australian: 52 (0.06%)
Canadian: 50 (0.06%)
Afghan: 41 (0.05%)
Slavic: 39 (0.04%)
Iranian: 38 (0.04%)
Slovak: 37 (0.04%)
Jordanian: 36 (0.04%)
Ghanaian: 33 (0.04%)
Croatian: 31 (0.04%)
Jamaican: 31 (0.04%)
Estonian: 27 (0.03%)
Lebanese: 27 (0.03%)
Celtic: 26 (0.03%)
Nigerian: 25 (0.03%)
Israeli: 25 (0.03%)
Moroccan: 23 (0.03%)
Yugoslavian: 21 (0.02%)
Turkish: 21 (0.02%)
Pennsylvania German: 18 (0.02%)
Bulgarian: 17 (0.02%)
Ugandan: 17 (0.02%)
Egyptian: 13 (0.01%)
Latvian: 11 (0.01%)
South African: 8 (0.01%)
Assyrian: 7 (0.01%)
Basque: 5 (0.01%)
Icelander: 5 (0.01%)
Most common places of birth for foreign-born residents (%): Mexico Salem:
50.9% (10,569)Oregon:
33.9% (140,109)
Marshall Islands Salem:
6.0% (1,245)Oregon:
0.3% (1,080)
India Salem:
4.1% (844)Oregon:
4.7% (19,604)
Philippines Salem:
3.8% (794)Oregon:
3.5% (14,530)
China, excluding Hong Kong and Taiwan Salem:
3.6% (753)Oregon:
5.2% (21,429)
Guatemala Salem:
2.9% (599)Oregon:
1.7% (7,103)
Vietnam Salem:
2.5% (518)Oregon:
5.5% (22,563)
Ukraine Salem:
2.1% (426)Oregon:
2.1% (8,469)
Micronesia Salem:
1.9% (398)Oregon:
0.5% (1,921)
Honduras Salem:
1.8% (370)Oregon:
0.3% (1,378)
El Salvador Salem:
1.6% (340)Oregon:
1.0% (4,175)
Liberia Salem:
1.6% (332)Oregon:
0.1% (451)
Place of birth for U.S.-born residents:
This state: 79,621Other state: 69,569Northeast: 4,368Midwest: 11,930South: 9,277West: 43,994 84.2% of Salem residents lived in the same house 1 years ago.
Out of people who lived in different houses, 31.3% lived in this county.
Out of people who lived in different counties, 72.7% lived in Oregon.
Salem:
84.2%State average:
85.5%
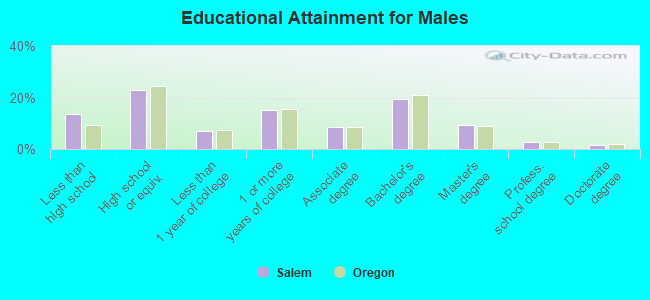
Education attainment for males 25 years and older:
No schooling: 1,941Nursery to 4th grade: 555th and 6th grade: 8757th and 8th grade: 9499th grade: 41510th grade: 1,16811th grade: 1,62712th grade, no diploma: 998High school graduate (or equivalency): 13,534Less than 1 year of college: 4,250Some college more than 1 year, no degree: 8,986Associate degree: 5,020Bachelor's degree: 11,442Master's degree: 5,531Professional school degree: 1,684Doctorate degree: 860
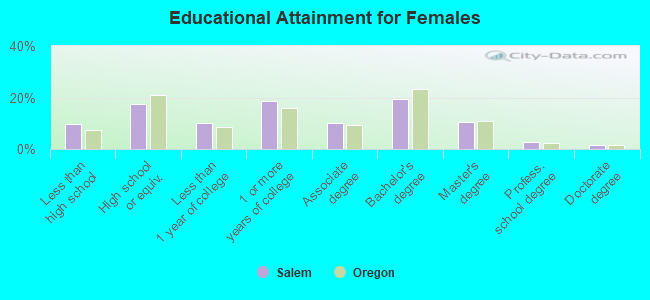
Education attainment for females 25 years and older:
No schooling: 1,694Nursery to 4th grade: 05th and 6th grade: 1,3867th and 8th grade: 5719th grade: 34110th grade: 39511th grade: 47812th grade, no diploma: 1,131High school graduate (or equivalency): 10,814Less than 1 year of college: 6,155Some college more than 1 year, no degree: 11,366Associate degree: 6,178Bachelor's degree: 12,009Master's degree: 6,357Professional school degree: 1,645Doctorate degree: 833
Housing units in structures:
One, detached: 41,446One, attached: 3,304Two: 1,3073 or 4: 3,4395 to 9: 6,64510 to 19: 5,03920 to 49: 2,87450 or more: 3,432Mobile homes: 2,849Median worth of mobile homes: $91,700
Housing units lacking complete plumbing facilities in 2022: 0.7%Housing units lacking complete kitchen facilities in 2022: 1.4%House/condo owner moved in on average 9 years ago
Renter moved in on average 3 years ago
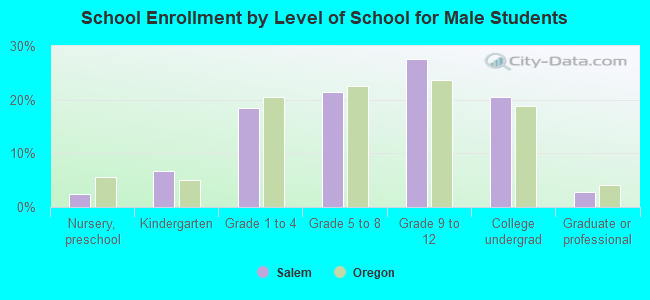
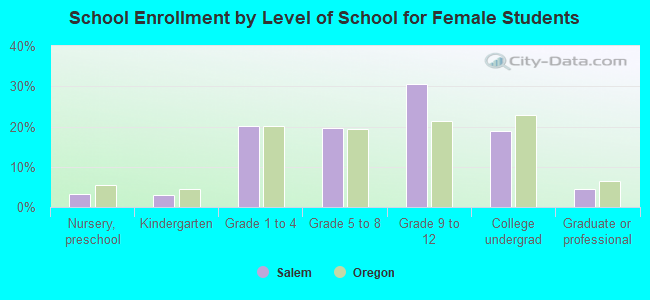
Private vs. public school enrollment:
Students in private schools in grades 1 to 8 (elementary and middle school): 954 Students in private schools in grades 9 to 12 (high school): 57 Students in private undergraduate colleges: 2,154