Tampa and Brandon, two distinct Floridian destinations, each offer unique living and visitor experiences. Tampa, a larger and more urban spot, provides vivacious nightlife, a robust job market, and diverse events and activities. On the other hand, Brandon boasts a more suburban and tranquil ambiance, lower cost of living, and high-ranked schools. Here, we'll delve into the specifics of each, detailing everything from crime and safety to culture and food.
Distance between
Tampa, FL and
Brandon, FL : 11.0 miles
Tampa's population is larger by 231%. Its population has grown by 83,603 people (27.6%) since 2000. The population of Brandon has grown by 39,099 people (50.2%) during that time.
When it comes to crime and safety, Tampa has a higher crime rate compared to the national average, and significantly higher than Brandon. Like any large, urban city, certain areas report higher crime rates than others. On the other hand, Brandon experiences a much lower crime rate, especially violent crime, making it a safer bet for families or individuals concerned about their safety.
Cost of Living
Brandon has a lower overall cost of living compared to Tampa. In Brandon, housing and utility costs are generally lower – a boon for anyone looking to save. Conversely, Tampa's costs can be higher due to its popularity, amenities, and job market, though certain areas offer reasonably-priced living options.
Income Tax
Florida stands as one of the seven U.S. states that does not levy an individual income tax. Thus, residents of both Tampa and Brandon are not subject to state income tax.
Property Tax
Tampa generally has higher property taxes due to elevated home values. Despite Brandon's lower property values, however, its property tax rate remains close to Tampa’s.
Sales Tax
Brandon and Tampa both are subject to the same sales tax rate as they are located in the same county. The combined sales tax rate for Hillsborough County, home to both cities, stands at 8.5%.
Income
Type
Tampa
Brandon
Estimated median household income
$63,404
$64,357
Estimated per capita income
$43,517
$35,007
Cost of living index (U.S. average is 100)
99.8
98.2
If you make $50,000 in Brandon, you will have to make $50,815 in Tampa to maintain the same standard of living.
Geographical Conditions
Geographically, Tampa lies along Florida’s Gulf Coast, which means coastal activities are abundant. Brandon, located inland, is characterized by suburban landscapes but is still within a drivable distance to the Gulf Coast.
Both cities offer extensive educational opportunities. Brandon, being a family-centered suburban area, often has better-ranked schools and educational programs. Tampa, though, exhibits a wider array of tertiary education platforms, including the University of South Florida and the Art Institute of Tampa.
Tampa’s economy is more diverse with sectors including finance, healthcare, technology, and tourism. Brandon, predominantly suburban, primarily promotes local businesses and retail. As a result, a majority of Brandon's residents often commute to Metro Tampa for professional opportunities.
Biggest Employers
Tampa's top employers span sectors like finance (Wellcare), retail (Publix Super Markets), healthcare (BayCare Health System), and education (University of South Florida). In Brandon, the largest employers can be found in the healthcare sector, (Brandon Regional Hospital), retail, (Westfield Brandon) and education (Hillsborough County School District).
Weather-wise, both Tampa and Brandon enjoy typical Florida weather – warm, sunny, and humid for the better part of the year. However, Tampa experiences stronger effects from tropical storms or hurricanes because of its coastal location, whereas Brandon, being further inland, is somewhat better protected.
Weather and climate
Type
Tampa
Brandon
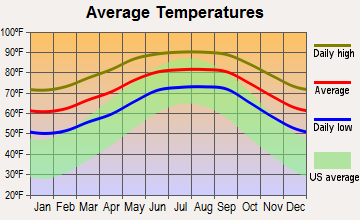
Temperature - Average
73.1°F
72.4°F
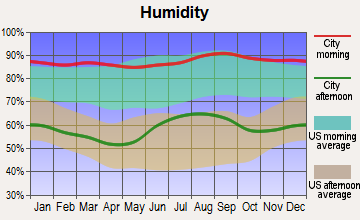
Humidity - Average morning or afternoon humidity
77.6%
77.6%
Humidity - Differences between morning and afternoon humidity
38%
38%
Humidity - Maximum monthly morning or afternoon humidity
89%
89%
Humidity - Minimum monthly morning or afternoon humidity
51%
51%
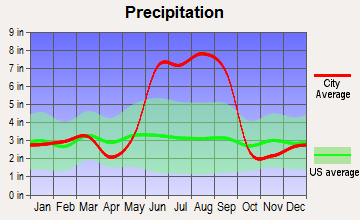
Precipitation - Yearly average
45.6 in
50.7 in
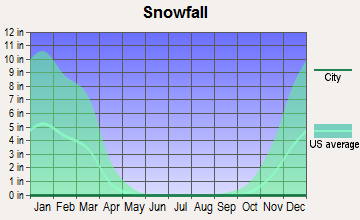
Snowfall - Yearly average
0 in
0 in
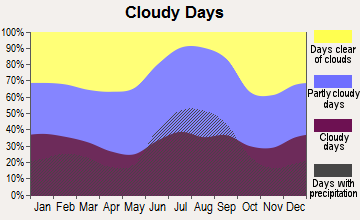
Clouds - Number of days clear of clouds
16.9%
16.9%
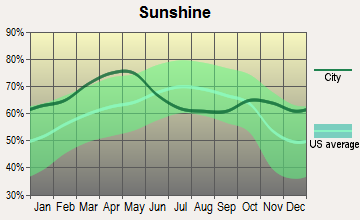
Sunshine amount - Average
74.8%
74.8%
Sunshine amount - Differences during a year
18%
18%
Sunshine amount - Maximum monthly
80%
80%
Sunshine amount - Minimum monthly
62%
62%
Wind speed - Average
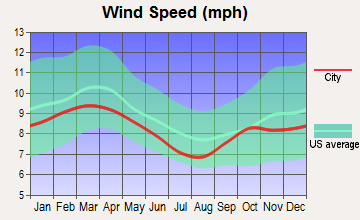
7.4 mph
7.4 mph
Average climate in Tampa, Florida
Average climate in Brandon, Florida
Air pollution
Type
AQI
CO
NO2
OZONE
PB
PM10
PM25
SO2
Year
Tampa
Brandon
Tampa
Brandon
Tampa
Brandon
Tampa
Brandon
Tampa
Brandon
Tampa
Brandon
Tampa
Brandon
Tampa
Brandon
2018
68
65
0.16
0.16
N/A
N/A
27.7
27.0
N/A
N/A
18.9
18.2
7.9
7.3
1.1
0.3
2017
79
70
0.17
0.17
N/A
N/A
28.4
27.3
N/A
N/A
20.5
19.4
8.8
9.0
0.6
0.4
2016
71
71
0.17
0.17
N/A
N/A
30.8
28.5
N/A
N/A
20.2
19.1
7.9
8.2
0.8
0.4
2015
74
74
0.15
0.15
N/A
N/A
28.7
27.0
N/A
N/A
19.0
18.1
10.0
9.6
2.2
1.0
2014
74
73
0.16
0.16
N/A
N/A
28.0
26.9
N/A
N/A
20.0
18.9
8.4
9.3
1.6
0.6
2013
68
67
0.16
0.16
N/A
N/A
27.7
27.8
N/A
N/A
20.3
19.1
9.3
9.1
1.4
1.1
2012
85
83
0.17
0.17
N/A
N/A
28.0
28.0
N/A
N/A
21.0
19.9
9.7
9.5
1.0
1.0
2011
83
84
0.18
0.18
N/A
N/A
29.2
29.2
N/A
N/A
20.8
19.2
10.1
9.9
1.2
1.1
2010
84
83
0.25
0.25
N/A
N/A
29.8
29.6
N/A
N/A
21.8
19.7
9.9
9.9
1.3
0.8
2009
77
77
0.27
0.27
N/A
N/A
27.4
28.2
N/A
N/A
21.2
19.7
10.1
9.5
1.5
0.7
2008
86
83
0.18
0.18
4.0
4.0
27.5
27.3
N/A
N/A
23.3
21.0
10.2
9.9
2.4
1.3
2007
102
100
0.31
0.20
5.4
5.4
28.8
28.6
N/A
N/A
26.0
23.7
12.0
11.5
3.3
1.4
2006
99
98
0.42
N/A
6.9
6.9
29.5
28.7
N/A
N/A
25.8
24.1
11.6
11.7
3.0
2.9
2005
99
99
0.45
N/A
6.7
6.7
27.9
27.9
N/A
N/A
25.0
23.0
13.2
12.3
3.0
2.9
2004
92
90
0.40
N/A
7.2
7.2
26.5
27.3
0.004
N/A
25.0
23.4
12.5
12.5
3.2
3.3
2003
94
89
0.42
N/A
N/A
N/A
23.8
23.3
0.004
0.004
23.9
22.5
11.7
11.7
4.4
4.3
2002
84
81
0.38
N/A
N/A
N/A
24.5
24.2
0.006
0.005
24.2
22.4
11.5
N/A
4.9
5.0
2001
100
104
0.44
N/A
N/A
N/A
26.2
25.5
0.012
0.018
24.9
23.9
12.1
N/A
4.7
4.8
2000
98
103
0.48
N/A
N/A
N/A
29.3
28.7
0.020
0.020
26.3
25.8
N/A
N/A
5.1
5.0
Natural disasters
Type
Tampa
Brandon
Tornado activity compared to U.S. average
152.6%
160%
Earthquake activity compared to U.S. average
11.1%
10.7%
Natural disasters compared to U.S. average
25%
25%
Transportation
Tampa’s public transportation network is extensive and includes buses, trolleys, and a streetcar system, facilitating city navigation. Brandon, largely car-dependent, offers limited public transit, making a personal vehicle a necessity for everyday commuting.
Transport
Type
Tampa
Brandon
Amtrak stations
1
0
Amtrak stations nearby
3
1
FAA registered aircraft
541
49
FAA registered aircraft manufacturers and dealers
78
1
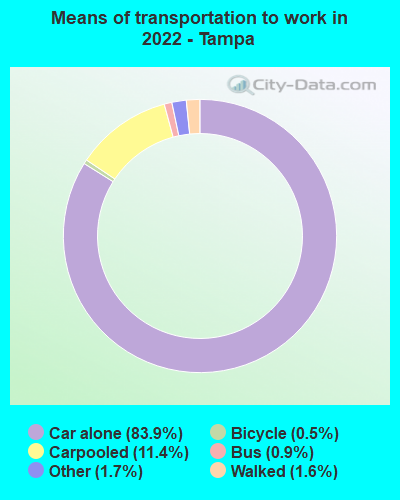
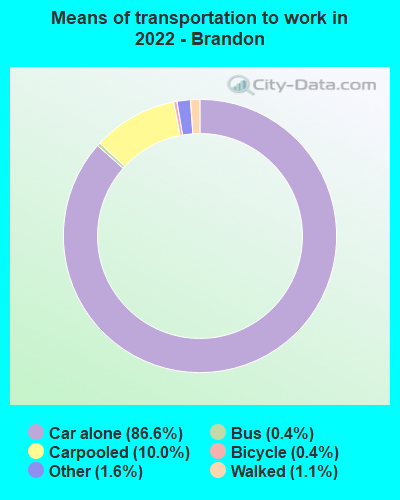
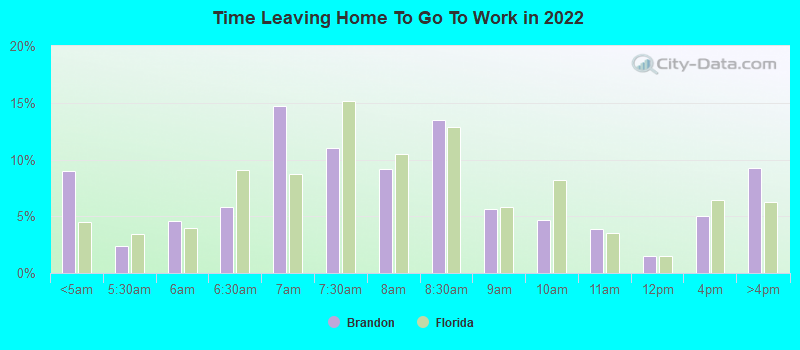
Means of transportation to work
Type
Tampa
Brandon
Bicycle
0.4%
0.5%
Bus
1.1%
0.5%
Carpooled
8.5%
9.7%
Car alone
87%
86.7%
Motorcycle
0.2%
0.1%
Railroad
0.2%
0%
Taxicab
0.1%
0%
Walked
1.3%
1.1%
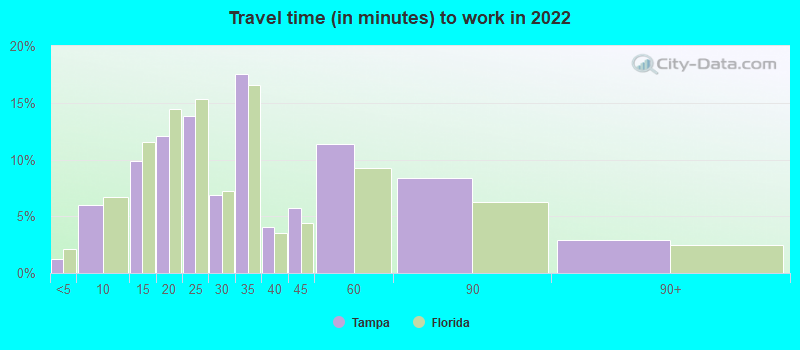
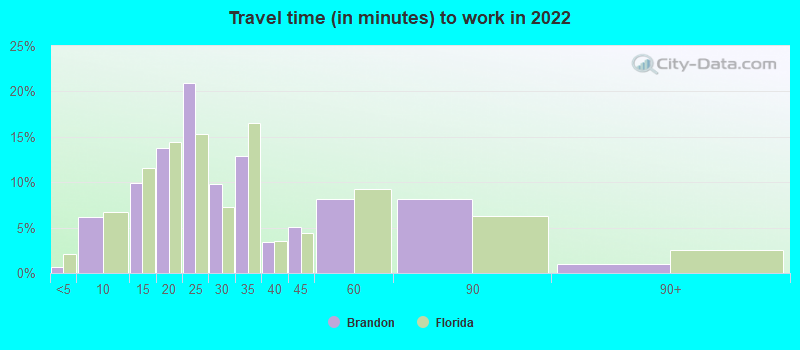
Average travel time to work
Type
Tampa
Brandon
Average
31.4 min
28.7 min
Other means
23.2 min
28.2 min
Public transportation
45.3 min
42.1 min
Private vehicle occupancy
Type
Tampa
Brandon
Average
1.1
1.1
Drove alone
90.8%
91.7%
In 2 person carpool
6.1%
6.7%
In 3 person carpool
1.7%
0.9%
In 4 person carpool
0.8%
0.2%
In 5-6 person carpool
0.4%
0.3%
How many people usually rode to work in the car, truck or van.
Real Estate
Real-estate costs tend to be less in Brandon, providing the possibility for more spacious living quarters. Tampa's housing prices typically extend higher, reflecting the city’s popularity and seascape attributes.
Neighborhoods
From quaint residential blocks to vibrant urban scenes, Tampa's neighborhoods offer a variety of living options. Brandon's neighborhoods often demonstrate a more uniform, family-friendly design and a peaceful ambiance.
Houses and residents
Type
Tampa
Brandon
Houses
172,886
50,086
Average household size (people)
2.4
2.5
Median year apartment built
1988
1999
Median year house/condo built
1977
1991
Length of stay in the house since moving in
12.5 years
11.8 years
Houses occupied
159,925 (92.5%)
46,925 (93.7%)
Houses occupied by owners
84,660 (52.9%)
24,495 (52.2%)
Houses occupied by renters
75,265 (47.1%)
22,430 (47.8%)
Median rent asked for vacant for-rent units
$1,369
$1,792
Median monthly housing costs
$1,326
$1,345
Median price asked for vacant for-sale houses and condos
$380,334
$274,013
Estimated median house or condo value
$336,200
$276,300
Median numbers of rooms
4.9
5.5
Median number of rooms in apartments
3.9
4.3
Median number of rooms in houses and condos
6
6.6
Median house price - detached houses
$477,728
$334,764
Median house price - in 3-to-4-unit structures
$249,678
$143,073
Median house price - in 5 or more unit structures
$443,026
$292,270
Median house price - mobile homes
$95,765
$90,010
Median house price - Townhouses or other attached units
$499,254
$213,203
Median house price - All housing units
$470,393
$319,275
Median house age
38
26
Renting percentage
48.3%
42.5%
Housing density (houses/condos per square mile)
1,542.7
1,744
House value disparities
34.7%
24.5%
Household income disparities
48.9%
42.2%
Median household income for houses/condes with a mortgage
$107,575
$103,609
Median household income for apartments without a mortgage
$66,260
$74,786
Housing units without a mortgage
1,024 (1.9%)
388 (2.2%)
Housing units with both a second mortgage and home equity loan
4,974 (9.2%)
1,522 (8.8%)
Housing units with a mortgage
53,063 (98.1%)
16,907 (97.8%)
Housing units with a home equity loan
110 (0.2%)
0 (0%)
Housing units with a second mortgage
5,716 (10.6%)
2,114 (12.2%)
House/condo owner moved in on average (years ago)
8
9
House/condo renter moved in on average (years ago)
1
1
Housing units lacking complete kitchen facilities
1.2%
0.4%
Housing units lacking complete plumbing facilities
0.9%
0.4%
Housing units in structures
Housing units in structures
Tampa
Brandon
One, detached
54.3%
51.2%
One, attached
7.1%
6.0%
Two
2.0%
2.3%
3 or 4
4.5%
5.6%
5 to 9
4.8%
10.2%
10 to 19
5.5%
13.2%
20 to 49
5.5%
5.5%
50 or more
15.1%
4.7%
Mobile homes
1.0%
1.3%
Median real estate property taxes paid for housing units
Self-employed workers in own not incorporated business
10,160
3,266
State government workers
6,101
1,724
Unpaid family workers
602
0
Industries and Occupations
Tampa tops in diverse industries including tourism, healthcare, finance, and technology. This indicates a more varied job market for a wide array of professions. Brandon's economically active folk often engage in retail, healthcare, and education.
Health diagnosing and treating practitioners and other technical occupations
8.7%
3.9%
Educational instruction, and library occupations
7.0%
7.8%
Food preparation and serving related occupations
6.3%
3.8%
Personal care and service occupations
3.6%
1.7%
Computer and mathematical occupations
3.4%
2.0%
Building and grounds cleaning and maintenance occupations
3.2%
5.2%
Legal occupations
3.0%
1.8%
Production occupations
2.9%
2.9%
Healthcare support occupations
2.7%
3.7%
Health technologists and technicians
2.4%
1.4%
Material moving occupations
2.4%
1.8%
Community and social service occupations
2.3%
3.8%
Arts, design, entertainment, sports, and media occupations
1.5%
2.0%
Transportation occupations
1.2%
0.6%
Life, physical, and social science occupations
1.0%
1.8%
Health Care
Tampa is a regional center for medical treatment and research, hosting facilities like Tampa General Hospital and Moffitt Cancer Center. Brandon, though not a healthcare destination, has quality hospitals like the Brandon Regional Hospital that meet daily health needs.
Brandon's infrastructure, being suburban, is designer-manicured and well-maintained, revealing an emphasis on residential living. Tampa, due to its larger size and diverse character, has an extensive infrastructure, from skyscrapers and waterfront developments to residential suburbs details a bustling city's essence.
Infrastructure
Type
Tampa
Brandon
Hospitals
19
4
TV stations
26
25
Bank branches located here
205
30
Bank institutions located here
45
17
Drinking water stations with no reported violations in the past
58
8
Drinking water stations with reported violations in the past
HMDA - Conventional home purchase loans - Applications denied
Year
Tampa
Brandon
1999
1,627
294
2000
1,292
41
2001
1,001
20
2002
968
19
2003
1,390
262
2004
2,093
408
2005
3,515
747
2006
4,460
754
2007
2,950
420
2008
1,075
198
2009
415
70
Culture and Food
Brandishing a wider array of restaurants, museums, and nightlife spots, Tampa delivers a more vibrant cultural and food scene. While Brandon proposes family-friendly dining and shopping centers, it is predominantly residential, harboring fewer cultural events and specialty dining venues.
Sports Teams
Tampa hosts several professional sports teams, including the NFL’s Tampa Bay Buccaneers, MLB’s Tampa Bay Rays, NHL's Tampa Bay Lightning. Similarly, you can get into competitive spirit at community sports events in Brandon though it doesn’t host any major pro leagues.


 Tampa, FL
 Brandon, FL