Bienville Parish, Louisiana (LA)
County owner-occupied free and clear houses and condos in 2010: 2,664
County owner-occupied houses and condos in 2000: 4,754
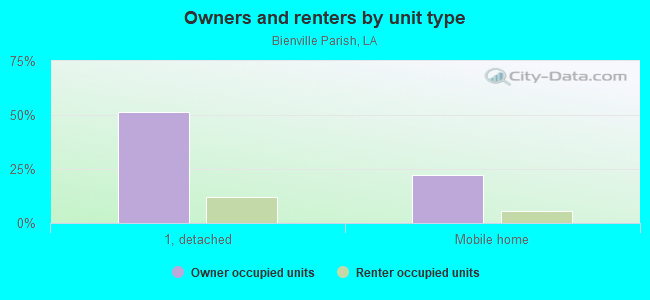
Renter-occupied apartments: 1,477 (it was 1,354 in 2000)
| % of renters here: | 22% |
| State: | 33% |
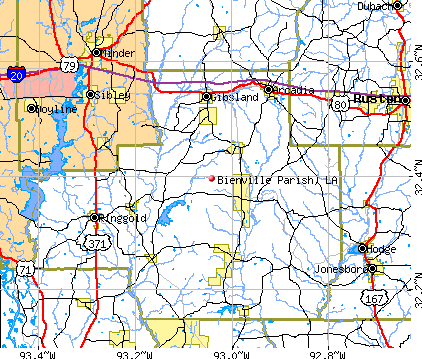
Land area: 811 sq. mi.
Water area: 11.1 sq. mi.
Population density: 16 people per square mile (low).
Industries providing employment: Educational, health and social services (19.9%), Manufacturing (14.7%), Retail trade (10.4%).
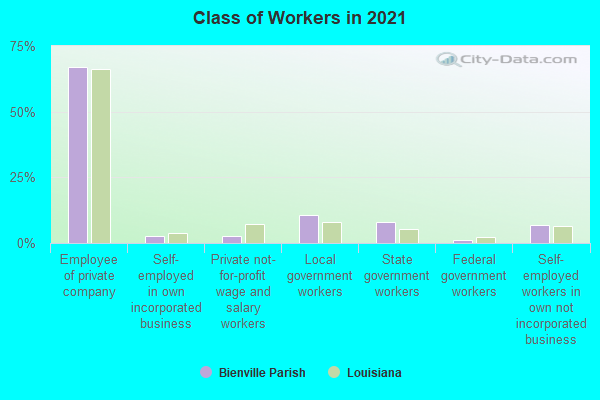
Type of workers:
- Private wage or salary: 71%
- Government: 22%
- Self-employed, not incorporated: 7%
- Unpaid family work: 0%
- OSM Map
- General Map
- Google Map
- MSN Map

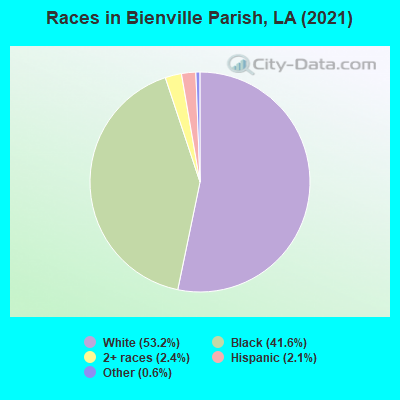
- 6,76153.1%White Non-Hispanic Alone
- 5,26241.3%Black Non-Hispanic Alone
- 3222.5%Two or more races
- 2922.3%Hispanic or Latino
- 620.5%Some other race alone
- 280.2%American Indian and Alaska Native alone
- 50.04%Asian alone
| Median resident age: | 42.8 years |
| Louisiana median age: | 38.2 years |
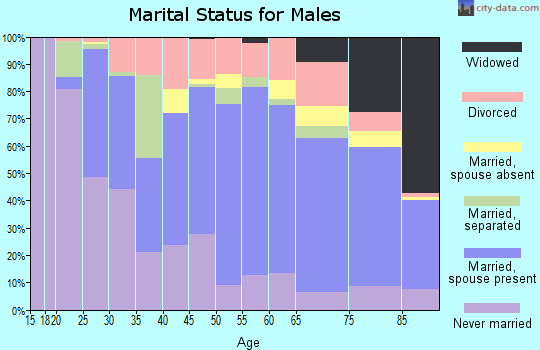
| Males: 6,117 | |
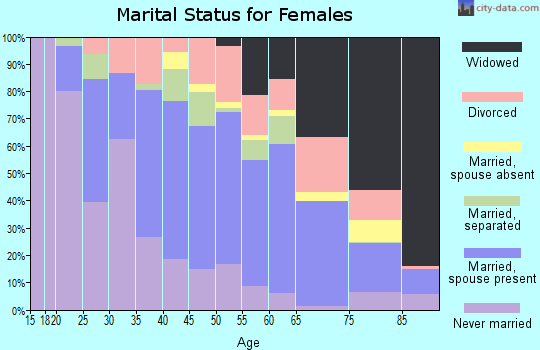
| Females: 6,700 |

 | Movin' home???? (1 reply) |
| Bienville Parish: | 2.0 people |
| Louisiana: | 3 people |
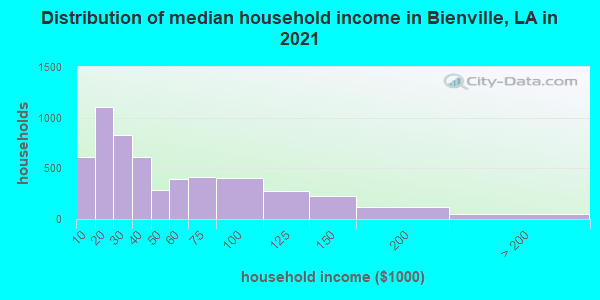
Estimated median household income in 2022: $32,825 ($23,662 in 1999)
| This county: | $32,825 |
| Louisiana: | $55,416 |
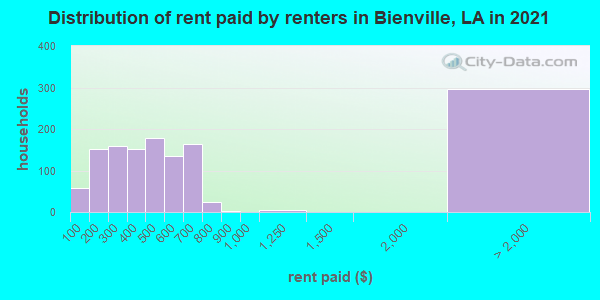
Median contract rent in 2022 for apartments: $344 (lower quartile is $157, upper quartile is $577)
| This county: | $344 |
| State: | $779 |
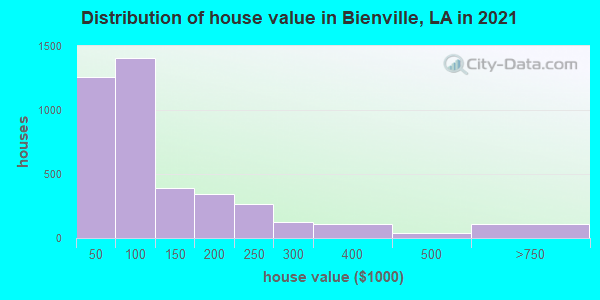
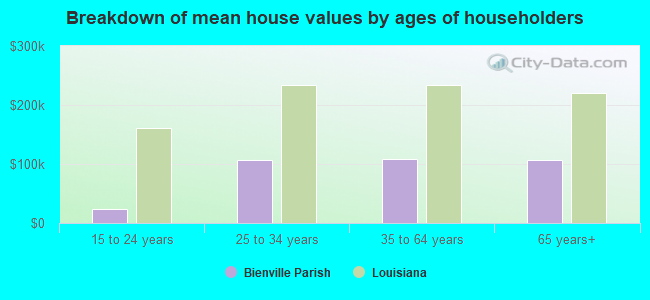
Estimated median house or condo value in 2022: $90,516 (it was $40,600 in 2000)
| Bienville: | $90,516 |
| Louisiana: | $209,200 |
Median monthly housing costs for homes and condos with a mortgage: $965
Median monthly housing costs for units without a mortgage: $308
Institutionalized population: 311
Crime in 2021 (reported by the sheriff's office or county police, not the county total):
- Murders: 1
- Rapes: 3
- Robberies: 2
- Assaults: 34
- Burglaries: 46
- Thefts: 102
- Auto thefts: 21
Crime in 2020 (reported by the sheriff's office or county police, not the county total):
- Murders: 1
- Rapes: 8
- Robberies: 0
- Assaults: 26
- Burglaries: 51
- Thefts: 67
- Auto thefts: 14
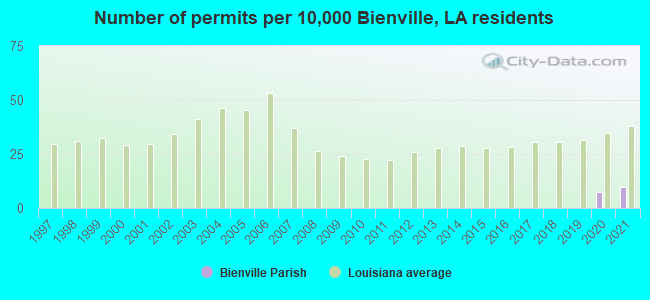
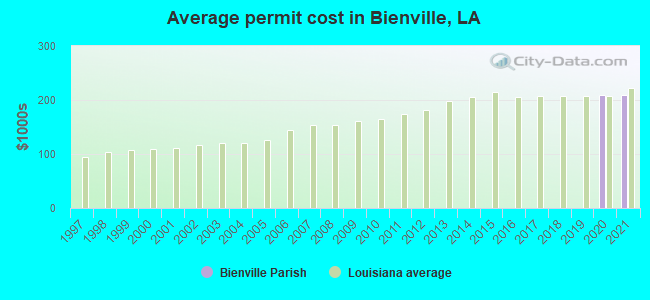
Single-family new house construction building permits:
- 2022: 16 buildings, average cost: $209,100
- 2021: 15 buildings, average cost: $209,100
- 2020: 12 buildings, average cost: $209,100
- 2019: 0 buildings
- 2018: 0 buildings
- 2017: 0 buildings
- 2016: 0 buildings
- 2015: 0 buildings
- 2014: 0 buildings
- 2013: 0 buildings
- 2012: 0 buildings
- 2011: 0 buildings
- 2010: 0 buildings
- 2009: 0 buildings
- 2008: 0 buildings
- 2007: 0 buildings
- 2006: 0 buildings
- 2005: 0 buildings
- 2004: 0 buildings
- 2003: 0 buildings
- 2002: 0 buildings
- 2001: 0 buildings
- 2000: 0 buildings
- 1999: 0 buildings
- 1998: 0 buildings
- 1997: 0 buildings
Median real estate property taxes paid for housing units with mortgages in 2022: $516 (0.5%)
Median real estate property taxes paid for housing units with no mortgage in 2022: $207 (0.3%)
| Bienville Parish: | 30.9% |
| Louisiana: | 18.6% |
Median age of residents in 2022: 42.8 years old
(Males: 42.3 years old, Females: 43.1 years old)
(Median age for: White residents: 46.0 years old, Black residents: 40.6 years old, Asian residents: 62.7 years old, Hispanic or Latino residents: 38.8 years old, Other race residents: 44.1 years old)
Fair market rent in 2006 for a 1-bedroom apartment in Bienville Parish is $392 a month.
Fair market rent for a 2-bedroom apartment is $464 a month.
Fair market rent for a 3-bedroom apartment is $554 a month.
Cities in this county include: Arcadia, Ringgold, Gibsland, Lucky, Saline, Bienville, Castor, Jamestown, Bryceland, Mount Lebanon.
Neighboring counties: Franklin Parish  , Jackson Parish , Issaquena County, Mississippi
  , Ouachita Parish , Peach County, Georgia , Upshur County, Texas
  .
.
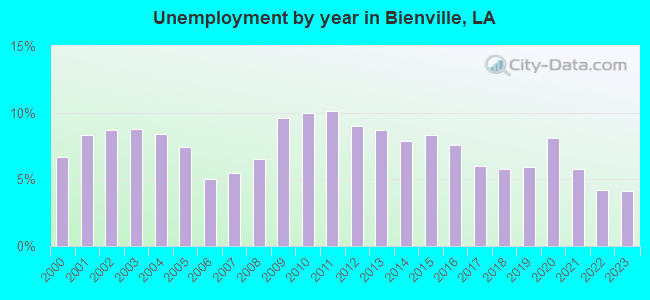
| Here: | 4.6% |
| Louisiana: | 3.8% |
Current college students: 514
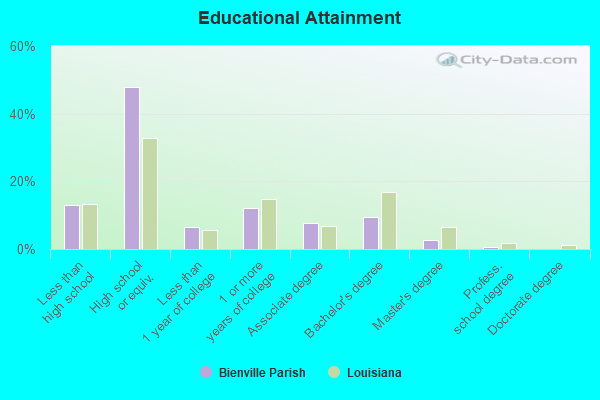
People 25 years of age or older with a high school degree or higher: 85.7%
People 25 years of age or older with a bachelor's degree or higher: 12.4%
Number of foreign born residents: 143 (18.6% naturalized citizens)
| Bienville Parish: | 1.1% |
| Whole state: | 4.2% |
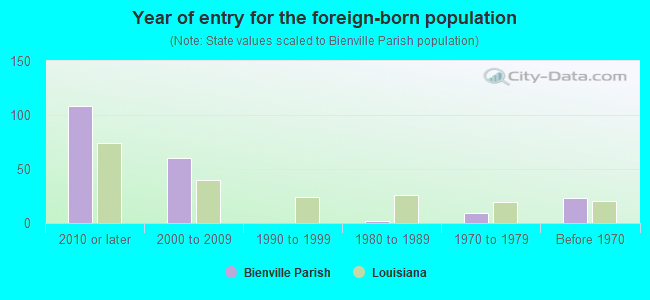
- Year of entry for the foreign-born population
- 732010 or later
- 502000 to 2009
- 21990 to 1999
- 21980 to 1989
- 91970 to 1979
- 23Before 1970
Mean travel time to work (commute): minutes
Percentage of county residents living and working in this county: 94.1%
Housing units in structures:
- One, detached: 4,255
- One, attached: 27
- Two: 187
- 3 or 4: 216
- 5 to 9: 79
- 10 to 19: 54
- 20 to 49: 24
- 50 or more: 4
- Mobile homes: 2,153
- Boats, RVs, vans, etc.: 28
Housing units in Bienville Parish with a mortgage: 1,274 (41 second mortgage, 0 home equity loan, 3 both second mortgage and home equity loan)
Houses without a mortgage: 0
| Here: | 100.0% with mortgage |
| State: | 98.3% with mortgage |
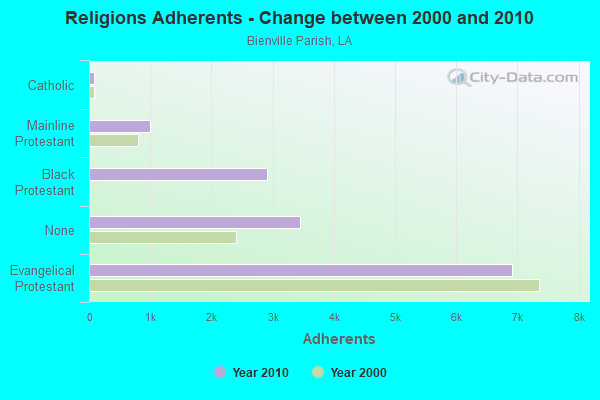
Religion statistics for Bienville Parish
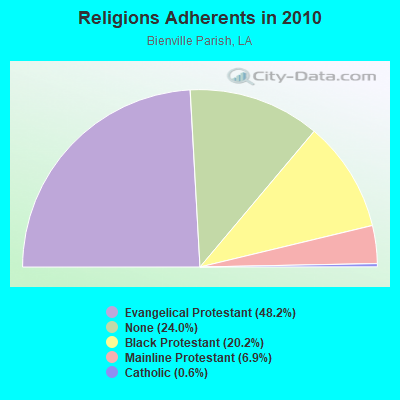
| Religion | Adherents | Congregations |
|---|---|---|
| Evangelical Protestant | 6,913 | 42 |
| Black Protestant | 2,904 | 10 |
| Mainline Protestant | 997 | 9 |
| Catholic | 86 | 1 |
| Other | 2 | 1 |
| None | 3,451 | - |
Source: Clifford Grammich, Kirk Hadaway, Richard Houseal, Dale E.Jones, Alexei Krindatch, Richie Stanley and Richard H.Taylor. 2012. 2010 U.S.Religion Census: Religious Congregations & Membership Study. Association of Statisticians of American Religious Bodies. Jones, Dale E., et al. 2002. Congregations and Membership in the United States 2000. Nashville, TN: Glenmary Research Center.
Food Environment Statistics:
| Bienville Parish: | 1.34 / 10,000 pop. |
| State: | 2.56 / 10,000 pop. |
| This county: | 3.36 / 10,000 pop. |
| Louisiana: | 1.29 / 10,000 pop. |
| Bienville Parish: | 5.38 / 10,000 pop. |
| Louisiana: | 4.49 / 10,000 pop. |
| This county: | 5.38 / 10,000 pop. |
| State: | 5.92 / 10,000 pop. |
| Bienville Parish: | 12.4% |
| Louisiana: | 10.9% |
| Bienville Parish: | 33.2% |
| State: | 29.2% |
| Here: | 17.4% |
| State: | 13.7% |
Agriculture in Bienville Parish:
Average size of farms: 198 acresAverage value of agricultural products sold per farm: $108,227
Average value of crops sold per acre for harvested cropland: $55.89
The value of livestock, poultry, and their products as a percentage of the total market value of agricultural products sold: 98.49%
Average total farm production expenses per farm: $70,532
Harvested cropland as a percentage of land in farms: 14.79%
Average market value of all machinery and equipment per farm: $45,077
The percentage of farms operated by a family or individual: 93.69%
Average age of principal farm operators: 56 years
Average number of cattle and calves per 100 acres of all land in farms: 14.07
Vegetables: 283 harvested acres
Earthquake activity:
Bienville Parish-area historical earthquake activity is significantly above Louisiana state average. It is 316% greater than the overall U.S. average.On 5/17/2012 at 08:12:00, a magnitude 4.8 (4.8 MW, Depth: 3.1 mi, Class: Light, Intensity: IV - V) earthquake occurred 84.1 miles away from Bienville Parish center
On 11/6/2011 at 03:53:10, a magnitude 5.7 (5.7 MW, Depth: 3.2 mi, Class: Moderate, Intensity: VI - VII) earthquake occurred 304.4 miles away from the county center
On 9/3/2016 at 12:02:44, a magnitude 5.8 (5.8 MW, Depth: 3.5 mi) earthquake occurred 356.2 miles away from the county center
On 9/2/2013 at 23:51:15, a magnitude 4.3 (4.3 MW, Depth: 2.9 mi) earthquake occurred 87.7 miles away from the county center
On 9/2/2013 at 21:52:38, a magnitude 4.2 (4.2 MW, Depth: 3.0 mi) earthquake occurred 91.7 miles away from Bienville Parish center
On 1/21/1982 at 00:33:54, a magnitude 4.7 (4.5 MB, 4.7 LG, 4.5 LG) earthquake occurred 198.0 miles away from the county center
Magnitude types: regional Lg-wave magnitude (LG), body-wave magnitude (MB), moment magnitude (MW)
Most recent natural disasters:
- Louisiana Hurricane Delta, Incident Period: October 6, 2020 - October 10, 2020, FEMA Id: 4570, Natural disaster type: Hurricane
- Louisiana Hurricane Laura, Incident Period: August 22, 2020 - August 27, 2020, FEMA Id: 4559, Natural disaster type: Hurricane
- Louisiana Covid-19 Pandemic, Incident Period: January 20, 2020, Major Disaster (Presidential) Declared DR-4484-LA: March 24, 2020, FEMA Id: 4484, Natural disaster type: Other
- Louisiana Severe Storms and Flooding, Incident Period: March 08, 2016 to April 08, 2016, Major Disaster (Presidential) Declared DR-4263: March 13, 2016, FEMA Id: 4263, Natural disaster type: Storm, Flood
- Louisiana Hurricane Ike, Incident Period: September 11, 2008 to November 07, 2008, Major Disaster (Presidential) Declared DR-1792: September 13, 2008, FEMA Id: 1792, Natural disaster type: Hurricane
- Louisiana Hurricane Gustav, Incident Period: September 01, 2008 to September 11, 2008, Major Disaster (Presidential) Declared DR-1786: September 02, 2008, FEMA Id: 1786, Natural disaster type: Hurricane
- Louisiana Hurricane Rita, Incident Period: September 23, 2005 to November 01, 2005, Major Disaster (Presidential) Declared DR-1607: September 24, 2005, FEMA Id: 1607, Natural disaster type: Hurricane
- Louisiana Hurricane Rita, Incident Period: September 20, 2005 to November 01, 2005, Emergency Declared EM-3260: September 21, 2005, FEMA Id: 3260, Natural disaster type: Hurricane
- Louisiana Hurricane Katrina, Incident Period: August 26, 2005 to November 01, 2005, Emergency Declared EM-3212: August 27, 2005, FEMA Id: 3212, Natural disaster type: Hurricane
- Louisiana Severe Winter Storm, Incident Period: December 11, 2000 to January 03, 2001, Major Disaster (Presidential) Declared DR-1357: January 12, 2001, FEMA Id: 1357, Natural disaster type: Winter Storm
- 8 other natural disasters have been reported since 1953.
The number of natural disasters in Bienville Parish (18) is near the US average (15).
Major Disasters (Presidential) Declared: 13
Emergencies Declared: 3
Causes of natural disasters: Hurricanes: 7, Storms: 5, Floods: 4, Winter Storms: 3, Freezes: 2, Ice Storms: 2, Drought: 1, Tornado: 1, Tropical Storm: 1, Other: 1 (Note: some incidents may be assigned to more than one category).
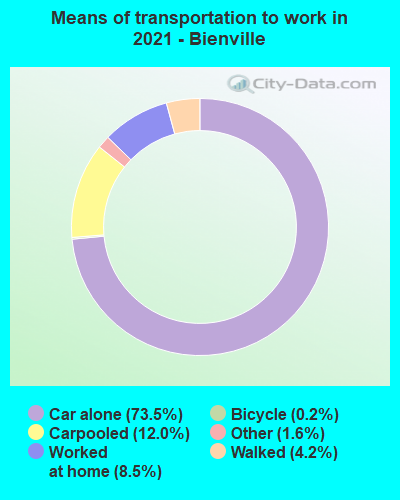
Means of transportation to work:
- Drove a car alone: 2,356 (73.9%)
- Carpooled: 314 (9.9%)
- Taxicab, motorcycle, or other means: 79 (2.5%)
- Bicycle: 5 (0.2%)
- Walked: 126 (4.0%)
- Worked at home: 344 (10.8%)
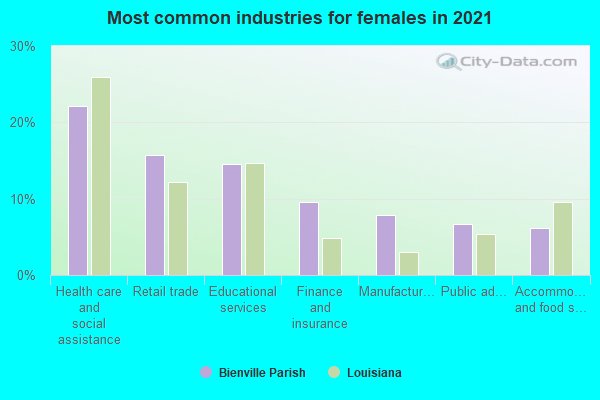
- Health care and social assistance (16%)
- Retail trade (14%)
- Educational services (11%)
- Finance and insurance (8%)
- Public administration (7%)
- Accommodation and food services (6%)
- Manufacturing (5%)
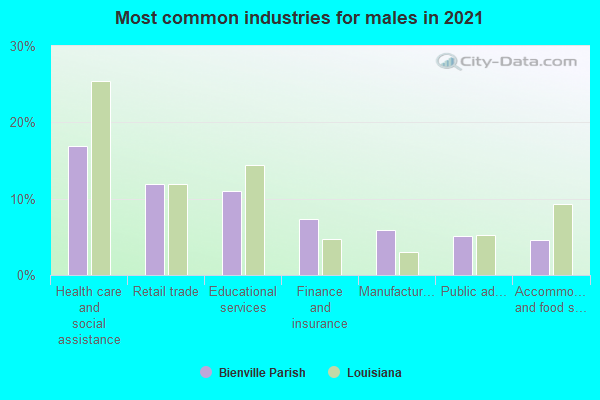
- Health care and social assistance (20%)
- Retail trade (18%)
- Educational services (13%)
- Finance and insurance (11%)
- Public administration (9%)
- Accommodation and food services (8%)
- Manufacturing (7%)
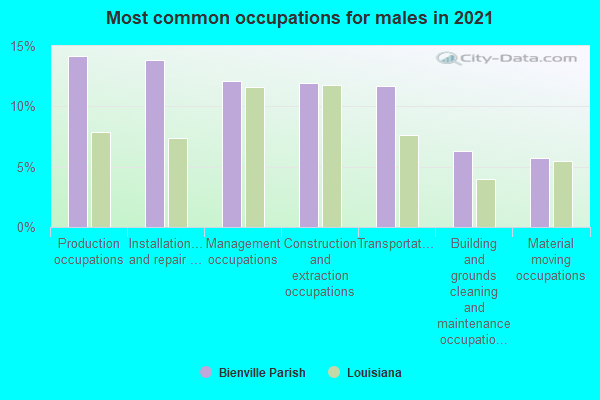
- Production occupations (17%)
- Installation, maintenance, and repair occupations (14%)
- Transportation occupations (12%)
- Construction and extraction occupations (11%)
- Management occupations (9%)
- Building and grounds cleaning and maintenance occupations (8%)
- Material moving occupations (6%)
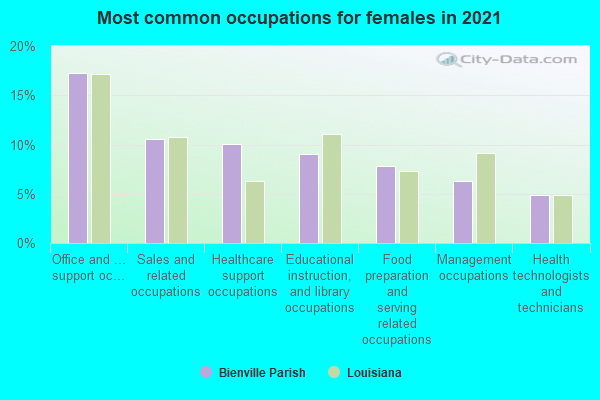
- Office and administrative support occupations (16%)
- Sales and related occupations (13%)
- Food preparation and serving related occupations (11%)
- Management occupations (7%)
- Healthcare support occupations (7%)
- Educational instruction, and library occupations (6%)
- Health diagnosing and treating practitioners and other technical occupations (5%)
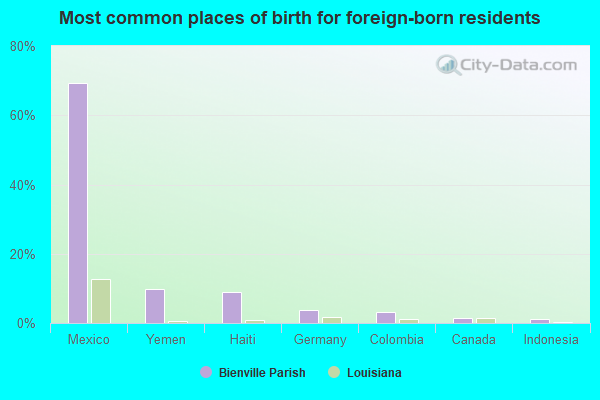
- Mexico (80%)
- Haiti (7%)
- Colombia (3%)
- Germany (2%)
- Canada (2%)
- Cambodia (1%)
- Indonesia (1%)
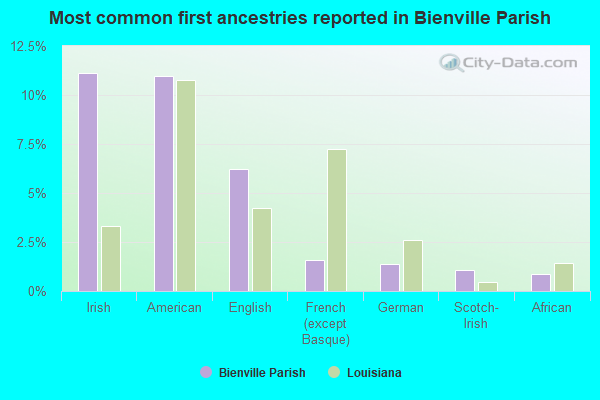
- American (18%)
- Irish (9%)
- English (5%)
- French (except Basque) (2%)
- German (1%)
- Scotch-Irish (1%)
- European (1%)
People in group quarters in Bienville Parish, Louisiana in 2010:
- 267 people in nursing facilities/skilled-nursing facilities
- 44 people in local jails and other municipal confinement facilities
- 8 people in group homes intended for adults
People in group quarters in Bienville Parish, Louisiana in 2000:
- 317 people in nursing homes
- 50 people in local jails and other confinement facilities (including police lockups)
- 6 people in homes for the mentally retarded
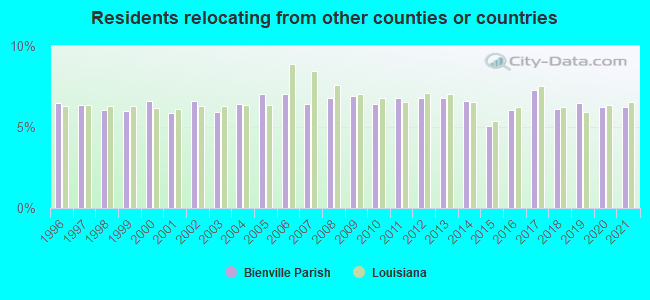
6.26% of this county's 2021 resident taxpayers lived in other counties in 2020 ($39,859 average adjusted gross income)
| Here: | 6.26% |
| Louisiana average: | 6.53% |
10 or fewer of this county's residents moved from foreign countries.
5.06% relocated from other counties in Louisiana ($32,615 average AGI)
1.19% relocated from other states ($7,240 average AGI)
Bienville Parish: 1.19% Louisiana average: 2.12%
Top counties from which taxpayers relocated into this county between 2020 and 2021:
| from Webster Parish, LA | |
| from Caddo Parish, LA | |
| from Lincoln Parish, LA | |
| from Bossier Parish, LA | |
| from Jackson Parish, LA |
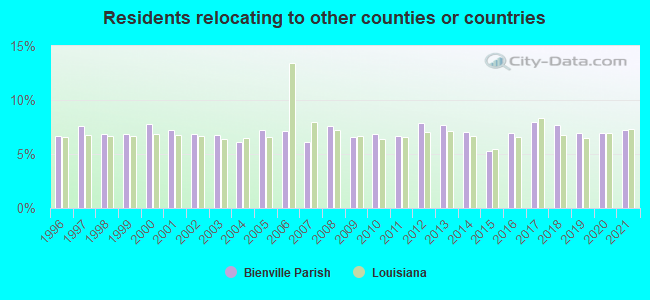
7.26% of this county's 2020 resident taxpayers moved to other counties in 2021 ($38,810 average adjusted gross income)
| Here: | 7.26% |
| Louisiana average: | 7.33% |
10 or fewer of this county's residents moved to foreign countries.
6.10% relocated to other counties in Louisiana ($31,964 average AGI)
1.16% relocated to other states ($6,849 average AGI)
Bienville Parish: 1.16% Louisiana average: 2.97%
Top counties to which taxpayers relocated from this county between 2020 and 2021:
| to Lincoln Parish, LA | |
| to Webster Parish, LA | |
| to Bossier Parish, LA | |
| to Caddo Parish, LA | |
| to Claiborne Parish, LA | |
| to Ouachita Parish, LA |
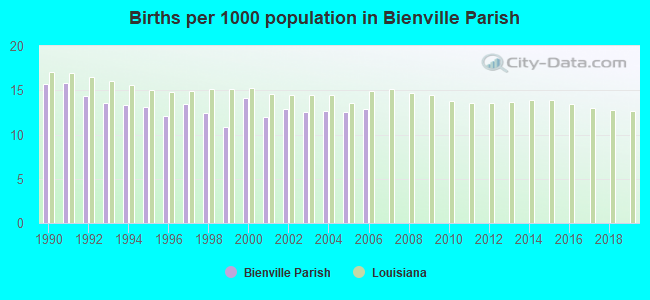
Births per 1000 population from 1990 to 1999: 13.5
Births per 1000 population from 2000 to 2006: 12.8
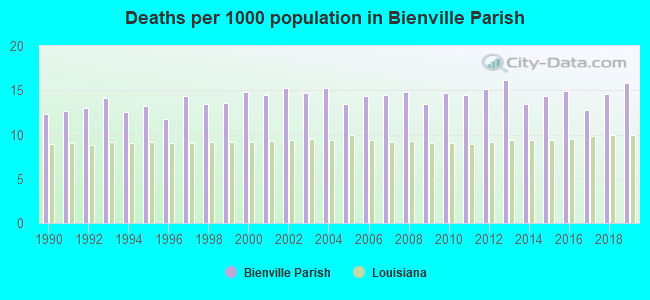
Deaths per 1000 population from 1990 to 1999: 13.1
Deaths per 1000 population from 2000 to 2009: 14.5
Deaths per 1000 population from 2010 to 2020: 15.1
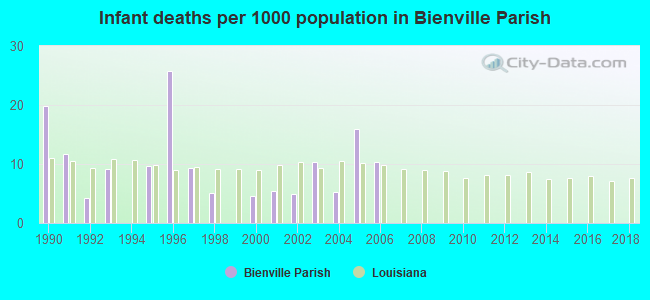
Infant deaths per 1000 live births from 1990 to 1999: 9.5
Infant deaths per 1000 live births from 2000 to 2006: 8.1
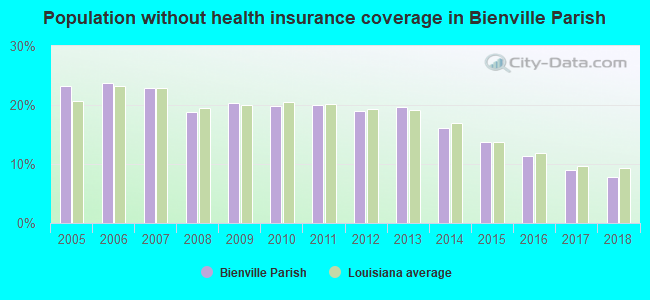
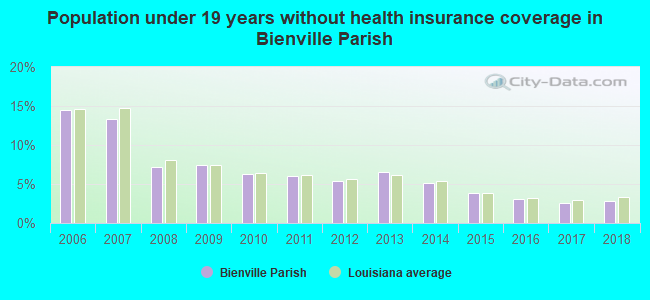
Persons under 19 years old without health insurance coverage in 2018: 2.8%
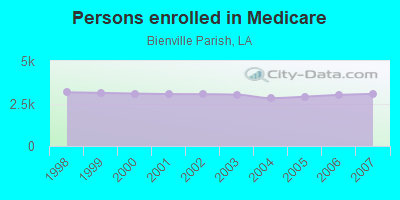
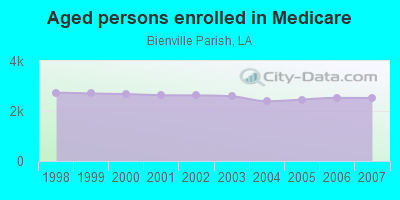
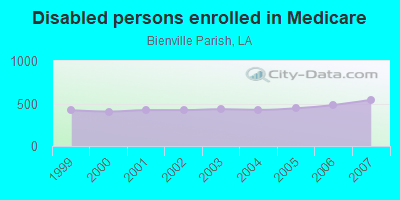
Persons enrolled in hospital insurance and/or supplemental medical insurance (Medicare) in July 1, 2007: 3,066 (2,522 aged, 544 disabled)
Children under 18 without health insurance coverage in 2007: 474 (13%)
Most common underlying causes of death in Bienville Parish, Louisiana in 1999 - 2019:
- Cardiac arrest, unspecified (239)
- Bronchus or lung, unspecified - Malignant neoplasms (234)
- Congestive heart failure (150)
- Alzheimer disease, unspecified (148)
- Acute myocardial infarction, unspecified (93)
- Cardiovascular disease, unspecified (89)
- Pneumonia, unspecified (78)
- Stroke, not specified as haemorrhage or infarction (75)
- Chronic obstructive pulmonary disease, unspecified (62)
- Atherosclerotic heart disease (12)
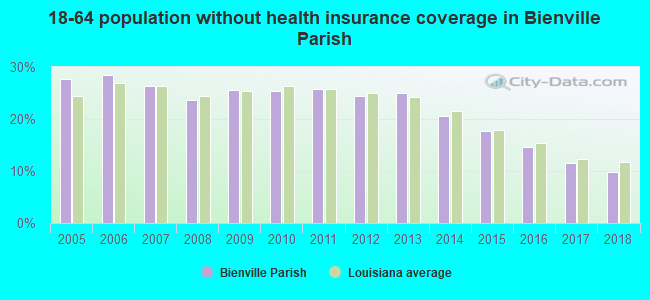
Population without health insurance coverage in 2000: 18%
Children under 18 without health insurance coverage in 2000: 15%
Medical specialist MDs per 100,000 population in 2005: 1,647
Dentists per 100,000 population in 1998: 7
Total births per 100,000 population, July 2005 - July 2006 : 25
Total deaths per 100,000 population, July 2005 - July 2006: 40
Limited-service eating places per 100,000 population in 2005 : 7
Household type by relationship:
Households: 12,817- Male householders: 2,469 (1,041 living alone), Female householders: 3,064 (1,205 living alone)
1,926 spouses (1,922 opposite-sex spouses), 329 unmarried partners, (280 opposite-sex unmarried partners), 3,393 children (3,091 natural, 33 adopted, 257 stepchildren), 722 grandchildren, 157 brothers or sisters, 83 parents, 2 foster children, 295 other relatives, 120 non-relatives
- In group quarters: 322
Size of family households: 1,575 2-persons, 711 3-persons, 478 4-persons, 136 5-persons, 89 6-persons, 134 7-or-more-persons.
Size of nonfamily households: 2,247 1-person, 158 2-persons, 10 3-persons.
839 married couples with children.
1,307 single-parent households (303 men, 1,004 women).
98.0% of residents of Bienville speak English at home.
1.9% of residents speak Spanish at home (69% speak English very well, 6% speak English not well, 25% don't speak English at all).
0.5% of residents speak other Indo-European language at home (98% speak English very well, 2% speak English well).
In fiscal year 2004:
Federal Government expenditure: $111,759,000 ($7,276 per capita)
Department of Defense expenditure: $2,386,000
Federal direct payments to individuals for retirement and disability: $41,873,000
Federal other direct payments to individuals: $33,101,000
Federal direct payments not to individuals: $235,000
Federal grants: $32,534,000
Federal procurement contracts: $739,000 ($-4,000 Department of Defense)
Federal salaries and wages: $3,277,000 ($0,000 Department of Defense)
Federal Government direct loans: $120,000
Federal guaranteed/insured loans: $1,438,000
Federal Government insurance: $551,000
Population change from April 1, 2000 to July 1, 2005:
Births: 1,045| Here: | 69 per 1000 residents |
| State: | 78 per 1000 residents |
Deaths: 1,261
| Here: | 83 per 1000 residents |
| State: | 49 per 1000 residents |
Net international migration: +6
| Here: | +0 per 1000 residents |
| State: | +4 per 1000 residents |
Net internal migration: -345
| Here: | |
| State: |
Total withdrawal of fresh water for public supply: 1.72 millions of gallons per day (all from ground)
| Here: | 5.5 |
| State: | 6.2 |
| Here: | 4.3 |
| State: | 4.4 |
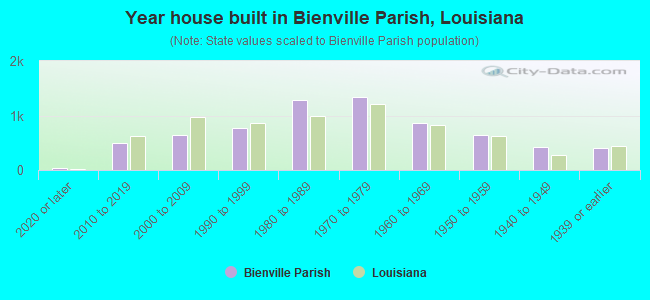
- Year house built in Bienville Parish, Louisiana
- 172020 or later
- 6172010 to 2019
- 5932000 to 2009
- 6721990 to 1999
- 1,4171980 to 1989
- 1,3491970 to 1979
- 8441960 to 1969
- 4871950 to 1959
- 5301940 to 1949
- 3731939 or earlier
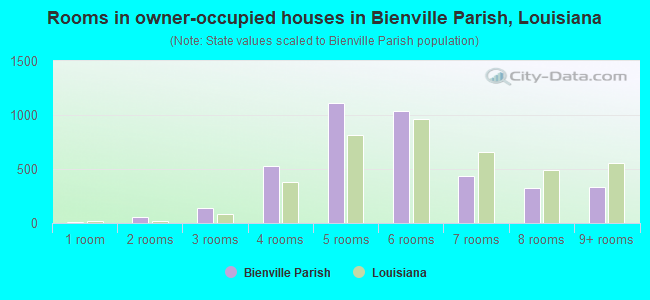
- Rooms in owner-occupied houses in Bienville Parish, Louisiana
- 111 room
- 642 rooms
- 2303 rooms
- 5194 rooms
- 1,2535 rooms
- 9376 rooms
- 4807 rooms
- 2728 rooms
- 3569+ rooms
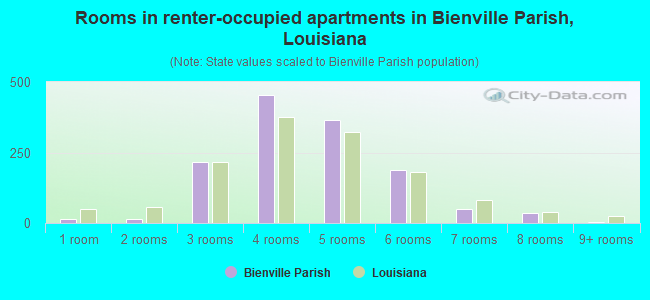
- Rooms in renter-occupied apartments in Bienville Parish, Louisiana
- 381 room
- 362 rooms
- 2703 rooms
- 4704 rooms
- 3705 rooms
- 1716 rooms
- 457 rooms
- 188 rooms
- 59+ rooms
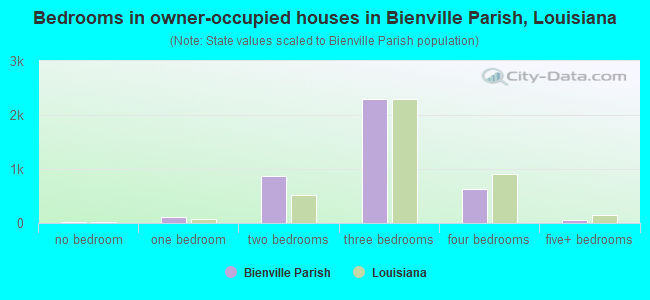
- Bedrooms in owner-occupied houses in Bienville Parish, Louisiana
- 11no bedroom
- 1451 bedroom
- 8672 bedrooms
- 2,4243 bedrooms
- 5764 bedrooms
- 685+ bedrooms
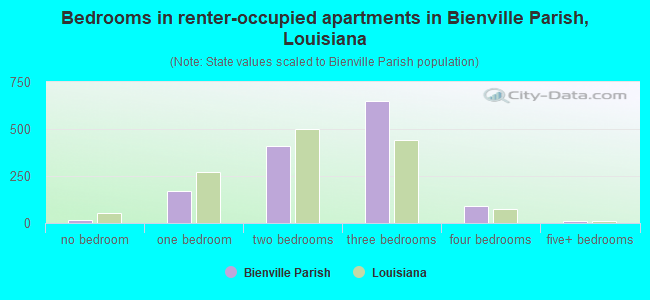
- Bedrooms in renter-occupied apartments in Bienville Parish, Louisiana
- 37no bedroom
- 2461 bedroom
- 4592 bedrooms
- 5863 bedrooms
- 894 bedrooms
- 135+ bedrooms
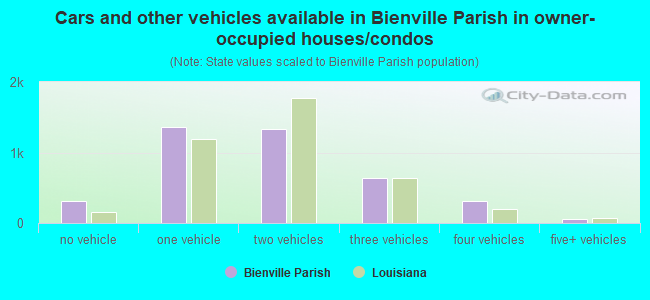
- Cars and other vehicles available in Bienville Parish in owner-occupied houses/condos
- 311no vehicle
- 1,4091 vehicle
- 1,4132 vehicles
- 7163 vehicles
- 2064 vehicles
- 635+ vehicles
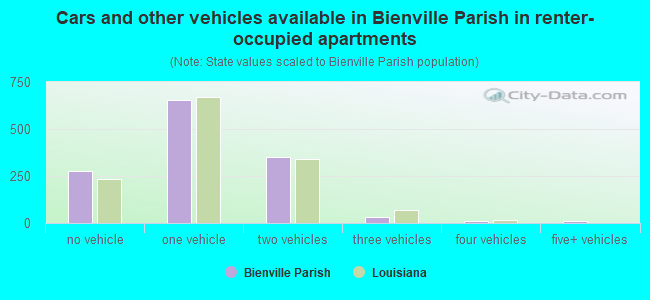
- Cars and other vehicles available in Bienville Parish in renter-occupied apartments
- 402no vehicle
- 6811 vehicle
- 2872 vehicles
- 313 vehicles
- 74 vehicles
- 185+ vehicles
92.0% of Bienville Parish residents lived in the same house 1 years ago.
Out of people who lived in different houses, 35% lived in this county.
Out of people who lived in different counties, 82% lived in Louisiana.
| Bienville Parish: | 92.0% |
| State average: | 88.3% |
Place of birth for U.S.-born residents:
- This state: 11,069
- Other state: 1,561
- Northeast: 57
- Midwest: 153
- South: 958
- West: 376
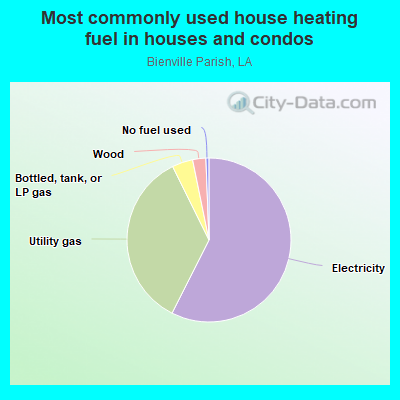
- 58.5%Electricity
- 34.1%Utility gas
- 4.5%Bottled, tank, or LP gas
- 2.5%Wood
- 0.4%No fuel used
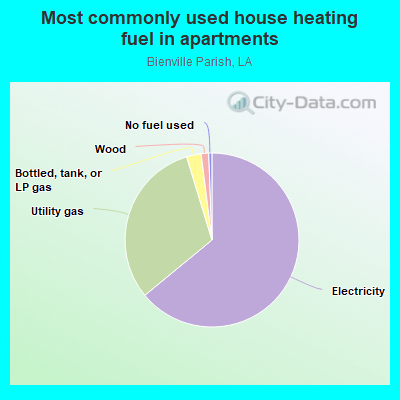
- 62.3%Electricity
- 34.9%Utility gas
- 1.3%Wood
- 1.2%Bottled, tank, or LP gas
- 0.3%No fuel used
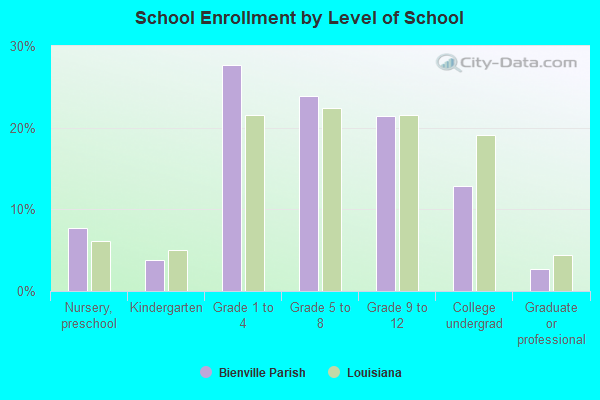
Private vs. public school enrollment:
| Here: | 8.9% |
| Louisiana: | 19.6% |
| Here: | 6.6% |
| Louisiana: | 18.3% |
| Here: | 8.6% |
| Louisiana: | 17.4% |
Bienville Parish government finances - Expenditure in 2018:
- Charges - Other: $3,000
- Construction - Regular Highways: $766,000
Libraries: $369,000
- Current Operations - Regular Highways: $3,303,000
Solid Waste Management: $1,375,000
Central Staff Services: $1,011,000
Libraries: $965,000
Police Protection: $630,000
Local Fire Protection: $571,000
Financial Administration: $357,000
Housing and Community Development: $256,000
Judicial and Legal Services: $249,000
Health - Other: $178,000
General - Other: $147,000
Natural Resources - Other: $47,000
- Federal Intergovernmental - General Local Government Support: $266,000
Housing and Community Development: $253,000
- General - Interest on Debt: $196,000
- Long Term Debt - Beginning Outstanding - Unspecified Public Purpose: $9,579,000
Outstanding Unspecified Public Purpose: $8,975,000
Retired Unspecified Public Purpose: $604,000
- Miscellaneous - Interest Earnings: $144,000
Fines and Forfeits: $82,000
General Revenue - Other: $30,000
Sale of Property: $1,000
- Other Capital Outlay - Local Fire Protection: $289,000
Libraries: $44,000
- Other Funds - Cash and Securities: $19,825,000
- Short Term Debt Outstanding - End of Fiscal Year: $3,000
Beginning: $2,000
- Sinking Funds - Cash and Securities: $600,000
- State Intergovernmental - General Local Government Support: $1,085,000
Highways: $861,000
Other: $404,000
- Tax - Property: $7,447,000
General Sales and Gross Receipts: $2,169,000
Other License: $64,000
Other Selective Sales: $26,000
- Total Salaries and Wages: $729,000
Bienville Parish government finances - Revenue in 2018:
- Charges - Other: $3,000
- Construction - Regular Highways: $766,000
Libraries: $369,000
- Current Operations - Regular Highways: $3,303,000
Solid Waste Management: $1,375,000
Central Staff Services: $1,011,000
Libraries: $965,000
Police Protection: $630,000
Local Fire Protection: $571,000
Financial Administration: $357,000
Housing and Community Development: $256,000
Judicial and Legal Services: $249,000
Health - Other: $178,000
General - Other: $147,000
Natural Resources - Other: $47,000
- Federal Intergovernmental - General Local Government Support: $266,000
Housing and Community Development: $253,000
- General - Interest on Debt: $196,000
- Long Term Debt - Beginning Outstanding - Unspecified Public Purpose: $9,579,000
Outstanding Unspecified Public Purpose: $8,975,000
Retired Unspecified Public Purpose: $604,000
- Miscellaneous - Interest Earnings: $144,000
Fines and Forfeits: $82,000
General Revenue - Other: $30,000
Sale of Property: $1,000
- Other Capital Outlay - Local Fire Protection: $289,000
Libraries: $44,000
- Other Funds - Cash and Securities: $19,825,000
- Short Term Debt Outstanding - End of Fiscal Year: $3,000
Beginning: $2,000
- Sinking Funds - Cash and Securities: $600,000
- State Intergovernmental - General Local Government Support: $1,085,000
Highways: $861,000
Other: $404,000
- Tax - Property: $7,447,000
General Sales and Gross Receipts: $2,169,000
Other License: $64,000
Other Selective Sales: $26,000
- Total Salaries and Wages: $729,000
Bienville Parish government finances - Debt in 2018:
- Charges - Other: $3,000
- Construction - Regular Highways: $766,000
Libraries: $369,000
- Current Operations - Regular Highways: $3,303,000
Solid Waste Management: $1,375,000
Central Staff Services: $1,011,000
Libraries: $965,000
Police Protection: $630,000
Local Fire Protection: $571,000
Financial Administration: $357,000
Housing and Community Development: $256,000
Judicial and Legal Services: $249,000
Health - Other: $178,000
General - Other: $147,000
Natural Resources - Other: $47,000
- Federal Intergovernmental - General Local Government Support: $266,000
Housing and Community Development: $253,000
- General - Interest on Debt: $196,000
- Long Term Debt - Beginning Outstanding - Unspecified Public Purpose: $9,579,000
Outstanding Unspecified Public Purpose: $8,975,000
Retired Unspecified Public Purpose: $604,000
- Miscellaneous - Interest Earnings: $144,000
Fines and Forfeits: $82,000
General Revenue - Other: $30,000
Sale of Property: $1,000
- Other Capital Outlay - Local Fire Protection: $289,000
Libraries: $44,000
- Other Funds - Cash and Securities: $19,825,000
- Short Term Debt Outstanding - End of Fiscal Year: $3,000
Beginning: $2,000
- Sinking Funds - Cash and Securities: $600,000
- State Intergovernmental - General Local Government Support: $1,085,000
Highways: $861,000
Other: $404,000
- Tax - Property: $7,447,000
General Sales and Gross Receipts: $2,169,000
Other License: $64,000
Other Selective Sales: $26,000
- Total Salaries and Wages: $729,000
Bienville Parish government finances - Cash and Securities in 2018:
- Charges - Other: $3,000
- Construction - Regular Highways: $766,000
Libraries: $369,000
- Current Operations - Regular Highways: $3,303,000
Solid Waste Management: $1,375,000
Central Staff Services: $1,011,000
Libraries: $965,000
Police Protection: $630,000
Local Fire Protection: $571,000
Financial Administration: $357,000
Housing and Community Development: $256,000
Judicial and Legal Services: $249,000
Health - Other: $178,000
General - Other: $147,000
Natural Resources - Other: $47,000
- Federal Intergovernmental - General Local Government Support: $266,000
Housing and Community Development: $253,000
- General - Interest on Debt: $196,000
- Long Term Debt - Beginning Outstanding - Unspecified Public Purpose: $9,579,000
Outstanding Unspecified Public Purpose: $8,975,000
Retired Unspecified Public Purpose: $604,000
- Miscellaneous - Interest Earnings: $144,000
Fines and Forfeits: $82,000
General Revenue - Other: $30,000
Sale of Property: $1,000
- Other Capital Outlay - Local Fire Protection: $289,000
Libraries: $44,000
- Other Funds - Cash and Securities: $19,825,000
- Short Term Debt Outstanding - End of Fiscal Year: $3,000
Beginning: $2,000
- Sinking Funds - Cash and Securities: $600,000
- State Intergovernmental - General Local Government Support: $1,085,000
Highways: $861,000
Other: $404,000
- Tax - Property: $7,447,000
General Sales and Gross Receipts: $2,169,000
Other License: $64,000
Other Selective Sales: $26,000
- Total Salaries and Wages: $729,000
Supplemental Security Income (SSI) in 2006:
- Total number of recipients: 843
- Number of aged recipients: 150
- Number of blind and disabled recipients: 693
- Number of recipients under 18: 136
- Number of recipients between 18 and 64: 436
- Number of recipients older than 64: 271
- Number of recipients also receiving OASDI: 339
- Amount of payments (thousands of dollars): 341
| Most common first names in Bienville Parish, LA among deceased individuals | ||
| Name | Count | Lived (average) |
|---|---|---|
| James | 159 | 72.9 years |
| Mary | 134 | 76.3 years |
| William | 131 | 77.0 years |
| John | 129 | 75.4 years |
| Willie | 112 | 74.1 years |
| Robert | 73 | 73.9 years |
| Annie | 71 | 82.1 years |
| Henry | 59 | 75.6 years |
| George | 53 | 78.9 years |
| Mattie | 47 | 83.7 years |
| Most common last names in Bienville Parish, LA among deceased individuals | ||
| Last name | Count | Lived (average) |
|---|---|---|
| Johnson | 96 | 75.2 years |
| Smith | 92 | 74.5 years |
| Davis | 80 | 74.6 years |
| Williams | 79 | 77.6 years |
| Moore | 65 | 76.6 years |
| Thomas | 62 | 79.3 years |
| Martin | 62 | 75.9 years |
| Wilson | 62 | 75.8 years |
| Jackson | 60 | 77.8 years |
| Walker | 57 | 77.5 years |
| Businesses in Bienville Parish, LA | ||||
| Name | Count | Name | Count | |
|---|---|---|---|---|
| Burger King | 1 | Ford | 1 | |
| Church's Chicken | 1 | H&R Block | 1 | |
| Days Inn | 1 | Lane Furniture | 1 | |
| FedEx | 1 | SONIC Drive-In | 1 | |
Bienville Parish on our top lists:
- #92 on the list of "Top 101 counties with the highest number of deaths per 1000 residents 2007-2013"