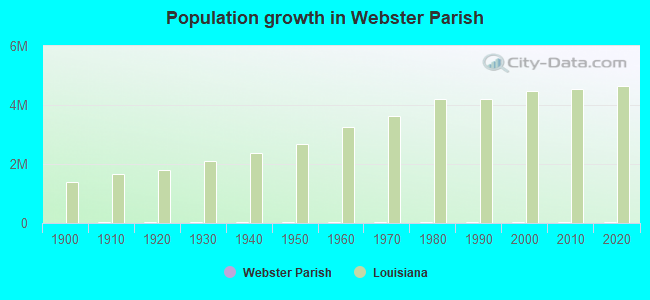
Webster Parish, Louisiana (LA)
County owner-occupied free and clear houses and condos in 2010: 6,048
County owner-occupied houses and condos in 2000: 12,291
Renter-occupied apartments: 4,833 (it was 4,210 in 2000)
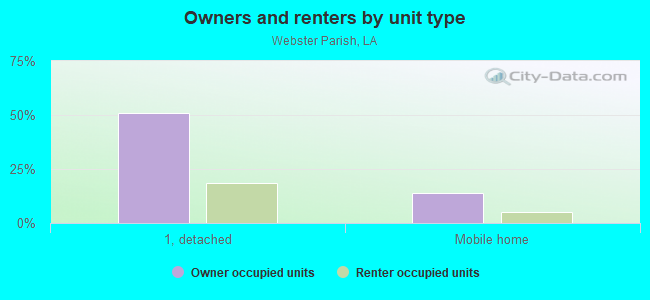
| % of renters here: | 26% |
| State: | 33% |
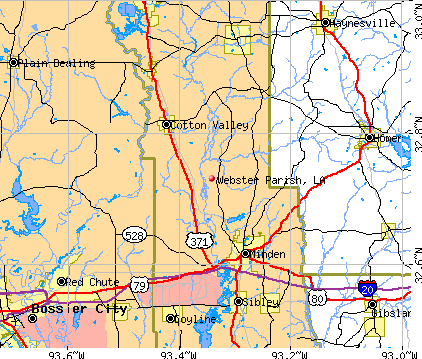
Land area: 595 sq. mi.
Water area: 19.8 sq. mi.
Population density: 61 people per square mile (average).
Industries providing employment: Educational, health and social services (26.0%), Retail trade (15.3%).
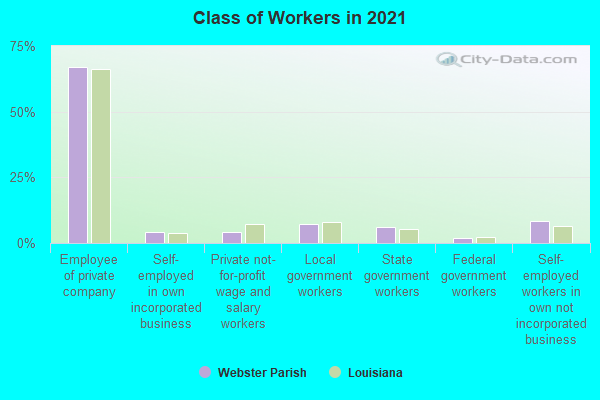
Type of workers:
- Private wage or salary: 75%
- Government: 17%
- Self-employed, not incorporated: 8%
- Unpaid family work: 0%
- OSM Map
- General Map
- Google Map
- MSN Map

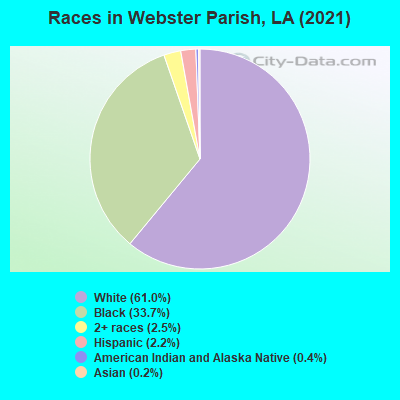
- 22,14961.3%White Non-Hispanic Alone
- 12,01733.3%Black Non-Hispanic Alone
- 9162.5%Two or more races
- 8492.3%Hispanic or Latino
- 940.3%Asian alone
- 820.2%American Indian and Alaska Native alone
- 190.05%Some other race alone
- 70.02%Native Hawaiian and Other
Pacific Islander alone
| Median resident age: | 42.2 years |
| Louisiana median age: | 38.2 years |
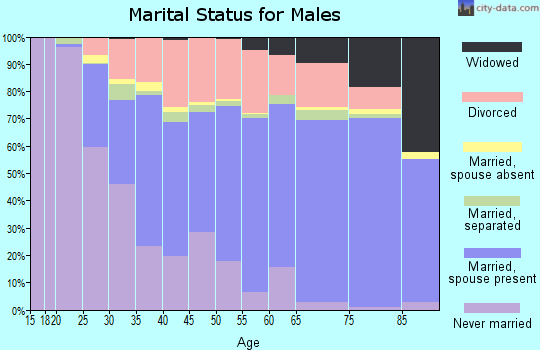
| Males: 17,817 | |
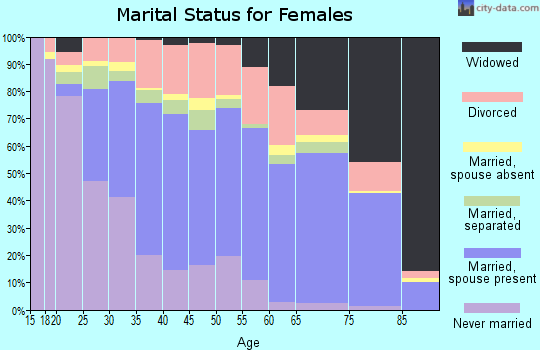
| Females: 18,545 |

 | Shreveport 2012 Metro Area Estimates (0 replies) |
| Best Place to live in North Louisiana? (72 replies) |
| Wild predator (30 replies) |
| History of Webster or Bossier Parish, LA (2 replies) |
| Where can I find "Green Acres" in Caddo/Bossier Parish? (6 replies) |
| Moving to Shreveport Area....Need some advice (9 replies) |
| Webster Parish: | 2.0 people |
| Louisiana: | 3 people |
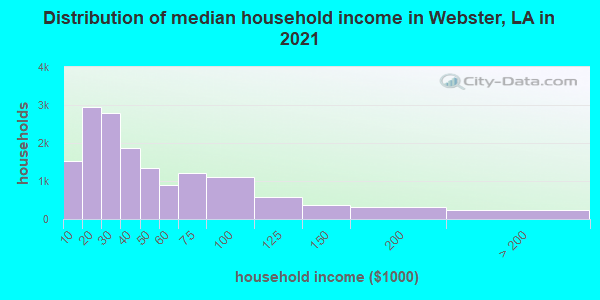
Estimated median household income in 2022: $32,820 ($28,408 in 1999)
| This county: | $32,820 |
| Louisiana: | $55,416 |
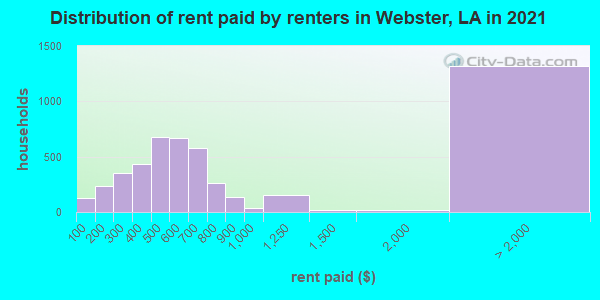
Median contract rent in 2022 for apartments: $500 (lower quartile is $353, upper quartile is $660)
| This county: | $500 |
| State: | $779 |
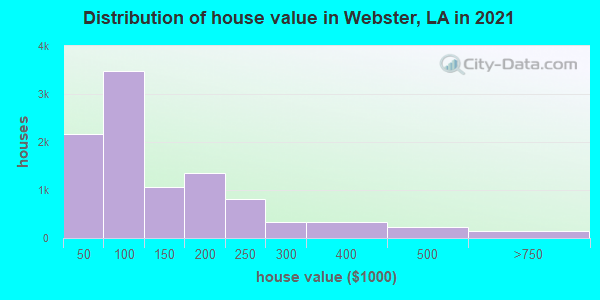
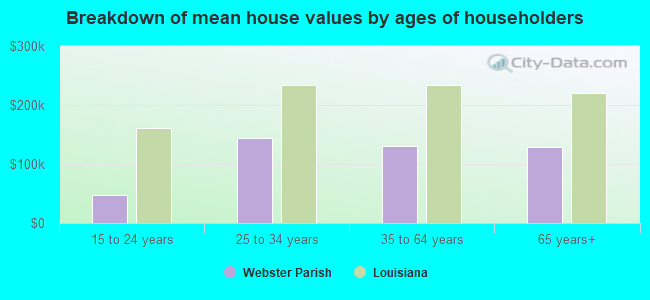
Estimated median house or condo value in 2022: $105,602 (it was $51,900 in 2000)
| Webster: | $105,602 |
| Louisiana: | $209,200 |
Median monthly housing costs for homes and condos with a mortgage: $1,107
Median monthly housing costs for units without a mortgage: $322
Institutionalized population: 1,116
Crime in 2021 (reported by the sheriff's office or county police, not the county total):
- Murders: 0
- Rapes: 1
- Robberies: 2
- Assaults: 22
- Burglaries: 26
- Thefts: 110
- Auto thefts: 23
Crime in 2020 (reported by the sheriff's office or county police, not the county total):
- Murders: 0
- Rapes: 1
- Robberies: 0
- Assaults: 3
- Burglaries: 10
- Thefts: 13
- Auto thefts: 7
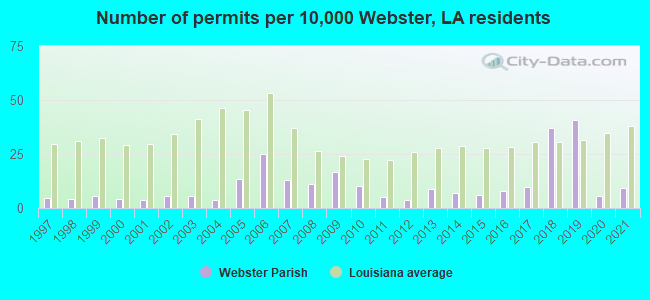
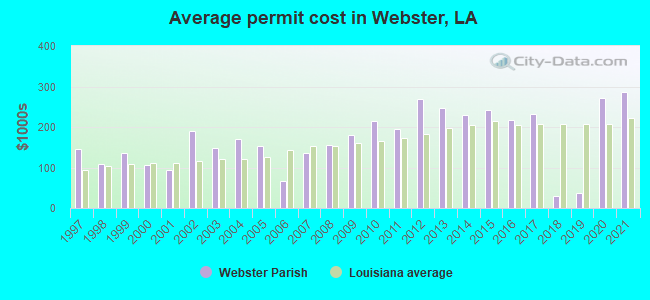
Single-family new house construction building permits:
- 2022: 36 buildings, average cost: $302,900
- 2021: 39 buildings, average cost: $286,200
- 2020: 24 buildings, average cost: $271,800
- 2019: 171 buildings, average cost: $37,500
- 2018: 155 buildings, average cost: $29,800
- 2017: 40 buildings, average cost: $231,800
- 2016: 32 buildings, average cost: $218,100
- 2015: 25 buildings, average cost: $242,400
- 2014: 29 buildings, average cost: $228,900
- 2013: 36 buildings, average cost: $245,900
- 2012: 15 buildings, average cost: $270,200
- 2011: 21 buildings, average cost: $196,000
- 2010: 43 buildings, average cost: $216,300
- 2009: 70 buildings, average cost: $179,500
- 2008: 46 buildings, average cost: $154,600
- 2007: 55 buildings, average cost: $136,100
- 2006: 104 buildings, average cost: $65,900
- 2005: 57 buildings, average cost: $153,600
- 2004: 16 buildings, average cost: $171,200
- 2003: 23 buildings, average cost: $147,100
- 2002: 23 buildings, average cost: $190,100
- 2001: 16 buildings, average cost: $94,300
- 2000: 17 buildings, average cost: $106,400
- 1999: 24 buildings, average cost: $134,900
- 1998: 18 buildings, average cost: $108,400
- 1997: 20 buildings, average cost: $145,900
Median real estate property taxes paid for housing units with mortgages in 2022: $592 (0.4%)
Median real estate property taxes paid for housing units with no mortgage in 2022: $268 (0.3%)
| Webster Parish: | 27.5% |
| Louisiana: | 18.6% |
Median age of residents in 2022: 42.2 years old
(Males: 39.6 years old, Females: 44.7 years old)
(Median age for: White residents: 45.6 years old, Black residents: 38.1 years old, American Indian residents: 53.0 years old, Asian residents: 40.0 years old, Hispanic or Latino residents: 19.7 years old, Other race residents: 35.5 years old)
Fair market rent in 2006 for a 1-bedroom apartment in Webster Parish is $339 a month.
Fair market rent for a 2-bedroom apartment is $429 a month.
Fair market rent for a 3-bedroom apartment is $578 a month.
Cities in this county include: Minden, Springhill, Cullen, Cotton Valley, Sibley, Sarepta, Doyline, Dixie Inn, Dubberly, Heflin.
Notable locations in this county outside city limits:
Notable locations in Webster Parish: Camp (A), North Louisiana Experimental Station (B), Sugar Creek Camp (C), Bucktail Camp (D), Corney Lake Picnic Area (E), North Louisiana Hill Farm Experiment Station (F), State Line (G), North Louisiana Experimental Station (H), Turkey Pot Campground (I), Claiborne Parish Fire District 6 Baileytown Station (J), Wade State Correctional Center (K), Claiborne Parish Fire District 6 Sharon Station (L), Claiborne Parish Fire District 6 Antioch Station (M), Claiborne Parish Fire District 6 Arizona Station (N), Claiborne Parish Fire District 6 Summerfield Station (O). Display/hide their locations on the map
Churches in Webster Parish include: Weldon Baptist Church (A), Mount Paron Primitive Baptist Church (B), Holly Springs Baptist Church (C), Harmony Chapel United Methodist Church (D), D'Arbonne Church (E), Bethany Church (F), Bethel Church (G), Bethlehem Church (H), Gilgal Church (I). Display/hide their locations on the map
Cemeteries: Macedonia Cemetery (1), Lower Old Athens Cemetery (2), Kimbell Cemetery (3), Hurricane Cemetery (4), Holly Springs Cemetery (5), Holly Grove Cemetery (6), Gordon Cemetery (7). Display/hide their locations on the map
Lakes and reservoirs: Spring Lake (A), King Lake (B), Kidd Lake (C), Marsalis Ponds (D), Craighead Pond (E), Lake Claiborne (F), Goodwin Lake (G), Corney Lake (H). Display/hide their locations on the map
Streams, rivers, and creeks: Cox Creek (A), Cow Creek (B), Coleman Creek (C), Clear Creek (D), Butler Creek (E), Bullock Creek (F), Doe Branch (G), Cypress Creek (H), Dixie Creek (I). Display/hide their locations on the map
Park in Webster Parish: Lake Claiborne State Park (1). Display/hide its location on the map
Neighboring counties: Caddo Parish  , Yuma County, Arizona
  , Claiborne Parish
  , Elmore County, Alabama
  , Rankin County, Mississippi , Yoakum County, Texas .
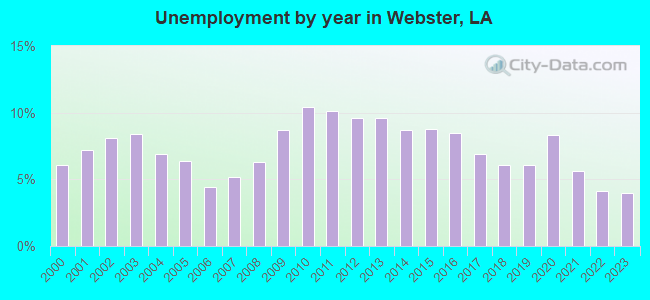
| Here: | 4.6% |
| Louisiana: | 3.8% |
Current college students: 1,480
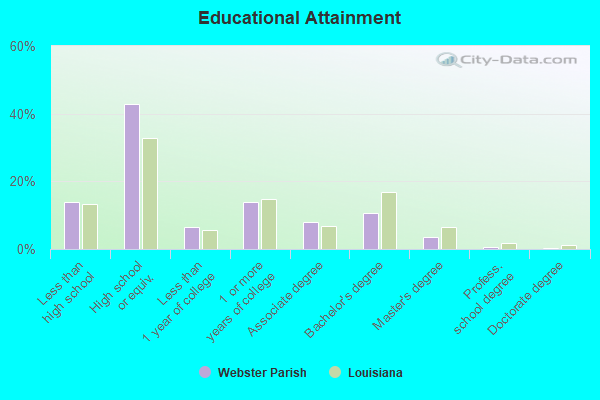
People 25 years of age or older with a high school degree or higher: 86.7%
People 25 years of age or older with a bachelor's degree or higher: 14.4%
Number of foreign born residents: 358 (43.6% naturalized citizens)
| Webster Parish: | 1.0% |
| Whole state: | 4.2% |
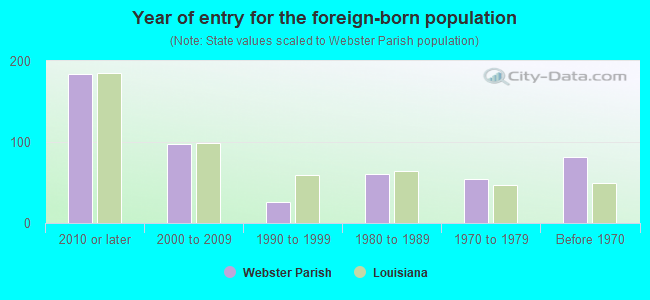
- Year of entry for the foreign-born population
- 2202010 or later
- 302000 to 2009
- 311990 to 1999
- 601980 to 1989
- 541970 to 1979
- 82Before 1970
Mean travel time to work (commute): minutes
Percentage of county residents living and working in this county: 96.6%
Housing units in structures:
- One, detached: 12,856
- One, attached: 193
- Two: 297
- 3 or 4: 486
- 5 to 9: 365
- 10 to 19: 268
- 20 to 49: 95
- 50 or more: 81
- Mobile homes: 3,868
- Boats, RVs, vans, etc.: 142
Housing units in Webster Parish with a mortgage: 3,991 (278 second mortgage, 25 home equity loan, 60 both second mortgage and home equity loan)
Houses without a mortgage: 22
| Here: | 12.0% with mortgage |
| State: | 98.3% with mortgage |
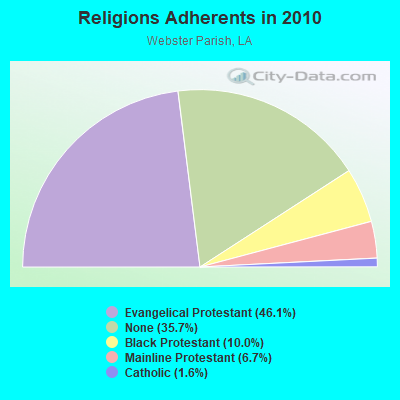
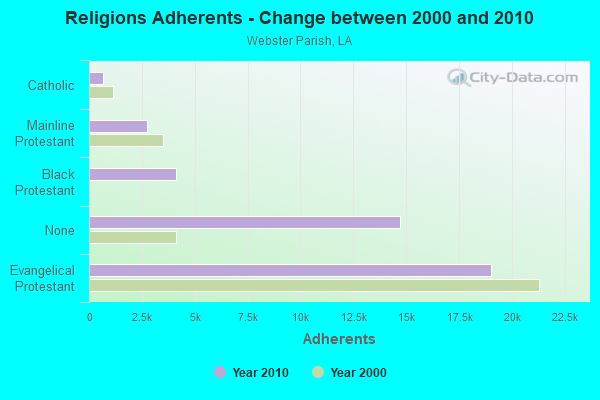
Religion statistics for Webster Parish
| Religion | Adherents | Congregations |
|---|---|---|
| Evangelical Protestant | 18,988 | 64 |
| Black Protestant | 4,126 | 23 |
| Mainline Protestant | 2,747 | 16 |
| Catholic | 642 | 2 |
| Other | 2 | 1 |
| None | 14,702 | - |
Source: Clifford Grammich, Kirk Hadaway, Richard Houseal, Dale E.Jones, Alexei Krindatch, Richie Stanley and Richard H.Taylor. 2012. 2010 U.S.Religion Census: Religious Congregations & Membership Study. Association of Statisticians of American Religious Bodies. Jones, Dale E., et al. 2002. Congregations and Membership in the United States 2000. Nashville, TN: Glenmary Research Center.
Food Environment Statistics:
| Webster Parish: | 1.96 / 10,000 pop. |
| State: | 2.56 / 10,000 pop. |
| Here: | 0.24 / 10,000 pop. |
| Louisiana: | 0.18 / 10,000 pop. |
| This county: | 0.98 / 10,000 pop. |
| Louisiana: | 1.29 / 10,000 pop. |
| Webster Parish: | 7.10 / 10,000 pop. |
| Louisiana: | 4.49 / 10,000 pop. |
| This county: | 4.16 / 10,000 pop. |
| State: | 5.92 / 10,000 pop. |
| Webster Parish: | 13.4% |
| Louisiana: | 10.9% |
| Webster Parish: | 31.4% |
| State: | 29.2% |
| Here: | 13.3% |
| State: | 13.7% |
Agriculture in Webster Parish:
Average size of farms: 133 acresAverage value of agricultural products sold per farm: $17,687
Average value of crops sold per acre for harvested cropland: $65.82
The value of nursery, greenhouse, floriculture, and sod as a percentage of the total market value of agricultural products sold: 1.55%
The value of livestock, poultry, and their products as a percentage of the total market value of agricultural products sold: 92.11%
Average total farm production expenses per farm: $14,203
Harvested cropland as a percentage of land in farms: 15.92%
Irrigated harvested cropland as a percentage of land in farms: 2.21%
Average market value of all machinery and equipment per farm: $36,061
The percentage of farms operated by a family or individual: 94.84%
Average age of principal farm operators: 58 years
Average number of cattle and calves per 100 acres of all land in farms: 16.67
Vegetables: 47 harvested acres
Land in orchards: 28 acres
Tornado activity:
Webster Parish historical area-adjusted tornado activity is significantly below Louisiana state average. It is 1603022.2 times below overall U.S. average.Tornadoes in this county have caused 5 fatalities and 23 injuries recorded between 1950 and 2004.
On 2/12/1950, a category 2 (max. wind speeds 113-157 mph) tornado killed 5 people and injured 10 people and caused between $50,000 and $500,000 in damages.
Earthquake activity:
Webster Parish-area historical earthquake activity is significantly above Louisiana state average. It is 356% greater than the overall U.S. average.On 5/17/2012 at 08:12:00, a magnitude 4.8 (4.8 MW, Depth: 3.1 mi, Class: Light, Intensity: IV - V) earthquake occurred 81.7 miles away from Webster Parish center
On 11/6/2011 at 03:53:10, a magnitude 5.7 (5.7 MW, Depth: 3.2 mi, Class: Moderate, Intensity: VI - VII) earthquake occurred 275.6 miles away from the county center
On 9/3/2016 at 12:02:44, a magnitude 5.8 (5.8 MW, Depth: 3.5 mi) earthquake occurred 327.1 miles away from the county center
On 9/2/2013 at 23:51:15, a magnitude 4.3 (4.3 MW, Depth: 2.9 mi) earthquake occurred 85.1 miles away from the county center
On 1/21/1982 at 00:33:54, a magnitude 4.7 (4.5 MB, 4.7 LG, 4.5 LG) earthquake occurred 180.9 miles away from Webster Parish center
On 5/4/2001 at 06:42:12, a magnitude 4.7 (4.2 MB, 4.7 LG, 4.5 LG) earthquake occurred 183.5 miles away from the county center
Magnitude types: regional Lg-wave magnitude (LG), body-wave magnitude (MB), moment magnitude (MW)
Most recent natural disasters:
- Louisiana Hurricane Delta, Incident Period: October 6, 2020 - October 10, 2020, FEMA Id: 4570, Natural disaster type: Hurricane
- Louisiana Hurricane Laura, Incident Period: August 22, 2020 - August 27, 2020, FEMA Id: 4559, Natural disaster type: Hurricane
- Louisiana Covid-19 Pandemic, Incident Period: January 20, 2020, Major Disaster (Presidential) Declared DR-4484-LA: March 24, 2020, FEMA Id: 4484, Natural disaster type: Other
- Louisiana Severe Storms and Flooding, Incident Period: March 08, 2016 to April 08, 2016, Major Disaster (Presidential) Declared DR-4263: March 13, 2016, FEMA Id: 4263, Natural disaster type: Storm, Flood
The number of natural disasters in Webster Parish (4) is a lot smaller than the US average (15).
Major Disasters (Presidential) Declared: 2
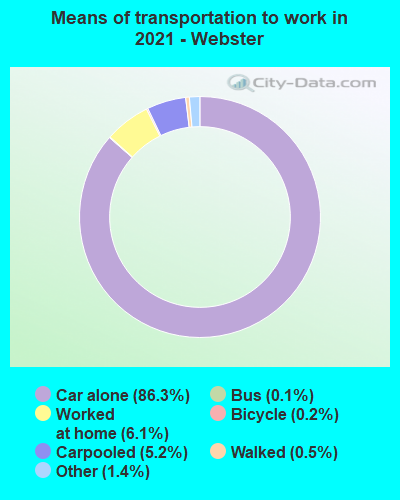
Means of transportation to work:
- Drove a car alone: 11,102 (84.2%)
- Carpooled: 546 (4.1%)
- Bus: 17 (0.1%)
- Taxicab, motorcycle, or other means: 197 (1.5%)
- Bicycle: 24 (0.2%)
- Walked: 141 (1.1%)
- Worked at home: 1,206 (9.1%)
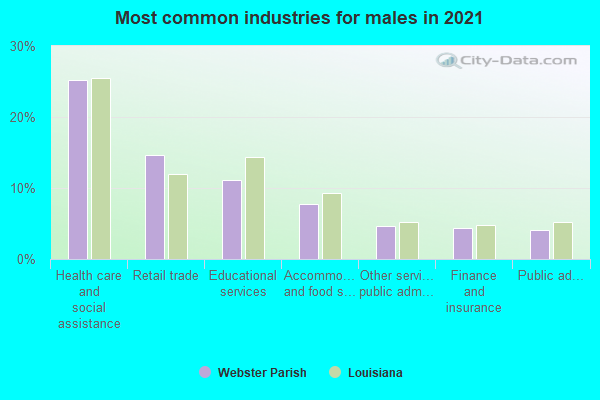
- Health care and social assistance (27%)
- Retail trade (19%)
- Educational services (13%)
- Accommodation and food services (7%)
- Public administration (5%)
- Other services, except public administration (4%)
- Manufacturing (3%)
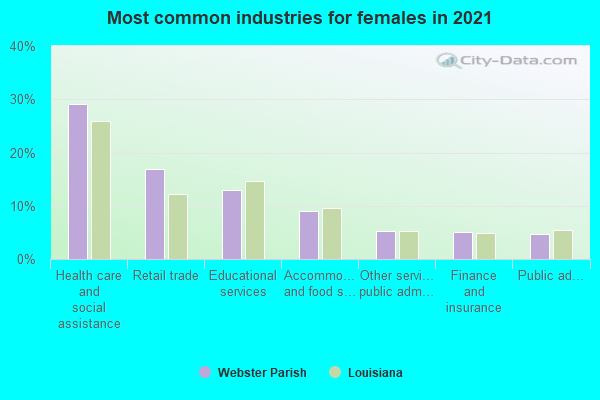
- Health care and social assistance (28%)
- Retail trade (20%)
- Educational services (14%)
- Accommodation and food services (7%)
- Public administration (5%)
- Other services, except public administration (4%)
- Manufacturing (3%)
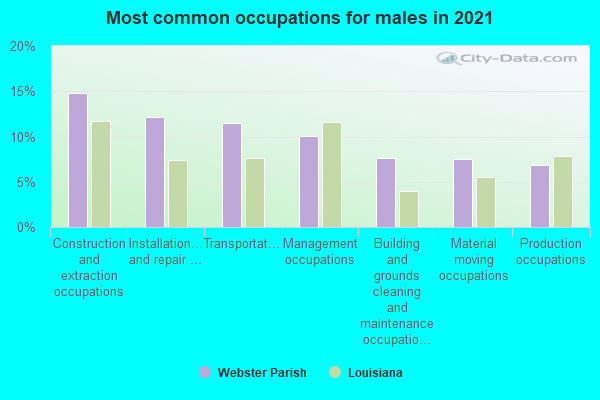
- Construction and extraction occupations (14%)
- Installation, maintenance, and repair occupations (11%)
- Management occupations (10%)
- Production occupations (10%)
- Transportation occupations (10%)
- Building and grounds cleaning and maintenance occupations (8%)
- Sales and related occupations (7%)
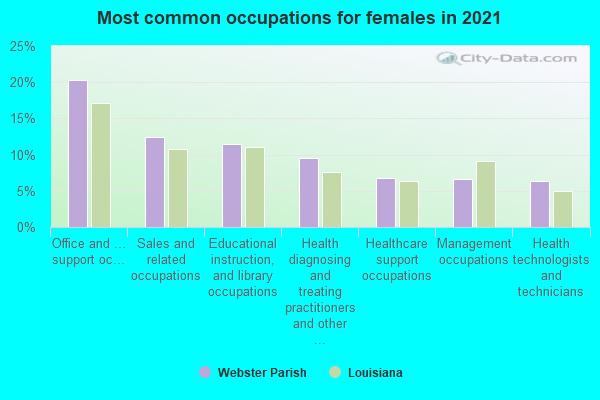
- Office and administrative support occupations (19%)
- Sales and related occupations (17%)
- Educational instruction, and library occupations (11%)
- Health diagnosing and treating practitioners and other technical occupations (10%)
- Management occupations (7%)
- Food preparation and serving related occupations (6%)
- Healthcare support occupations (6%)
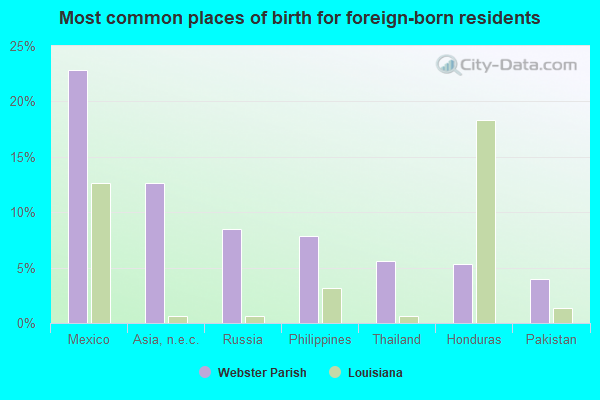
- Mexico (17%)
- Asia, n.e.c. (13%)
- Philippines (7%)
- Honduras (7%)
- Thailand (6%)
- Nicaragua (6%)
- Brazil (4%)
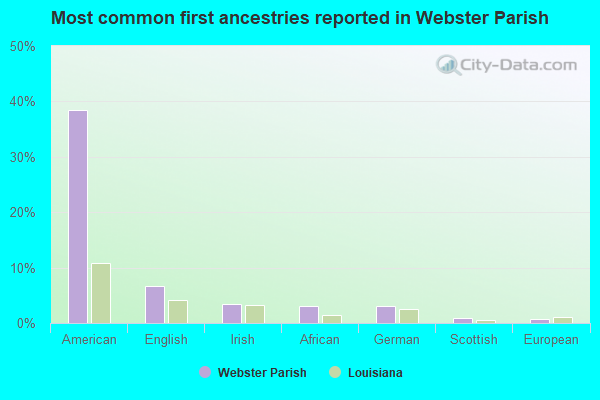
- American (45%)
- English (7%)
- Irish (4%)
- German (4%)
- African (2%)
- Scottish (1%)
- European (1%)
People in group quarters in Webster Parish, Louisiana in 2010:
- 447 people in correctional residential facilities
- 407 people in nursing facilities/skilled-nursing facilities
- 262 people in local jails and other municipal confinement facilities
- 73 people in group homes intended for adults
- 17 people in other noninstitutional facilities
- 14 people in emergency and transitional shelters (with sleeping facilities) for people experiencing homelessness
- 11 people in workers' group living quarters and job corps centers
People in group quarters in Webster Parish, Louisiana in 2000:
- 467 people in nursing homes
- 278 people in local jails and other confinement facilities (including police lockups)
- 120 people in homes for the mentally retarded
- 60 people in other noninstitutional group quarters
- 7 people in homes or halfway houses for drug/alcohol abuse
- 4 people in other workers' dormitories
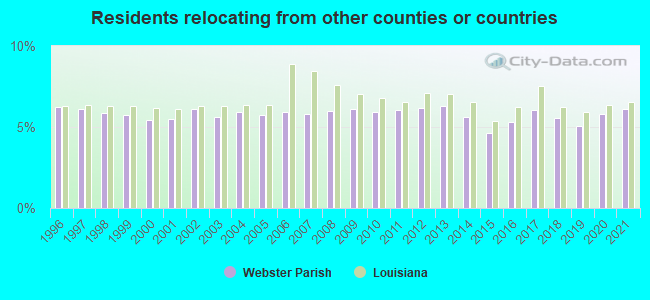
6.11% of this county's 2021 resident taxpayers lived in other counties in 2020 ($38,721 average adjusted gross income)
| Here: | 6.11% |
| Louisiana average: | 6.53% |
10 or fewer of this county's residents moved from foreign countries.
4.11% relocated from other counties in Louisiana ($25,808 average AGI)
2.00% relocated from other states ($12,913 average AGI)
Webster Parish: 2.00% Louisiana average: 2.12%
Top counties from which taxpayers relocated into this county between 2020 and 2021:
| from Bossier Parish, LA | |
| from Caddo Parish, LA | |
| from Claiborne Parish, LA | |
| from Bienville Parish, LA | |
| from Columbia County, AR |
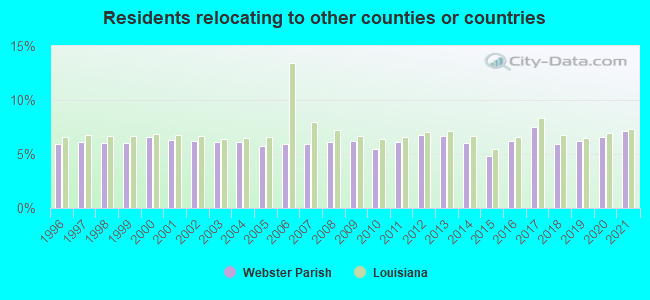
7.10% of this county's 2020 resident taxpayers moved to other counties in 2021 ($38,612 average adjusted gross income)
| Here: | 7.10% |
| Louisiana average: | 7.33% |
10 or fewer of this county's residents moved to foreign countries.
4.74% relocated to other counties in Louisiana ($25,556 average AGI)
2.36% relocated to other states ($13,058 average AGI)
Webster Parish: 2.36% Louisiana average: 2.97%
Top counties to which taxpayers relocated from this county between 2020 and 2021:
| to Bossier Parish, LA | |
| to Caddo Parish, LA | |
| to Claiborne Parish, LA | |
| to Bienville Parish, LA | |
| to Columbia County, AR | |
| to Ouachita Parish, LA |
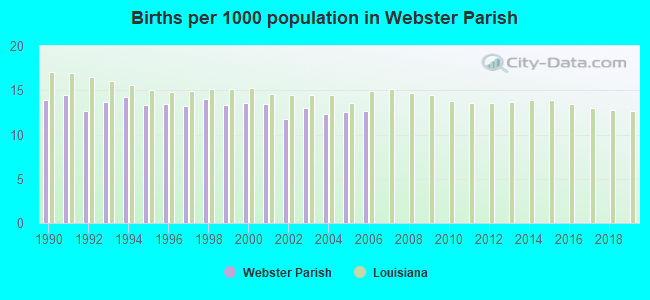
Births per 1000 population from 1990 to 1999: 13.6
Births per 1000 population from 2000 to 2006: 12.7
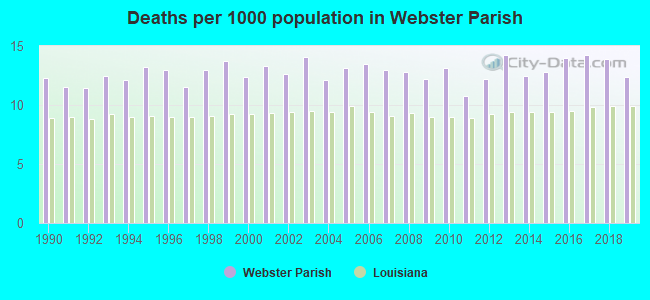
Deaths per 1000 population from 1990 to 1999: 12.4
Deaths per 1000 population from 2000 to 2009: 12.9
Deaths per 1000 population from 2010 to 2020: 13.5
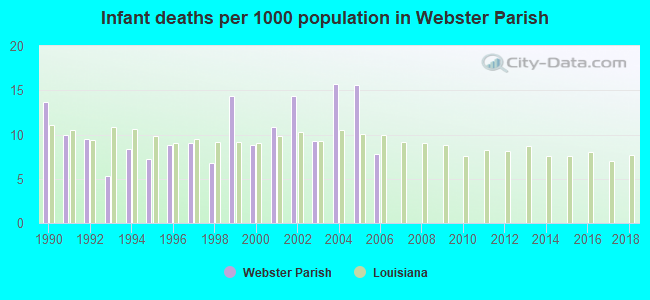
Infant deaths per 1000 live births from 1990 to 1999: 9.3
Infant deaths per 1000 live births from 2000 to 2006: 11.8
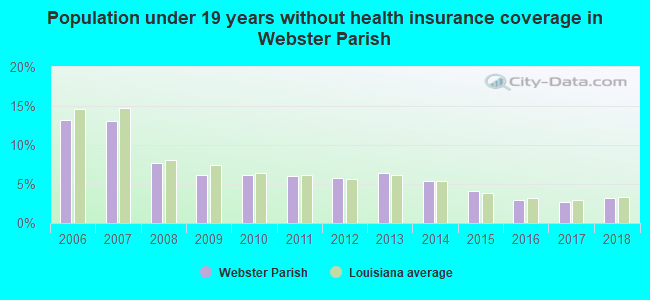
Persons under 19 years old without health insurance coverage in 2018: 3.2%
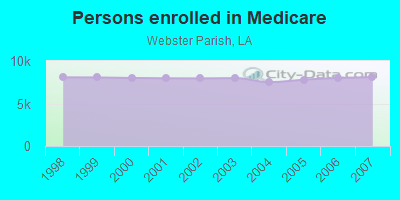
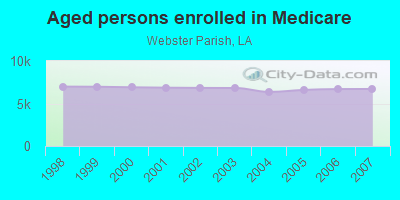
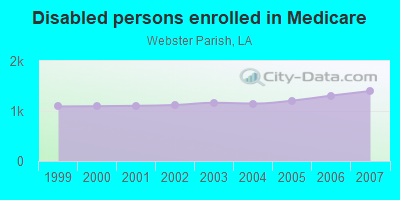
Persons enrolled in hospital insurance and/or supplemental medical insurance (Medicare) in July 1, 2007: 8,110 (6,710 aged, 1,400 disabled)
Children under 18 without health insurance coverage in 2007: 1,241 (13%)
Most common underlying causes of death in Webster Parish, Louisiana in 1999 - 2019:
- Acute myocardial infarction, unspecified (1,034)
- Atherosclerotic heart disease (737)
- Bronchus or lung, unspecified - Malignant neoplasms (734)
- Chronic obstructive pulmonary disease, unspecified (563)
- Congestive heart failure (394)
- Alzheimer disease, unspecified (361)
- Stroke, not specified as haemorrhage or infarction (345)
- Pneumonia, unspecified (308)
- Septicaemia, unspecified (272)
- Unspecified diabetes mellitus, without complications (233)
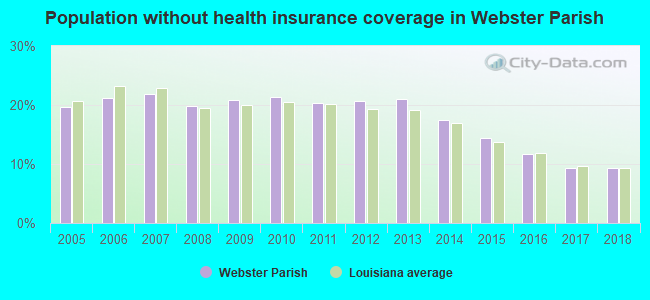
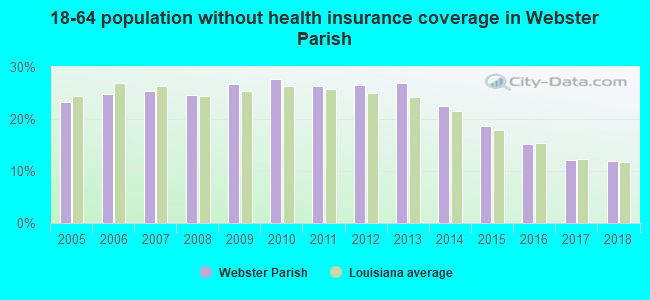
Population without health insurance coverage in 2000: 15%
Children under 18 without health insurance coverage in 2000: 12%
Short term general hospital admissions per 100,000 population in 2004: 17,305
Short term general hospital beds per 100,000 population in 2004: 635
Emergency room visits per 100,000 population in 2004: 66,878
General practice office based MDs per 100,000 population in 2005: 1,286
Medical specialist MDs per 100,000 population in 2005: 1,253
Dentists per 100,000 population in 1998: 10
Total births per 100,000 population, July 2005 - July 2006 : 30
Total deaths per 100,000 population, July 2005 - July 2006: 82
Limited-service eating places per 100,000 population in 2005 : 2
Homicides per 1,000,000 population from 2000 to 2006: 100.8. This is less than state average.
Suicides per 1,000,000 population from 2000 to 2006: 149.4. This is more than state average.
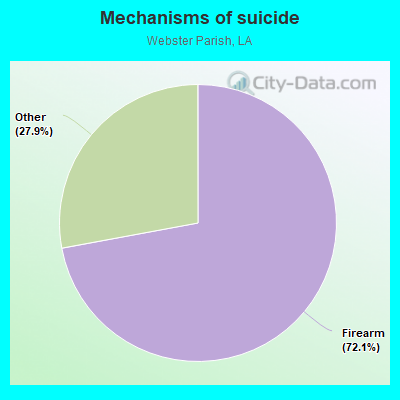
- Firearm - 107.7
- Other - 41.7
Household type by relationship:
Households: 36,362- Male householders: 6,449 (1,870 living alone), Female householders: 8,795 (3,039 living alone)
6,312 spouses (6,299 opposite-sex spouses), 860 unmarried partners, (809 opposite-sex unmarried partners), 9,659 children (8,830 natural, 324 adopted, 507 stepchildren), 1,309 grandchildren, 492 brothers or sisters, 272 parents, 13 foster children, 769 other relatives, 524 non-relatives
- In group quarters: 994
Size of family households: 4,481 2-persons, 2,163 3-persons, 1,788 4-persons, 877 5-persons, 238 6-persons, 46 7-or-more-persons.
Size of nonfamily households: 4,904 1-person, 687 2-persons, 19 3-persons.
3,999 married couples with children.
2,665 single-parent households (687 men, 1,978 women).
98.6% of residents of Webster speak English at home.
0.9% of residents speak Spanish at home (63% speak English very well, 24% speak English well, 13% speak English not well).
0.8% of residents speak other Indo-European language at home (61% speak English very well, 10% speak English well, 13% speak English not well, 15% don't speak English at all).
0.1% of residents speak Asian or Pacific Island language at home (24% speak English very well, 60% speak English well, 17% speak English not well).
In fiscal year 2004:
Federal Government expenditure: $296,012,000 ($7,175 per capita)
Department of Defense expenditure: $17,094,000
Federal direct payments to individuals for retirement and disability: $122,403,000
Federal other direct payments to individuals: $78,651,000
Federal direct payments not to individuals: $537,000
Federal grants: $76,408,000
Federal procurement contracts: $11,352,000 ($9,385,000 Department of Defense)
Federal salaries and wages: $6,660,000 ($574,000 Department of Defense)
Federal Government direct loans: $486,000
Federal guaranteed/insured loans: $11,072,000
Federal Government insurance: $11,471,000
Population change from April 1, 2000 to July 1, 2005:
Births: 2,864| Here: | 69 per 1000 residents |
| State: | 78 per 1000 residents |
Deaths: 2,884
| Here: | 70 per 1000 residents |
| State: | 49 per 1000 residents |
Net international migration: +44
| Here: | +1 per 1000 residents |
| State: | +4 per 1000 residents |
Net internal migration: -444
| Here: | |
| State: |
Total withdrawal of fresh water for public supply: 6.23 millions of gallons per day (all from ground)
| Here: | 5.9 |
| State: | 6.2 |
| Here: | 4.7 |
| State: | 4.4 |
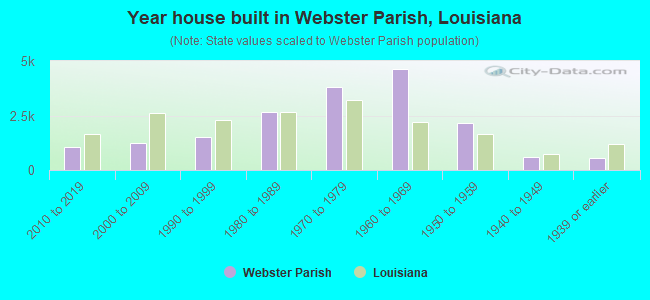
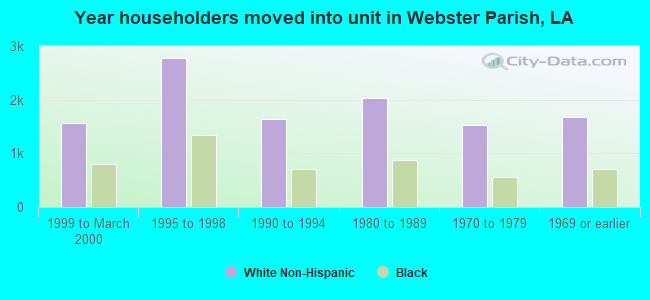
- Year house built in Webster Parish, Louisiana
- 1022020 or later
- 1,0662010 to 2019
- 1,4352000 to 2009
- 1,4861990 to 1999
- 2,9161980 to 1989
- 3,7641970 to 1979
- 3,9781960 to 1969
- 2,1631950 to 1959
- 6821940 to 1949
- 4191939 or earlier
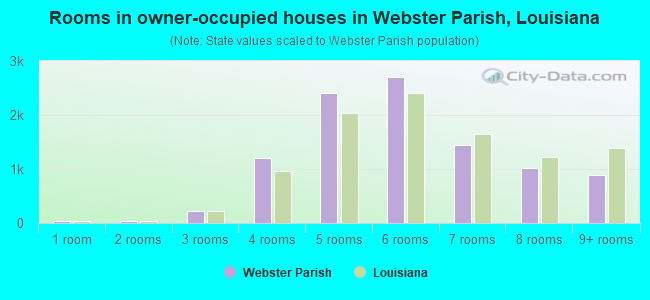
- Rooms in owner-occupied houses in Webster Parish, Louisiana
- 171 room
- 682 rooms
- 1663 rooms
- 1,1794 rooms
- 2,6765 rooms
- 2,6746 rooms
- 1,5097 rooms
- 1,0288 rooms
- 9409+ rooms
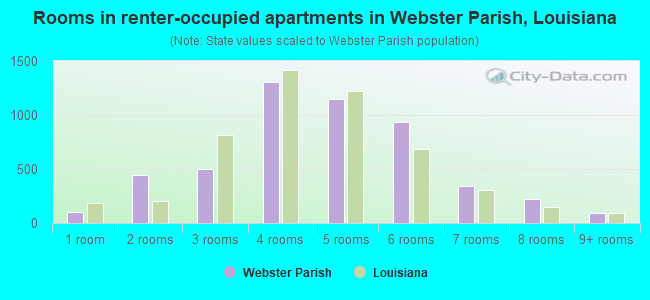
- Rooms in renter-occupied apartments in Webster Parish, Louisiana
- 901 room
- 4192 rooms
- 4783 rooms
- 1,2164 rooms
- 1,1485 rooms
- 1,0006 rooms
- 3647 rooms
- 1228 rooms
- 739+ rooms
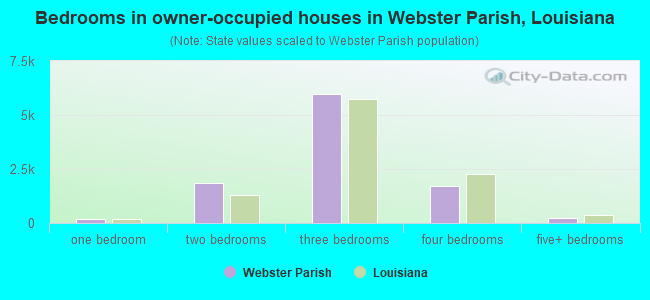
- Bedrooms in owner-occupied houses in Webster Parish, Louisiana
- 21no bedroom
- 1471 bedroom
- 1,9312 bedrooms
- 5,9903 bedrooms
- 1,9684 bedrooms
- 1955+ bedrooms
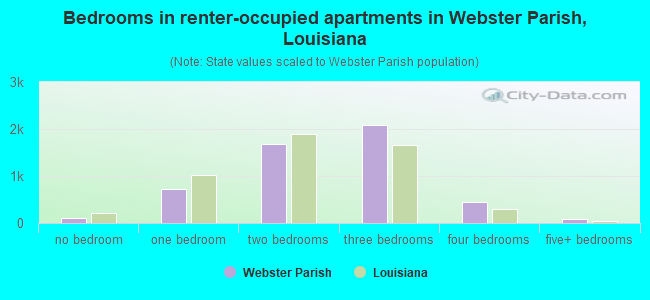
- Bedrooms in renter-occupied apartments in Webster Parish, Louisiana
- 89no bedroom
- 7151 bedroom
- 1,5092 bedrooms
- 2,1143 bedrooms
- 4644 bedrooms
- 365+ bedrooms
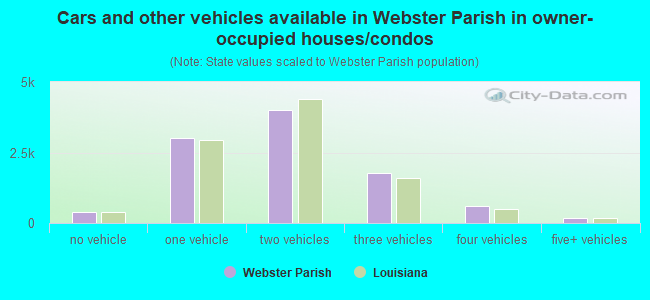
- Cars and other vehicles available in Webster Parish in owner-occupied houses/condos
- 344no vehicle
- 3,2261 vehicle
- 3,8432 vehicles
- 1,9733 vehicles
- 7284 vehicles
- 1755+ vehicles
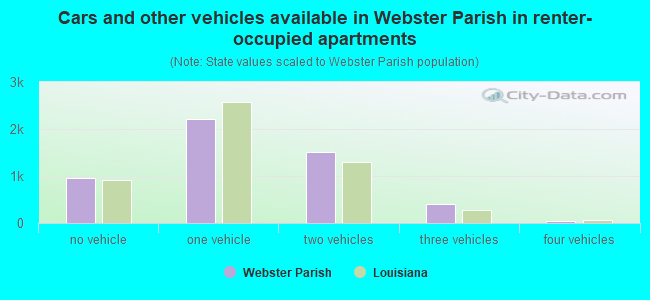
- Cars and other vehicles available in Webster Parish in renter-occupied apartments
- 965no vehicle
- 2,2831 vehicle
- 1,2442 vehicles
- 3903 vehicles
- 574 vehicles
- 25+ vehicles
93.5% of Webster Parish residents lived in the same house 1 years ago.
Out of people who lived in different houses, 34% lived in this county.
Out of people who lived in different counties, 74% lived in Louisiana.
| Webster Parish: | 93.5% |
| State average: | 88.3% |
Place of birth for U.S.-born residents:
- This state: 29,250
- Other state: 6,630
- Northeast: 279
- Midwest: 531
- South: 4,710
- West: 1,088
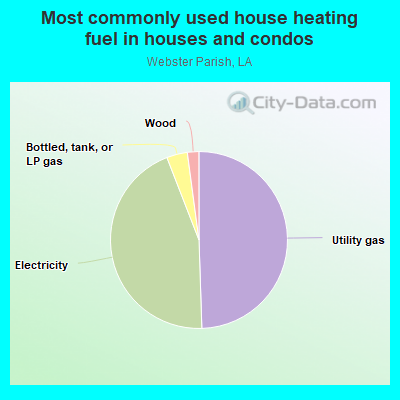
- 48.4%Utility gas
- 47.3%Electricity
- 2.6%Bottled, tank, or LP gas
- 1.6%Wood
- 0.1%Other fuel
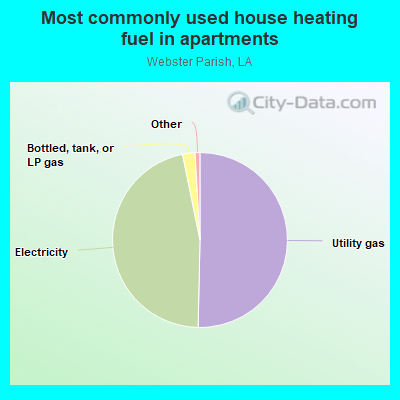
- 51.3%Utility gas
- 45.9%Electricity
- 1.7%Bottled, tank, or LP gas
- 0.9%No fuel used
- 0.1%Fuel oil, kerosene, etc.
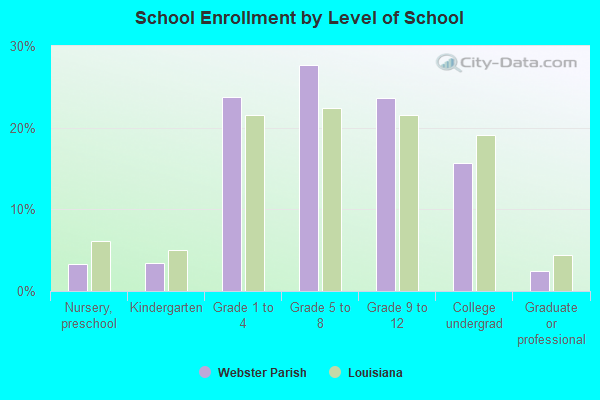
Private vs. public school enrollment:
| Here: | 9.2% |
| Louisiana: | 19.6% |
| Here: | 10.1% |
| Louisiana: | 18.3% |
| Here: | 17.6% |
| Louisiana: | 17.4% |
Webster Parish government finances - Expenditure in 2020:
- Charges - Miscellaneous Commercial Activities: $1,107,000
Miscellaneous Commercial Activities: $880,000
- Current Operations - Police Protection: $6,800,000
Police Protection: $5,977,000
Central Staff Services: $4,428,000
Central Staff Services: $3,892,000
General - Other: $1,265,000
General - Other: $1,112,000
Water Utilities: $633,000
Water Utilities: $622,000
- Long Term Debt - Beginning Outstanding - Public Debt for Private Purpose: $4,150,000
Outstanding Nonguaranteed - Industrial Revenue: $4,015,000
Beginning Outstanding - Public Debt for Private Purpose: $3,880,000
Outstanding Nonguaranteed - Industrial Revenue: $3,745,000
Retired Nonguaranteed - Public Debt for Private Purpose: $135,000
Retired Nonguaranteed - Public Debt for Private Purpose: $135,000
- Miscellaneous - Fines and Forfeits: $8,698,000
Fines and Forfeits: $5,550,000
Royalties: $474,000
Royalties: $302,000
Interest Earnings: $158,000
Interest Earnings: $101,000
- Other Funds - Cash and Securities: $27,833,000
Cash and Securities: $21,297,000
- Revenue - Electric Utilities: $1,001,000
Electric Utilities: $949,000
Gas Utilities: $333,000
Gas Utilities: $316,000
- Sinking Funds - Cash and Securities: $6,817,000
Cash and Securities: $4,015,000
- State Intergovernmental - Other: $3,163,000
Other: $2,449,000
- Tax - General Sales and Gross Receipts: $14,707,000
General Sales and Gross Receipts: $13,877,000
Property: $791,000
Property: $746,000
- Total Salaries and Wages: $13,122,000
: $11,599,000
Webster Parish government finances - Revenue in 2020:
- Charges - Miscellaneous Commercial Activities: $1,107,000
Miscellaneous Commercial Activities: $880,000
- Current Operations - Police Protection: $6,800,000
Police Protection: $5,977,000
Central Staff Services: $4,428,000
Central Staff Services: $3,892,000
General - Other: $1,265,000
General - Other: $1,112,000
Water Utilities: $633,000
Water Utilities: $622,000
- Long Term Debt - Beginning Outstanding - Public Debt for Private Purpose: $4,150,000
Outstanding Nonguaranteed - Industrial Revenue: $4,015,000
Beginning Outstanding - Public Debt for Private Purpose: $3,880,000
Outstanding Nonguaranteed - Industrial Revenue: $3,745,000
Retired Nonguaranteed - Public Debt for Private Purpose: $135,000
Retired Nonguaranteed - Public Debt for Private Purpose: $135,000
- Miscellaneous - Fines and Forfeits: $8,698,000
Fines and Forfeits: $5,550,000
Royalties: $474,000
Royalties: $302,000
Interest Earnings: $158,000
Interest Earnings: $101,000
- Other Funds - Cash and Securities: $27,833,000
Cash and Securities: $21,297,000
- Revenue - Electric Utilities: $1,001,000
Electric Utilities: $949,000
Gas Utilities: $333,000
Gas Utilities: $316,000
- Sinking Funds - Cash and Securities: $6,817,000
Cash and Securities: $4,015,000
- State Intergovernmental - Other: $3,163,000
Other: $2,449,000
- Tax - General Sales and Gross Receipts: $14,707,000
General Sales and Gross Receipts: $13,877,000
Property: $791,000
Property: $746,000
- Total Salaries and Wages: $13,122,000
: $11,599,000
Webster Parish government finances - Debt in 2020:
- Charges - Miscellaneous Commercial Activities: $1,107,000
Miscellaneous Commercial Activities: $880,000
- Current Operations - Police Protection: $6,800,000
Police Protection: $5,977,000
Central Staff Services: $4,428,000
Central Staff Services: $3,892,000
General - Other: $1,265,000
General - Other: $1,112,000
Water Utilities: $633,000
Water Utilities: $622,000
- Long Term Debt - Beginning Outstanding - Public Debt for Private Purpose: $4,150,000
Outstanding Nonguaranteed - Industrial Revenue: $4,015,000
Beginning Outstanding - Public Debt for Private Purpose: $3,880,000
Outstanding Nonguaranteed - Industrial Revenue: $3,745,000
Retired Nonguaranteed - Public Debt for Private Purpose: $135,000
Retired Nonguaranteed - Public Debt for Private Purpose: $135,000
- Miscellaneous - Fines and Forfeits: $8,698,000
Fines and Forfeits: $5,550,000
Royalties: $474,000
Royalties: $302,000
Interest Earnings: $158,000
Interest Earnings: $101,000
- Other Funds - Cash and Securities: $27,833,000
Cash and Securities: $21,297,000
- Revenue - Electric Utilities: $1,001,000
Electric Utilities: $949,000
Gas Utilities: $333,000
Gas Utilities: $316,000
- Sinking Funds - Cash and Securities: $6,817,000
Cash and Securities: $4,015,000
- State Intergovernmental - Other: $3,163,000
Other: $2,449,000
- Tax - General Sales and Gross Receipts: $14,707,000
General Sales and Gross Receipts: $13,877,000
Property: $791,000
Property: $746,000
- Total Salaries and Wages: $13,122,000
: $11,599,000
Webster Parish government finances - Cash and Securities in 2020:
- Charges - Miscellaneous Commercial Activities: $1,107,000
Miscellaneous Commercial Activities: $880,000
- Current Operations - Police Protection: $6,800,000
Police Protection: $5,977,000
Central Staff Services: $4,428,000
Central Staff Services: $3,892,000
General - Other: $1,265,000
General - Other: $1,112,000
Water Utilities: $633,000
Water Utilities: $622,000
- Long Term Debt - Beginning Outstanding - Public Debt for Private Purpose: $4,150,000
Outstanding Nonguaranteed - Industrial Revenue: $4,015,000
Beginning Outstanding - Public Debt for Private Purpose: $3,880,000
Outstanding Nonguaranteed - Industrial Revenue: $3,745,000
Retired Nonguaranteed - Public Debt for Private Purpose: $135,000
Retired Nonguaranteed - Public Debt for Private Purpose: $135,000
- Miscellaneous - Fines and Forfeits: $8,698,000
Fines and Forfeits: $5,550,000
Royalties: $474,000
Royalties: $302,000
Interest Earnings: $158,000
Interest Earnings: $101,000
- Other Funds - Cash and Securities: $27,833,000
Cash and Securities: $21,297,000
- Revenue - Electric Utilities: $1,001,000
Electric Utilities: $949,000
Gas Utilities: $333,000
Gas Utilities: $316,000
- Sinking Funds - Cash and Securities: $6,817,000
Cash and Securities: $4,015,000
- State Intergovernmental - Other: $3,163,000
Other: $2,449,000
- Tax - General Sales and Gross Receipts: $14,707,000
General Sales and Gross Receipts: $13,877,000
Property: $791,000
Property: $746,000
- Total Salaries and Wages: $13,122,000
: $11,599,000
Supplemental Security Income (SSI) in 2006:
- Total number of recipients: 1,799
- Number of aged recipients: 268
- Number of blind and disabled recipients: 1,531
- Number of recipients under 18: 296
- Number of recipients between 18 and 64: 1,014
- Number of recipients older than 64: 489
- Number of recipients also receiving OASDI: 722
- Amount of payments (thousands of dollars): 760
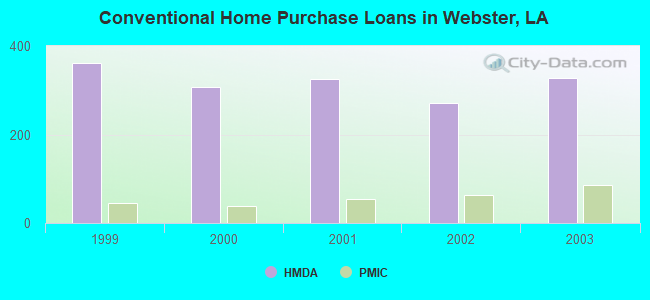
| Home Mortgage Disclosure Act Aggregated Statistics For Year 2003 (Based on 11 full tracts) | ||||||||||
| A) FHA, FSA/RHS & VA Home Purchase Loans | B) Conventional Home Purchase Loans | C) Refinancings | D) Home Improvement Loans | F) Non-occupant Loans on < 5 Family Dwellings (A B C & D) | ||||||
|---|---|---|---|---|---|---|---|---|---|---|
| Number | Average Value | Number | Average Value | Number | Average Value | Number | Average Value | Number | Average Value | |
| LOANS ORIGINATED | 53 | $74,698 | 328 | $76,427 | 713 | $72,830 | 97 | $22,619 | 95 | $59,684 |
| APPLICATIONS APPROVED, NOT ACCEPTED | 9 | $73,222 | 33 | $58,758 | 122 | $81,607 | 16 | $25,125 | 10 | $44,600 |
| APPLICATIONS DENIED | 9 | $64,333 | 169 | $46,698 | 358 | $86,612 | 90 | $16,333 | 17 | $38,000 |
| APPLICATIONS WITHDRAWN | 4 | $59,500 | 44 | $62,250 | 188 | $96,176 | 14 | $28,500 | 9 | $45,778 |
| FILES CLOSED FOR INCOMPLETENESS | 1 | $90,000 | 6 | $78,333 | 28 | $81,714 | 2 | $40,000 | 1 | $55,000 |
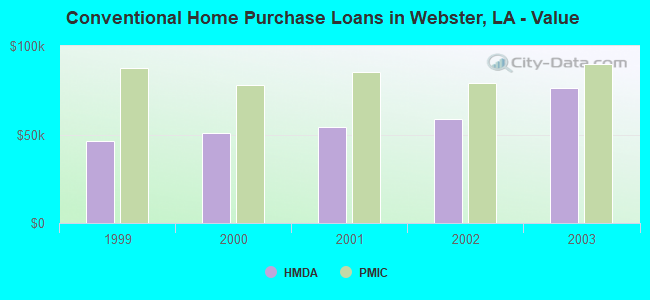
| Private Mortgage Insurance Companies Aggregated Statistics For Year 2003 (Based on 11 full tracts) | ||||||
| A) Conventional Home Purchase Loans | B) Refinancings | C) Non-occupant Loans on < 5 Family Dwellings (A & B) | ||||
|---|---|---|---|---|---|---|
| Number | Average Value | Number | Average Value | Number | Average Value | |
| LOANS ORIGINATED | 87 | $89,862 | 101 | $106,663 | 10 | $77,900 |
| APPLICATIONS APPROVED, NOT ACCEPTED | 18 | $89,833 | 19 | $93,579 | 0 | $0 |
| APPLICATIONS DENIED | 6 | $89,667 | 3 | $87,000 | 0 | $0 |
| APPLICATIONS WITHDRAWN | 0 | $0 | 1 | $81,000 | 0 | $0 |
| FILES CLOSED FOR INCOMPLETENESS | 1 | $76,000 | 0 | $0 | 0 | $0 |
| Most common first names in Webster Parish, LA among deceased individuals | ||
| Name | Count | Lived (average) |
|---|---|---|
| John | 405 | 74.2 years |
| James | 393 | 72.7 years |
| William | 316 | 74.0 years |
| Mary | 313 | 78.9 years |
| Willie | 267 | 75.2 years |
| Robert | 213 | 70.8 years |
| George | 150 | 75.3 years |
| Annie | 134 | 83.3 years |
| Thomas | 129 | 72.5 years |
| Charles | 128 | 68.9 years |
| Most common last names in Webster Parish, LA among deceased individuals | ||
| Last name | Count | Lived (average) |
|---|---|---|
| Smith | 262 | 74.9 years |
| Jones | 208 | 75.9 years |
| Johnson | 167 | 74.2 years |
| Williams | 146 | 76.1 years |
| Harris | 143 | 73.6 years |
| Brown | 132 | 75.4 years |
| Walker | 120 | 75.6 years |
| Martin | 119 | 75.1 years |
| White | 117 | 77.0 years |
| Moore | 116 | 76.1 years |
| Businesses in Webster Parish, LA | ||||
| Name | Count | Name | Count | |
|---|---|---|---|---|
| AT&T | 1 | Holiday Inn | 1 | |
| Ace Hardware | 1 | KFC | 2 | |
| Advance Auto Parts | 1 | La-Z-Boy | 1 | |
| Arby's | 1 | Lane Furniture | 3 | |
| AutoZone | 1 | McDonald's | 2 | |
| Best Western | 1 | Nike | 3 | |
| Blockbuster | 1 | Payless | 1 | |
| Burger King | 1 | Pizza Hut | 2 | |
| CVS | 1 | RadioShack | 1 | |
| Chevrolet | 2 | Rite Aid | 1 | |
| Church's Chicken | 1 | SONIC Drive-In | 3 | |
| Circle K | 2 | Sears | 1 | |
| Dairy Queen | 1 | Subway | 4 | |
| Domino's Pizza | 1 | Taco Bell | 1 | |
| FedEx | 3 | True Value | 1 | |
| Ford | 1 | U-Haul | 1 | |
| GNC | 1 | UPS | 1 | |
| GameStop | 1 | Walgreens | 1 | |
| Goodwill | 1 | Walmart | 2 | |
| H&R Block | 2 | Wendy's | 1 | |