Carroll County, Tennessee (TN)
County owner-occupied free and clear houses and condos in 2010: 4,121
County owner-occupied houses and condos in 2000: 9,307
Renter-occupied apartments: 2,821 (it was 2,472 in 2000)
| % of renters here: | 21% |
| State: | 32% |
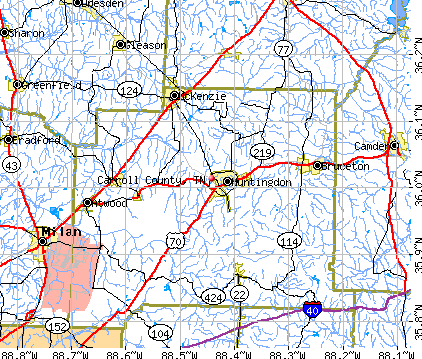
Land area: 599 sq. mi.
Water area: 0.8 sq. mi.
Population density: 48 people per square mile (average).
Industries providing employment: Educational, health and social services (24.6%), Manufacturing (17.6%), Retail trade (13.1%).
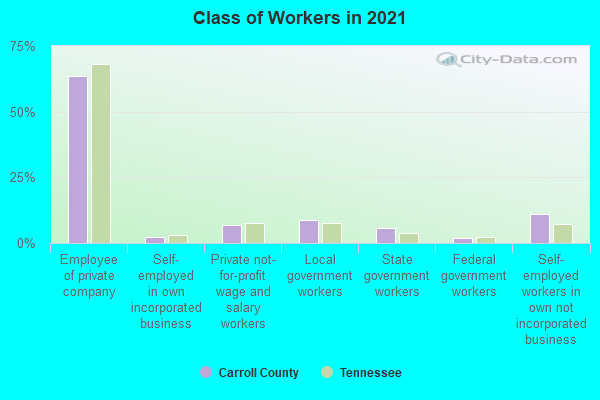
Type of workers:
- Private wage or salary: 74%
- Government: 16%
- Self-employed, not incorporated: 9%
- Unpaid family work: 0%
- OSM Map
- General Map
- Google Map
- MSN Map

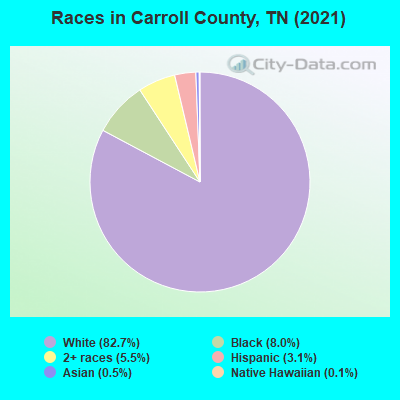
- 24,06183.1%White Non-Hispanic Alone
- 2,4458.4%Black Non-Hispanic Alone
- 1,3814.8%Two or more races
- 9453.3%Hispanic or Latino
- 900.3%Asian alone
- 240.08%American Indian and Alaska Native alone
- 20.01%Some other race alone
| Median resident age: | 42.0 years |
| Tennessee median age: | 39.2 years |
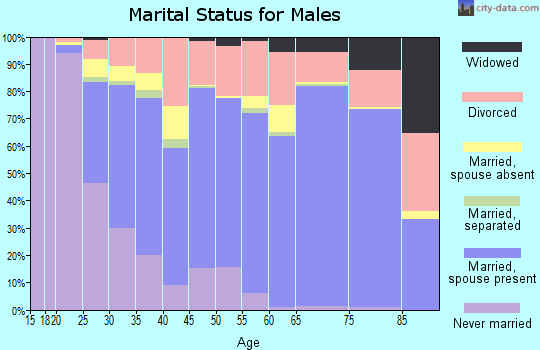
| Males: 14,307 | |
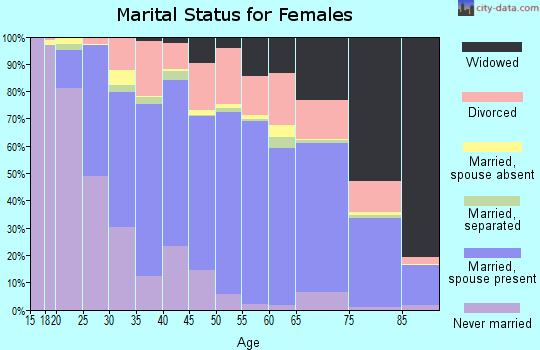
| Females: 14,596 |

 | COVID-19 in Tennessee (237 replies) |
| Tennessee Population Estimates 2016 (28 replies) |
| Information about Carroll County in West TN (6 replies) |
| nice small towns close to Jackson? (10 replies) |
| Top Tennessee High Schools (10 replies) |
| Any gas stations left selling gas without ethanol? (70 replies) |
| Carroll County: | 2.0 people |
| Tennessee: | 2 people |
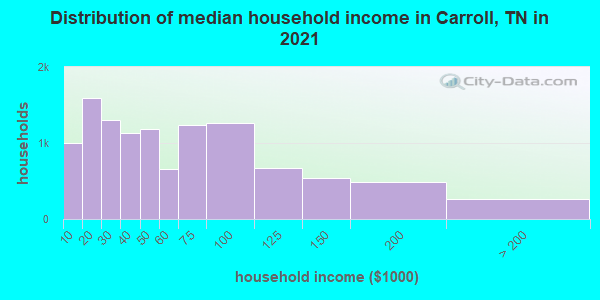
Estimated median household income in 2022: $50,646 ($30,463 in 1999)
| This county: | $50,646 |
| Tennessee: | $65,254 |
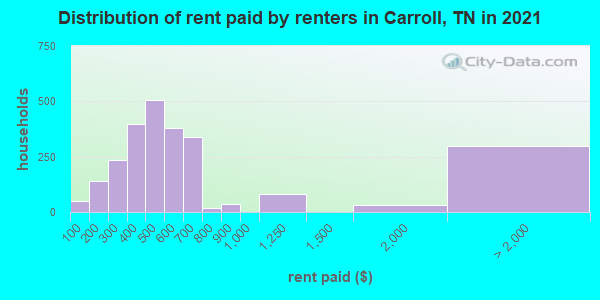
Median contract rent in 2022 for apartments: $528 (lower quartile is $400, upper quartile is $669)
| This county: | $528 |
| State: | $884 |
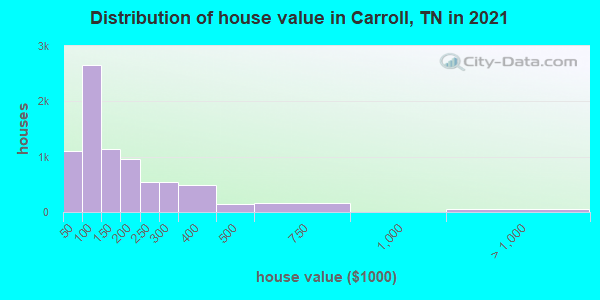
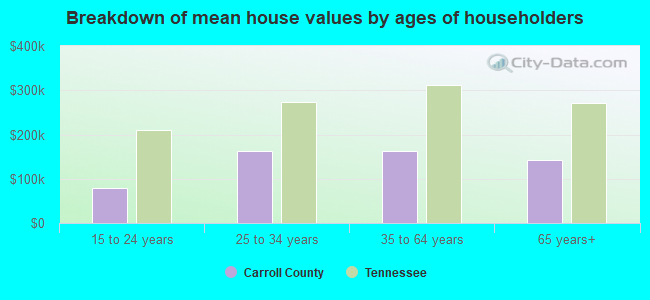
Estimated median house or condo value in 2022: $144,179 (it was $58,300 in 2000)
| Carroll: | $144,179 |
| Tennessee: | $284,800 |
Median monthly housing costs for homes and condos with a mortgage: $1,063
Median monthly housing costs for units without a mortgage: $365
Institutionalized population: 429
Crime in 2021 (reported by the sheriff's office or county police, not the county total):
- Murders: 0
- Rapes: 4
- Robberies: 1
- Assaults: 29
- Burglaries: 35
- Thefts: 77
- Auto thefts: 28
Crime in 2020 (reported by the sheriff's office or county police, not the county total):
- Murders: 2
- Rapes: 5
- Robberies: 1
- Assaults: 22
- Burglaries: 51
- Thefts: 74
- Auto thefts: 13
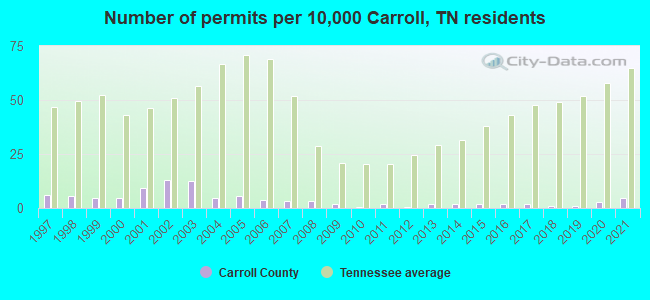
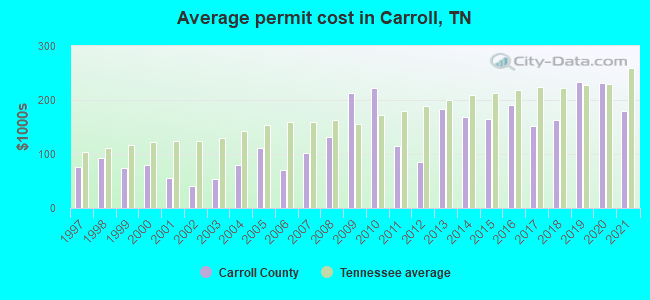
Single-family new house construction building permits:
- 2022: 7 buildings, average cost: $219,300
- 2021: 13 buildings, average cost: $179,900
- 2020: 8 buildings, average cost: $231,800
- 2019: 3 buildings, average cost: $233,000
- 2018: 3 buildings, average cost: $163,300
- 2017: 6 buildings, average cost: $152,300
- 2016: 6 buildings, average cost: $190,800
- 2015: 6 buildings, average cost: $164,500
- 2014: 5 buildings, average cost: $169,000
- 2013: 6 buildings, average cost: $182,800
- 2012: 2 buildings, average cost: $85,300
- 2011: 6 buildings, average cost: $114,100
- 2010: 2 buildings, average cost: $222,500
- 2009: 5 buildings, average cost: $213,400
- 2008: 9 buildings, average cost: $130,600
- 2007: 9 buildings, average cost: $101,700
- 2006: 11 buildings, average cost: $70,500
- 2005: 16 buildings, average cost: $111,000
- 2004: 13 buildings, average cost: $80,400
- 2003: 37 buildings, average cost: $52,500
- 2002: 38 buildings, average cost: $40,600
- 2001: 27 buildings, average cost: $56,100
- 2000: 13 buildings, average cost: $80,000
- 1999: 14 buildings, average cost: $74,600
- 1998: 16 buildings, average cost: $93,100
- 1997: 18 buildings, average cost: $75,800
Median real estate property taxes paid for housing units with mortgages in 2022: $916 (0.5%)
Median real estate property taxes paid for housing units with no mortgage in 2022: $745 (0.6%)
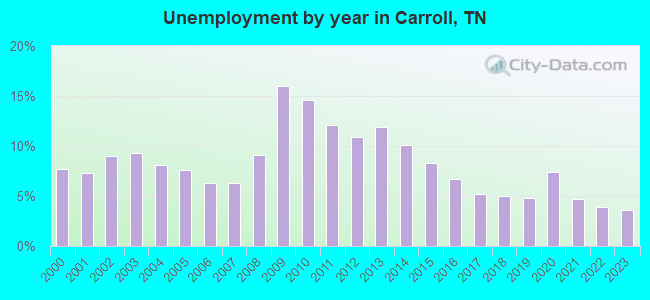
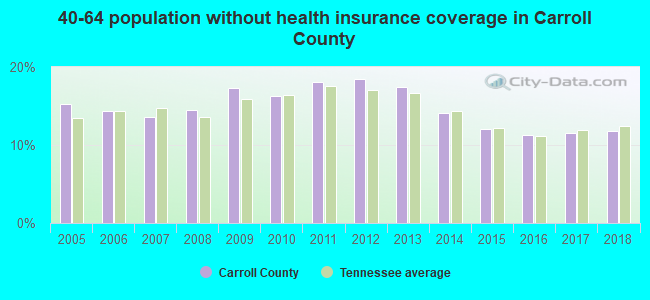
| Carroll County: | 15.6% |
| Tennessee: | 13.3% |
Median age of residents in 2022: 42.0 years old
(Males: 40.3 years old, Females: 44.0 years old)
(Median age for: White residents: 43.9 years old, Black residents: 34.5 years old, American Indian residents: 35.7 years old, Asian residents: 47.8 years old, Hispanic or Latino residents: 20.8 years old, Other race residents: 47.1 years old)
Fair market rent in 2006 for a 1-bedroom apartment in Carroll County is $382 a month.
Fair market rent for a 2-bedroom apartment is $460 a month.
Fair market rent for a 3-bedroom apartment is $567 a month.
Cities in this county include: McKenzie, Huntingdon, Cedar Grove, Bruceton, Atwood, Hollow Rock, Trezevant, Clarksburg, McLemoresville.
Neighboring counties: Carroll County, Arkansas  , Caldwell County, North Carolina
  , Forsyth County, North Carolina , Haywood County, North Carolina , Lauderdale County
  , Oklahoma County, Oklahoma .
| Here: | 3.7% |
| Tennessee: | 3.0% |
Current college students: 1,042
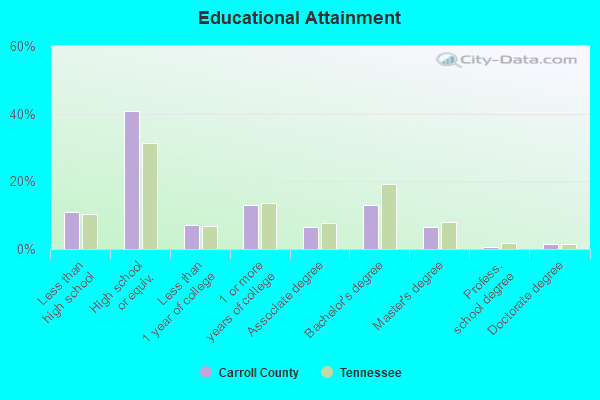
People 25 years of age or older with a high school degree or higher: 88.7%
People 25 years of age or older with a bachelor's degree or higher: 19.8%
Number of foreign born residents: 493 (65.1% naturalized citizens)
| Carroll County: | 1.7% |
| Whole state: | 5.6% |
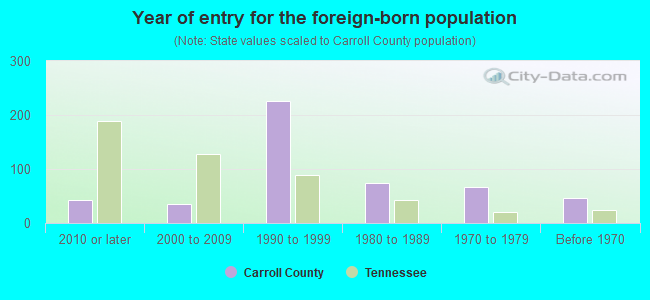
- Year of entry for the foreign-born population
- 992010 or later
- 232000 to 2009
- 2181990 to 1999
- 751980 to 1989
- 671970 to 1979
- 46Before 1970
Mean travel time to work (commute): minutes
Percentage of county residents living and working in this county: 98.7%
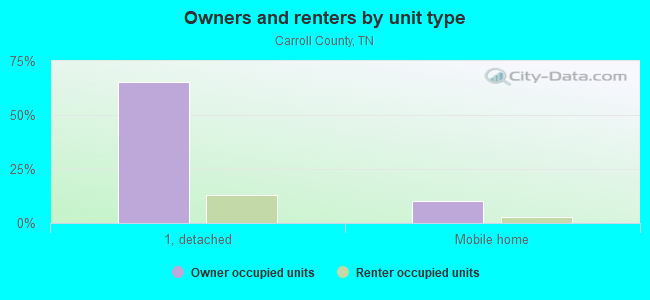
Housing units in structures:
- One, detached: 9,869
- One, attached: 49
- Two: 442
- 3 or 4: 363
- 5 to 9: 314
- 20 to 49: 113
- 50 or more: 56
- Mobile homes: 2,185
Housing units in Carroll County with a mortgage: 3,736 (261 second mortgage, 8 home equity loan, 166 both second mortgage and home equity loan)
Houses without a mortgage: 54
| Here: | 5.3% with mortgage |
| State: | 97.8% with mortgage |
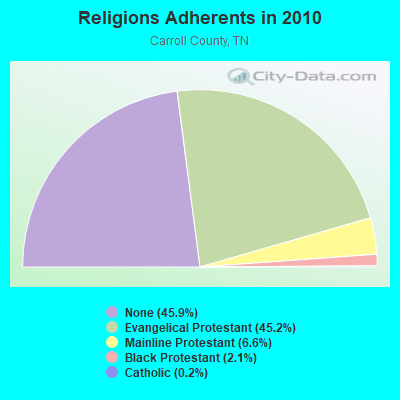
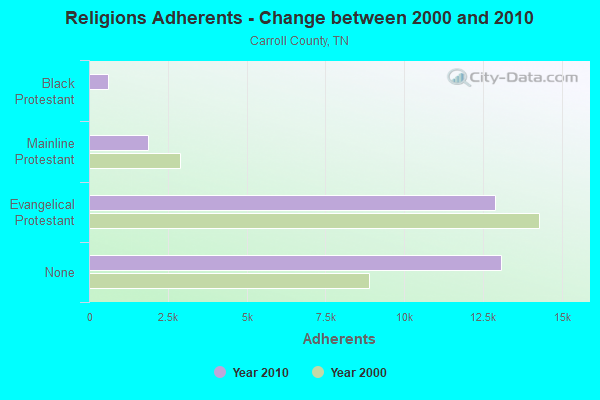
Religion statistics for Carroll County
| Religion | Adherents | Congregations |
|---|---|---|
| Evangelical Protestant | 12,886 | 55 |
| Mainline Protestant | 1,883 | 21 |
| Black Protestant | 601 | 5 |
| Catholic | 69 | 1 |
| Other | 1 | - |
| None | 13,082 | - |
Source: Clifford Grammich, Kirk Hadaway, Richard Houseal, Dale E.Jones, Alexei Krindatch, Richie Stanley and Richard H.Taylor. 2012. 2010 U.S.Religion Census: Religious Congregations & Membership Study. Association of Statisticians of American Religious Bodies. Jones, Dale E., et al. 2002. Congregations and Membership in the United States 2000. Nashville, TN: Glenmary Research Center.
Food Environment Statistics:
| Carroll County: | 2.77 / 10,000 pop. |
| State: | 1.99 / 10,000 pop. |
| Here: | 0.35 / 10,000 pop. |
| Tennessee: | 0.17 / 10,000 pop. |
| Carroll County: | 6.59 / 10,000 pop. |
| Tennessee: | 5.16 / 10,000 pop. |
| This county: | 6.59 / 10,000 pop. |
| State: | 6.56 / 10,000 pop. |
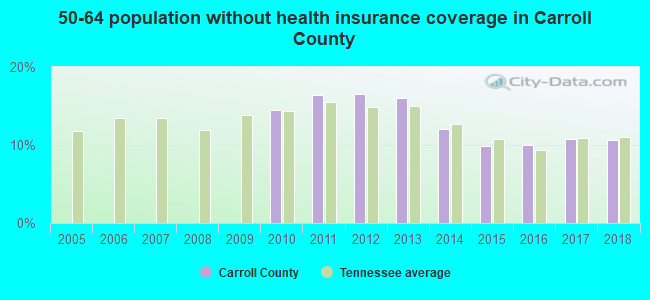
| Carroll County: | 11.9% |
| Tennessee: | 11.4% |
| Carroll County: | 29.0% |
| State: | 30.2% |
| Here: | 11.7% |
| State: | 13.5% |
Agriculture in Carroll County:
Average size of farms: 188 acresAverage value of agricultural products sold per farm: $25,350
Average value of crops sold per acre for harvested cropland: $223.93
The value of nursery, greenhouse, floriculture, and sod as a percentage of the total market value of agricultural products sold: 0.11%
The value of livestock, poultry, and their products as a percentage of the total market value of agricultural products sold: 17.56%
Average total farm production expenses per farm: $22,098
Harvested cropland as a percentage of land in farms: 49.52%
Average market value of all machinery and equipment per farm: $48,781
The percentage of farms operated by a family or individual: 94.24%
Average age of principal farm operators: 57 years
Average number of cattle and calves per 100 acres of all land in farms: 9.01
Milk cows as a percentage of all cattle and calves: 1.40%
Corn for grain: 28905 harvested acres
All wheat for grain: 4191 harvested acres
Upland cotton: 17969 harvested acres
Soybeans for beans: 26260 harvested acres
Land in orchards: 16 acres
Earthquake activity:
Carroll County-area historical earthquake activity is significantly above Tennessee state average. It is 311% greater than the overall U.S. average.On 5/4/1991 at 01:18:54, a magnitude 5.0 (4.4 MB, 4.6 LG, 5.0 LG, Depth: 3.1 mi, Class: Moderate, Intensity: VI - VII) earthquake occurred 85.9 miles away from Carroll County center
On 4/18/2008 at 09:36:59, a magnitude 5.4 (5.1 MB, 4.8 MS, 5.4 MW, 5.2 MW) earthquake occurred 171.5 miles away from the county center
On 9/26/1990 at 13:18:51, a magnitude 5.0 (4.7 MB, 4.8 LG, 5.0 LG, Depth: 7.7 mi) earthquake occurred 100.3 miles away from the county center
On 3/25/1976 at 00:41:20, a magnitude 5.0 (4.9 MB, 5.0 LG) earthquake occurred 108.8 miles away from the county center
On 4/18/2008 at 09:36:59, a magnitude 5.2 (5.2 MW, Depth: 8.9 mi) earthquake occurred 171.4 miles away from Carroll County center
On 4/27/1989 at 16:47:49, a magnitude 4.7 (4.6 MB, 4.7 LG, 4.3 LG, Class: Light, Intensity: IV - V) earthquake occurred 74.1 miles away from the county center
Magnitude types: regional Lg-wave magnitude (LG), body-wave magnitude (MB), surface-wave magnitude (MS), moment magnitude (MW)
Most recent natural disasters:
- Tennessee Severe Storms, Straight-line Winds, And Flooding, Incident Period: May 3, 2020 - May 4, 2020, Major Disaster (Presidential) Declared DR-4550-TN: July 9, 2020, FEMA Id: 4550, Natural disaster type: Storm, Flood, Wind
- Tennessee Severe Storms, Tornadoes, Straight-line Winds, And Flooding, Incident Period: March 3, 2020, FEMA Id: 4476, Natural disaster type: Storm, Tornado, Flood, Wind
- Tennessee Covid-19 Pandemic, Incident Period: January 20, 2020, FEMA Id: 4514, Natural disaster type: Other
- Tennessee Severe Storms, Tornadoes, Straight-line Winds, and Flooding, Incident Period: June 05, 2014 to June 10, 2014, Major Disaster (Presidential) Declared DR-4189: August 13, 2014, FEMA Id: 4189, Natural disaster type: Storm, Tornado, Flood, Wind
- Tennessee Severe Winter Storm, Incident Period: March 02, 2014 to March 04, 2014, Major Disaster (Presidential) Declared DR-4171: April 11, 2014, FEMA Id: 4171, Natural disaster type: Winter Storm
- Tennessee Severe Storms, Tornadoes, Straight-line Winds, and Associated Flooding, Incident Period: April 25, 2011 to April 28, 2011, Major Disaster (Presidential) Declared DR-1974: May 01, 2011, FEMA Id: 1974, Natural disaster type: Storm, Tornado, Flood, Wind
- Tennessee Severe Storms, Flooding, Straight-Line Winds, and Tornadoes, Incident Period: April 30, 2010 to May 18, 2010, Major Disaster (Presidential) Declared DR-1909: May 04, 2010, FEMA Id: 1909, Natural disaster type: Storm, Tornado, Flood, Wind
- Tennessee Severe Storms and Tornadoes, Incident Period: April 02, 2006 to April 08, 2006, Major Disaster (Presidential) Declared DR-1634: April 05, 2006, FEMA Id: 1634, Natural disaster type: Storm, Tornado
- Tennessee Hurricane Katrina Evacuation, Incident Period: August 29, 2005 to October 01, 2005, Emergency Declared EM-3217: September 05, 2005, FEMA Id: 3217, Natural disaster type: Hurricane
- Tennessee Severe Storms, Tornadoes and Flooding, Incident Period: May 04, 2003 to May 30, 2003, Major Disaster (Presidential) Declared DR-1464: May 08, 2003, FEMA Id: 1464, Natural disaster type: Storm, Tornado, Flood
- 7 other natural disasters have been reported since 1953.
The number of natural disasters in Carroll County (17) is near the US average (15).
Major Disasters (Presidential) Declared: 14
Emergencies Declared: 1
Causes of natural disasters: Storms: 12, Floods: 10, Tornadoes: 10, Winds: 6, Winter Storms: 2, Flash Flood: 1, Hurricane: 1, Ice Storm: 1, Other: 1 (Note: some incidents may be assigned to more than one category).
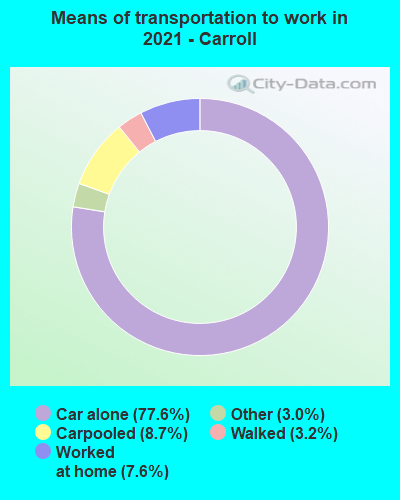
Means of transportation to work:
- Drove a car alone: 6,388 (73.5%)
- Carpooled: 801 (9.2%)
- Taxicab, motorcycle, or other means: 193 (2.2%)
- Walked: 340 (3.9%)
- Worked at home: 937 (10.8%)

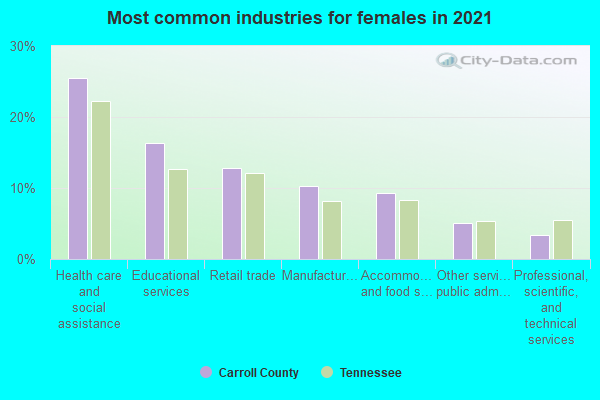
- Health care and social assistance (20%)
- Educational services (14%)
- Manufacturing (9%)
- Retail trade (9%)
- Accommodation and food services (7%)
- Professional, scientific, and technical services (4%)
- Finance and insurance (4%)
- Health care and social assistance (24%)
- Educational services (17%)
- Manufacturing (12%)
- Retail trade (10%)
- Accommodation and food services (9%)
- Professional, scientific, and technical services (5%)
- Finance and insurance (5%)
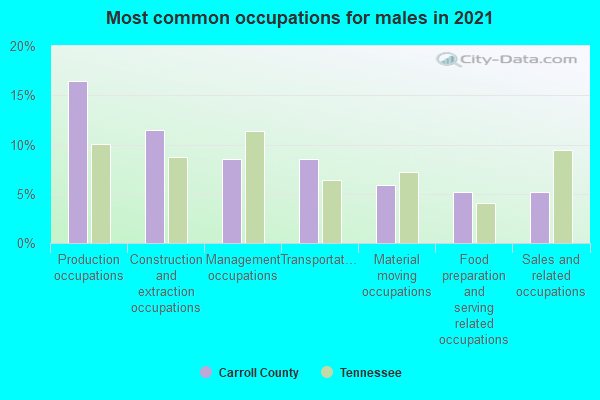
- Production occupations (16%)
- Construction and extraction occupations (10%)
- Installation, maintenance, and repair occupations (10%)
- Transportation occupations (10%)
- Management occupations (9%)
- Material moving occupations (7%)
- Sales and related occupations (6%)
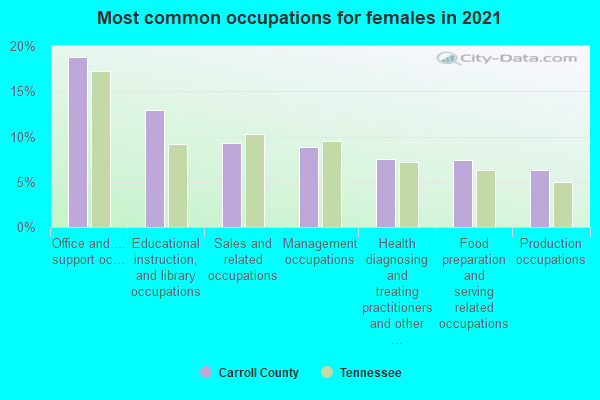
- Office and administrative support occupations (22%)
- Educational instruction, and library occupations (11%)
- Management occupations (9%)
- Sales and related occupations (9%)
- Food preparation and serving related occupations (9%)
- Health diagnosing and treating practitioners and other technical occupations (7%)
- Production occupations (7%)
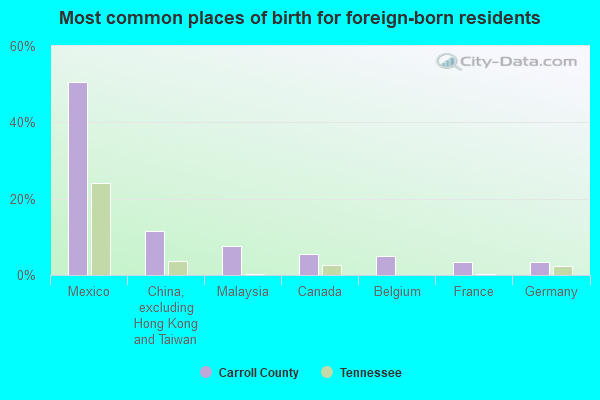
- Mexico (50%)
- Germany (11%)
- Malaysia (6%)
- China, excluding Hong Kong and Taiwan (6%)
- Canada (4%)
- Belgium (4%)
- Other Australian and New Zealand Subregion (2%)
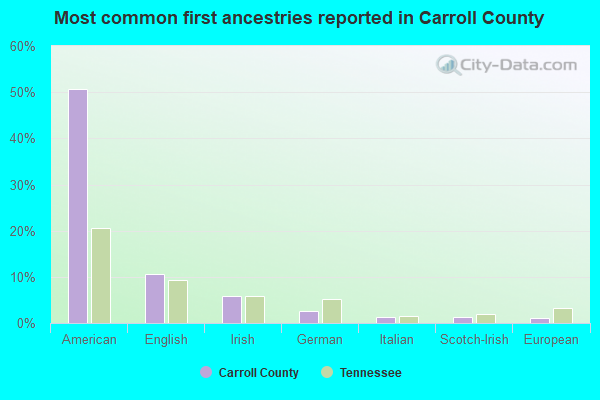
- American (54%)
- English (11%)
- Irish (4%)
- German (2%)
- Scotch-Irish (1%)
- European (1%)
- Italian (1%)
People in group quarters in Carroll County, Tennessee in 2010:
- 512 people in college/university student housing
- 330 people in nursing facilities/skilled-nursing facilities
- 99 people in local jails and other municipal confinement facilities
- 25 people in group homes intended for adults
- 8 people in residential treatment centers for adults
People in group quarters in Carroll County, Tennessee in 2000:
- 446 people in nursing homes
- 233 people in college dormitories (includes college quarters off campus)
- 73 people in local jails and other confinement facilities (including police lockups)
- 70 people in other noninstitutional group quarters
- 46 people in other group homes
- 23 people in homes for the mentally retarded
- 13 people in agriculture workers' dormitories on farms
- 12 people in homes for the mentally ill
- 3 people in religious group quarters
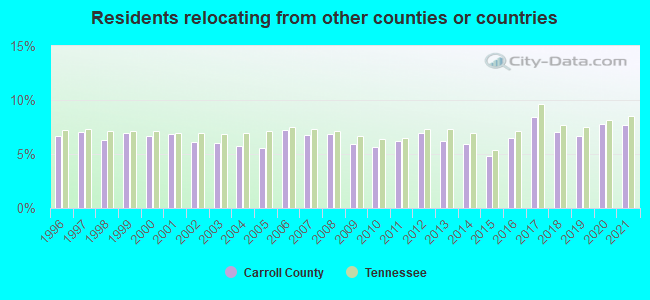
7.65% of this county's 2021 resident taxpayers lived in other counties in 2020 ($45,859 average adjusted gross income)
| Here: | 7.65% |
| Tennessee average: | 8.49% |
10 or fewer of this county's residents moved from foreign countries.
5.05% relocated from other counties in Tennessee ($26,412 average AGI)
2.60% relocated from other states ($19,447 average AGI)
Carroll County: 2.60% Tennessee average: 4.34%
Top counties from which taxpayers relocated into this county between 2020 and 2021:
| from Henry County, TN | |
| from Weakley County, TN | |
| from Gibson County, TN | |
| from Madison County, TN | |
| from Benton County, TN | |
| from Henderson County, TN |
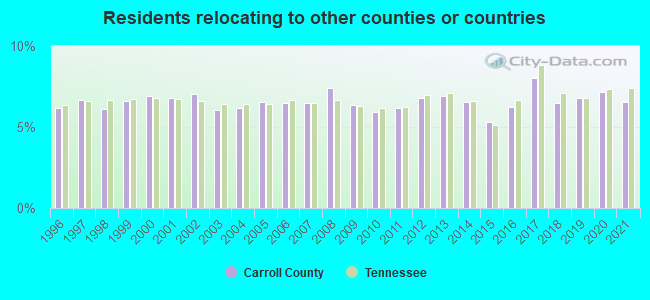
6.56% of this county's 2020 resident taxpayers moved to other counties in 2021 ($35,903 average adjusted gross income)
| Here: | 6.56% |
| Tennessee average: | 7.40% |
10 or fewer of this county's residents moved to foreign countries.
5.20% relocated to other counties in Tennessee ($28,698 average AGI)
1.36% relocated to other states ($7,206 average AGI)
Carroll County: 1.36% Tennessee average: 3.20%
Top counties to which taxpayers relocated from this county between 2020 and 2021:
| to Henry County, TN | |
| to Gibson County, TN | |
| to Weakley County, TN | |
| to Madison County, TN | |
| to Benton County, TN | |
| to Henderson County, TN |
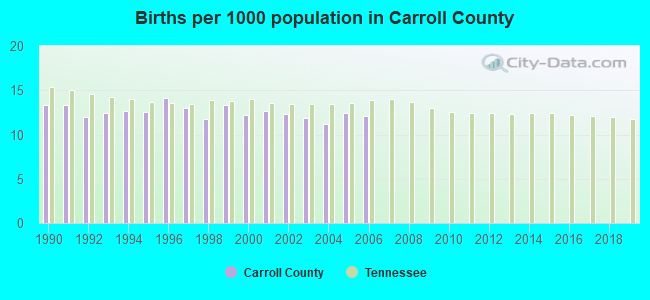
Births per 1000 population from 1990 to 1999: 12.8
Births per 1000 population from 2000 to 2006: 12.1
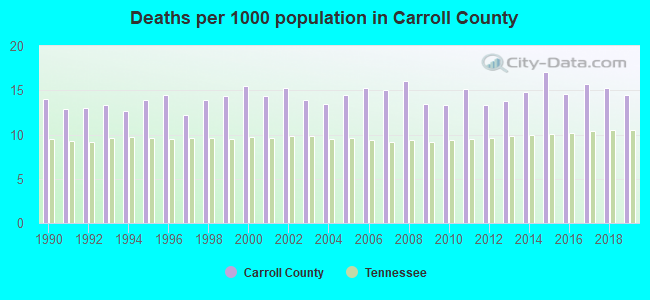
Deaths per 1000 population from 1990 to 1999: 13.5
Deaths per 1000 population from 2000 to 2009: 14.7
Deaths per 1000 population from 2010 to 2020: 15.1
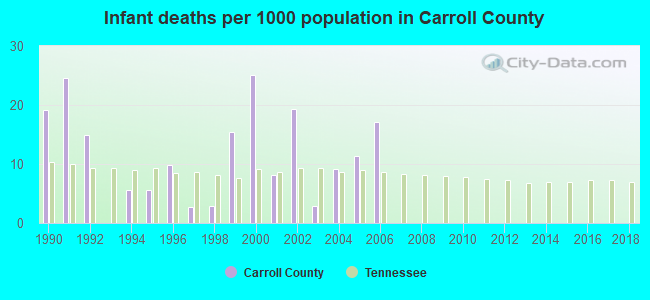
Infant deaths per 1000 live births from 1990 to 1999: 10.1
Infant deaths per 1000 live births from 2000 to 2006: 13.3
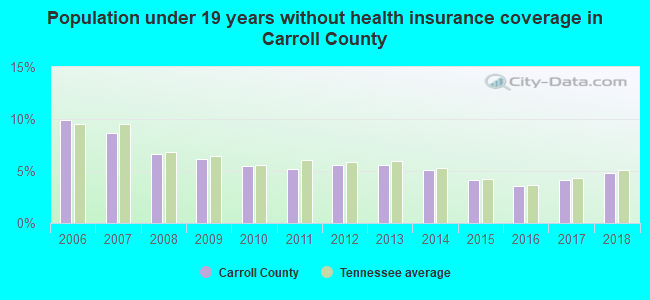
Persons under 19 years old without health insurance coverage in 2018: 4.8%
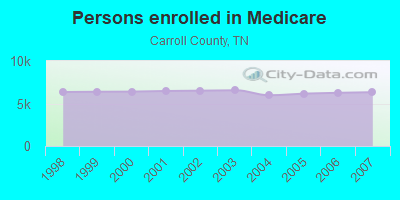
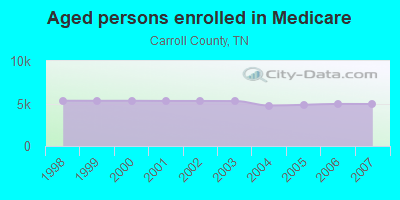
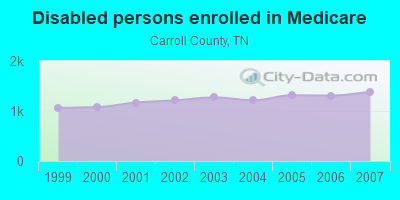
Persons enrolled in hospital insurance and/or supplemental medical insurance (Medicare) in July 1, 2007: 6,329 (4,939 aged, 1,390 disabled)
Children under 18 without health insurance coverage in 2007: 665 (10%)
Most common underlying causes of death in Carroll County, Tennessee in 1999 - 2019:
- Acute myocardial infarction, unspecified (1,524)
- Bronchus or lung, unspecified - Malignant neoplasms (627)
- Atherosclerotic heart disease (544)
- Alzheimer disease, unspecified (384)
- Stroke, not specified as haemorrhage or infarction (289)
- Chronic obstructive pulmonary disease, unspecified (253)
- Pneumonia, unspecified (122)
- Hypertensive heart disease with (congestive) heart failure (91)
- Colon, unspecified - Malignant neoplasms (57)
- Chronic ischaemic heart disease, unspecified (25)
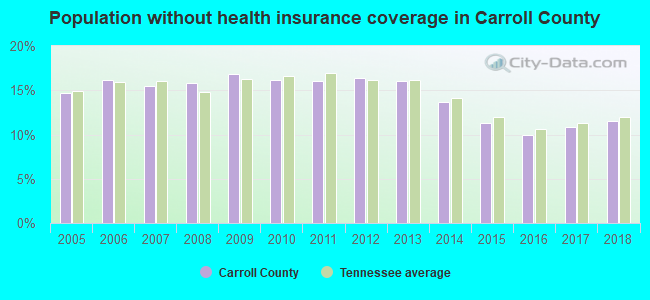
Population without health insurance coverage in 2000: 13%
Children under 18 without health insurance coverage in 2000: 8%
Short term general hospital admissions per 100,000 population in 2004: 11,337
Short term general hospital beds per 100,000 population in 2004: 201
Emergency room visits per 100,000 population in 2004: 39,610
General practice office based MDs per 100,000 population in 2005: 1,157
Medical specialist MDs per 100,000 population in 2005: 1,398
Total births per 100,000 population, July 2005 - July 2006 : 27
Total deaths per 100,000 population, July 2005 - July 2006: 52
Limited-service eating places per 100,000 population in 2005 : 3
Suicides per 1,000,000 population from 2000 to 2006: 147.1. This is more than state average.
Household type by relationship:
Households: 28,903- Male householders: 5,497 (1,489 living alone), Female householders: 6,083 (1,879 living alone)
5,938 spouses (5,892 opposite-sex spouses), 866 unmarried partners, (814 opposite-sex unmarried partners), 7,609 children (6,841 natural, 284 adopted, 477 stepchildren), 813 grandchildren, 241 brothers or sisters, 165 parents, 9 foster children, 365 other relatives, 395 non-relatives
- In group quarters: 1,023
Size of family households: 3,485 2-persons, 1,959 3-persons, 1,534 4-persons, 659 5-persons, 100 6-persons, 52 7-or-more-persons.
Size of nonfamily households: 3,371 1-person, 381 2-persons, 18 3-persons.
3,614 married couples with children.
1,830 single-parent households (523 men, 1,307 women).
97.1% of residents of Carroll speak English at home.
2.3% of residents speak Spanish at home (86% speak English very well, 9% speak English well, 6% speak English not well).
0.2% of residents speak other Indo-European language at home (100% speak English very well).
0.2% of residents speak Asian or Pacific Island language at home (67% speak English very well, 33% speak English not well).
0.1% of residents speak other language at home (47% speak English very well, 53% speak English well).
In fiscal year 2004:
Federal Government expenditure: $309,990,000 ($10,557 per capita)
Department of Defense expenditure: $97,915,000
Federal direct payments to individuals for retirement and disability: $94,209,000
Federal other direct payments to individuals: $53,930,000
Federal direct payments not to individuals: $4,279,000
Federal grants: $58,067,000
Federal procurement contracts: $92,013,000 ($90,415,000 Department of Defense)
Federal salaries and wages: $7,493,000 ($3,338,000 Department of Defense)
Federal Government direct loans: $7,736,000
Federal guaranteed/insured loans: $4,787,000
Federal Government insurance: $13,728,000
Population change from April 1, 2000 to July 1, 2005:
Births: 1,875| Here: | 64 per 1000 residents |
| State: | 69 per 1000 residents |
Deaths: 2,251
| Here: | 77 per 1000 residents |
| State: | 50 per 1000 residents |
Net international migration: +50
| Here: | +2 per 1000 residents |
| State: | +8 per 1000 residents |
Net internal migration: +3
| Here: | +0 per 1000 residents |
| State: | +18 per 1000 residents |
Total withdrawal of fresh water for public supply: 2.81 millions of gallons per day (all from ground)
| Here: | 6.2 |
| State: | 6.5 |
| Here: | 4.6 |
| State: | 4.4 |
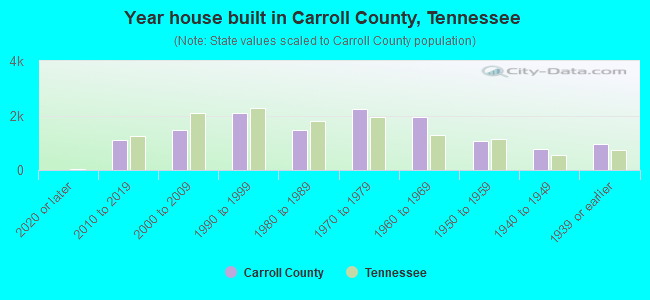
- Year house built in Carroll County, Tennessee
- 402020 or later
- 1,0352010 to 2019
- 1,5712000 to 2009
- 2,0191990 to 1999
- 1,3191980 to 1989
- 2,1181970 to 1979
- 1,9451960 to 1969
- 1,0381950 to 1959
- 9431940 to 1949
- 1,0071939 or earlier
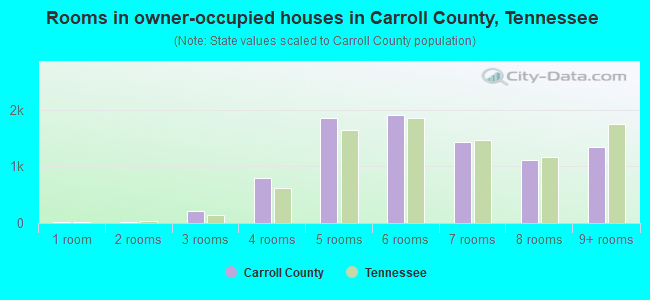
- Rooms in owner-occupied houses in Carroll County, Tennessee
- 41 room
- 192 rooms
- 2203 rooms
- 8884 rooms
- 1,6955 rooms
- 1,9996 rooms
- 1,5457 rooms
- 9828 rooms
- 1,3039+ rooms
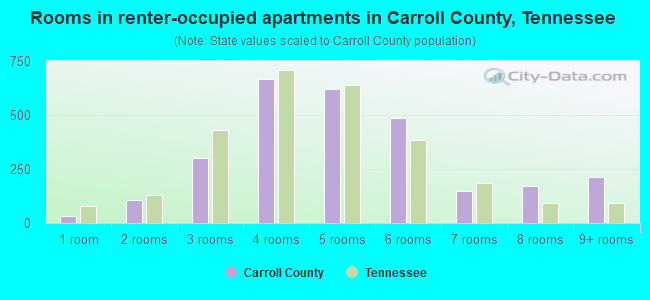
- Rooms in renter-occupied apartments in Carroll County, Tennessee
- 501 room
- 702 rooms
- 2713 rooms
- 9944 rooms
- 4805 rooms
- 5106 rooms
- 2387 rooms
- 1268 rooms
- 1879+ rooms
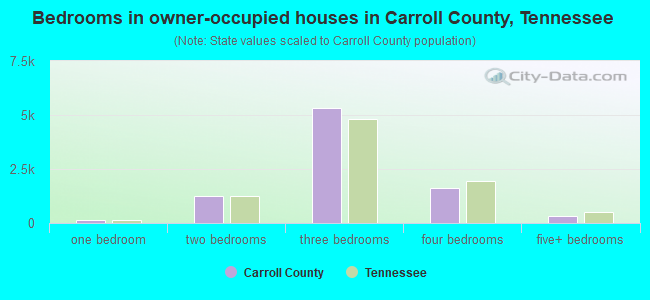
- Bedrooms in owner-occupied houses in Carroll County, Tennessee
- 16no bedroom
- 1251 bedroom
- 1,2032 bedrooms
- 5,3473 bedrooms
- 1,5934 bedrooms
- 3495+ bedrooms
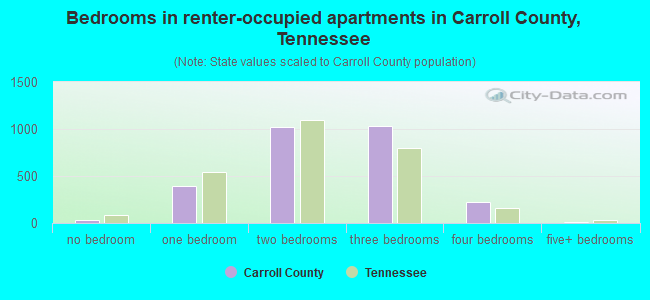
- Bedrooms in renter-occupied apartments in Carroll County, Tennessee
- 52no bedroom
- 2881 bedroom
- 1,3032 bedrooms
- 1,0473 bedrooms
- 2204 bedrooms
- 85+ bedrooms
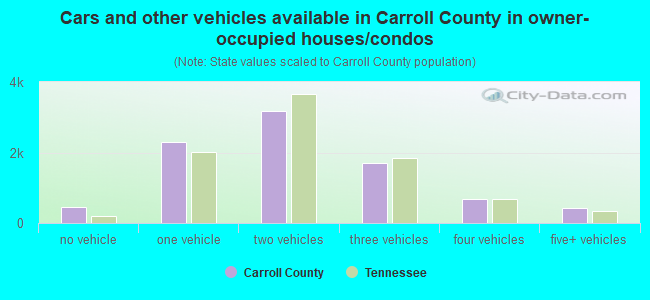
- Cars and other vehicles available in Carroll County in owner-occupied houses/condos
- 351no vehicle
- 2,1131 vehicle
- 3,0042 vehicles
- 1,8693 vehicles
- 8334 vehicles
- 4615+ vehicles
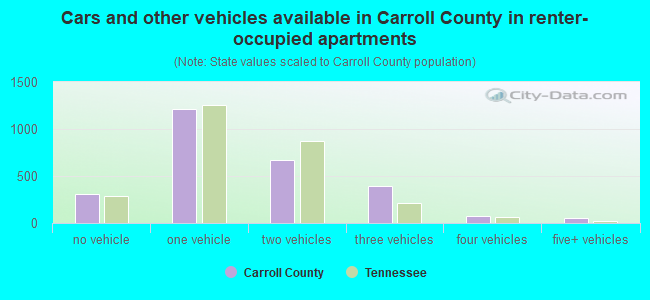
- Cars and other vehicles available in Carroll County in renter-occupied apartments
- 391no vehicle
- 1,1301 vehicle
- 7982 vehicles
- 5003 vehicles
- 784 vehicles
- 405+ vehicles
88.7% of Carroll County residents lived in the same house 1 years ago.
Out of people who lived in different houses, 28% lived in this county.
Out of people who lived in different counties, 74% lived in Tennessee.
| Carroll County: | 88.7% |
| State average: | 87.0% |
Place of birth for U.S.-born residents:
- This state: 20,123
- Other state: 7,720
- Northeast: 741
- Midwest: 2,791
- South: 3,170
- West: 1,000
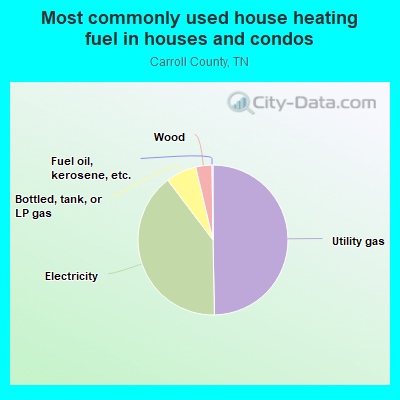
- 50.2%Utility gas
- 40.1%Electricity
- 6.2%Bottled, tank, or LP gas
- 2.8%Wood
- 0.4%Fuel oil, kerosene, etc.
- 0.3%Solar energy
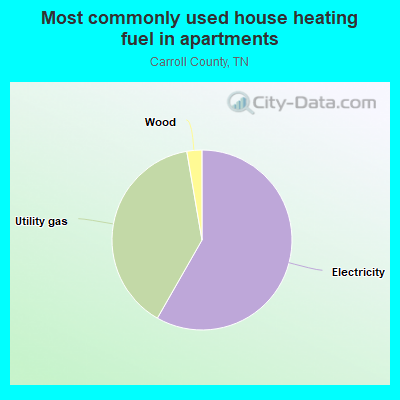
- 63.5%Electricity
- 34.8%Utility gas
- 1.7%Wood
Private vs. public school enrollment:
| Here: | 1.3% |
| Tennessee: | 15.0% |
| Here: | 14.1% |
| Tennessee: | 16.2% |
| Here: | 47.0% |
| Tennessee: | 23.5% |
Carroll County government finances - Expenditure in 2018:
- Charges - Other: $2,808,000
Solid Waste Management: $1,321,000
Elementary and Secondary Education - Other: $85,000
Regular Highways: $9,000
Elementary and Secondary Education School Lunch: $2,000
- Construction - Regular Highways: $2,140,000
Electric Utilities: $1,109,000
Elementary and Secondary Education: $36,000
- Current Operations - Electric Utilities: $36,605,000
Elementary and Secondary Education: $3,732,000
Correctional Institutions: $2,476,000
Regular Highways: $2,069,000
Police Protection: $2,042,000
Judicial and Legal Services: $1,802,000
Solid Waste Management: $1,577,000
General Public Buildings: $970,000
General - Other: $848,000
Central Staff Services: $756,000
Air Transportation: $643,000
Parks and Recreation: $377,000
Financial Administration: $356,000
Local Fire Protection: $336,000
Health - Other: $268,000
Public Welfare - Other: $135,000
Libraries: $100,000
Natural Resources - Other: $95,000
- Electric Utilities - Interest on Debt: $1,000
- Federal Intergovernmental - Other: $606,000
- General - Interest on Debt: $187,000
- Intergovernmental to Local - Other - General - Other: $49,000
- Local Intergovernmental - Education: $761,000
Other: $266,000
- Long Term Debt - Beginning Outstanding - Unspecified Public Purpose: $8,805,000
Outstanding Unspecified Public Purpose: $8,280,000
Retired Unspecified Public Purpose: $525,000
- Miscellaneous - General Revenue - Other: $368,000
Fines and Forfeits: $263,000
Interest Earnings: $172,000
Rents: $53,000
Donations From Private Sources: $17,000
Sale of Property: $6,000
- Other Capital Outlay - Elementary and Secondary Education: $458,000
Judicial and Legal Services: $1,000
- Other Funds - Cash and Securities: $14,702,000
- Revenue - Electric Utilities: $38,234,000
- Sinking Funds - Cash and Securities: $1,457,000
- State Intergovernmental - Highways: $3,173,000
Education: $3,020,000
Other: $2,206,000
General Local Government Support: $150,000
- Tax - Property: $5,755,000
Motor Vehicle License: $1,297,000
General Sales and Gross Receipts: $391,000
Other Selective Sales: $240,000
Alcoholic Beverage Sales: $63,000
Severance: $46,000
Other License: $1,000
Alcoholic Beverage License: $1,000
- Total Salaries and Wages: $3,419,000
Carroll County government finances - Revenue in 2018:
- Charges - Other: $2,808,000
Solid Waste Management: $1,321,000
Elementary and Secondary Education - Other: $85,000
Regular Highways: $9,000
Elementary and Secondary Education School Lunch: $2,000
- Construction - Regular Highways: $2,140,000
Electric Utilities: $1,109,000
Elementary and Secondary Education: $36,000
- Current Operations - Electric Utilities: $36,605,000
Elementary and Secondary Education: $3,732,000
Correctional Institutions: $2,476,000
Regular Highways: $2,069,000
Police Protection: $2,042,000
Judicial and Legal Services: $1,802,000
Solid Waste Management: $1,577,000
General Public Buildings: $970,000
General - Other: $848,000
Central Staff Services: $756,000
Air Transportation: $643,000
Parks and Recreation: $377,000
Financial Administration: $356,000
Local Fire Protection: $336,000
Health - Other: $268,000
Public Welfare - Other: $135,000
Libraries: $100,000
Natural Resources - Other: $95,000
- Electric Utilities - Interest on Debt: $1,000
- Federal Intergovernmental - Other: $606,000
- General - Interest on Debt: $187,000
- Intergovernmental to Local - Other - General - Other: $49,000
- Local Intergovernmental - Education: $761,000
Other: $266,000
- Long Term Debt - Beginning Outstanding - Unspecified Public Purpose: $8,805,000
Outstanding Unspecified Public Purpose: $8,280,000
Retired Unspecified Public Purpose: $525,000
- Miscellaneous - General Revenue - Other: $368,000
Fines and Forfeits: $263,000
Interest Earnings: $172,000
Rents: $53,000
Donations From Private Sources: $17,000
Sale of Property: $6,000
- Other Capital Outlay - Elementary and Secondary Education: $458,000
Judicial and Legal Services: $1,000
- Other Funds - Cash and Securities: $14,702,000
- Revenue - Electric Utilities: $38,234,000
- Sinking Funds - Cash and Securities: $1,457,000
- State Intergovernmental - Highways: $3,173,000
Education: $3,020,000
Other: $2,206,000
General Local Government Support: $150,000
- Tax - Property: $5,755,000
Motor Vehicle License: $1,297,000
General Sales and Gross Receipts: $391,000
Other Selective Sales: $240,000
Alcoholic Beverage Sales: $63,000
Severance: $46,000
Other License: $1,000
Alcoholic Beverage License: $1,000
- Total Salaries and Wages: $3,419,000
Carroll County government finances - Debt in 2018:
- Charges - Other: $2,808,000
Solid Waste Management: $1,321,000
Elementary and Secondary Education - Other: $85,000
Regular Highways: $9,000
Elementary and Secondary Education School Lunch: $2,000
- Construction - Regular Highways: $2,140,000
Electric Utilities: $1,109,000
Elementary and Secondary Education: $36,000
- Current Operations - Electric Utilities: $36,605,000
Elementary and Secondary Education: $3,732,000
Correctional Institutions: $2,476,000
Regular Highways: $2,069,000
Police Protection: $2,042,000
Judicial and Legal Services: $1,802,000
Solid Waste Management: $1,577,000
General Public Buildings: $970,000
General - Other: $848,000
Central Staff Services: $756,000
Air Transportation: $643,000
Parks and Recreation: $377,000
Financial Administration: $356,000
Local Fire Protection: $336,000
Health - Other: $268,000
Public Welfare - Other: $135,000
Libraries: $100,000
Natural Resources - Other: $95,000
- Electric Utilities - Interest on Debt: $1,000
- Federal Intergovernmental - Other: $606,000
- General - Interest on Debt: $187,000
- Intergovernmental to Local - Other - General - Other: $49,000
- Local Intergovernmental - Education: $761,000
Other: $266,000
- Long Term Debt - Beginning Outstanding - Unspecified Public Purpose: $8,805,000
Outstanding Unspecified Public Purpose: $8,280,000
Retired Unspecified Public Purpose: $525,000
- Miscellaneous - General Revenue - Other: $368,000
Fines and Forfeits: $263,000
Interest Earnings: $172,000
Rents: $53,000
Donations From Private Sources: $17,000
Sale of Property: $6,000
- Other Capital Outlay - Elementary and Secondary Education: $458,000
Judicial and Legal Services: $1,000
- Other Funds - Cash and Securities: $14,702,000
- Revenue - Electric Utilities: $38,234,000
- Sinking Funds - Cash and Securities: $1,457,000
- State Intergovernmental - Highways: $3,173,000
Education: $3,020,000
Other: $2,206,000
General Local Government Support: $150,000
- Tax - Property: $5,755,000
Motor Vehicle License: $1,297,000
General Sales and Gross Receipts: $391,000
Other Selective Sales: $240,000
Alcoholic Beverage Sales: $63,000
Severance: $46,000
Other License: $1,000
Alcoholic Beverage License: $1,000
- Total Salaries and Wages: $3,419,000
Carroll County government finances - Cash and Securities in 2018:
- Charges - Other: $2,808,000
Solid Waste Management: $1,321,000
Elementary and Secondary Education - Other: $85,000
Regular Highways: $9,000
Elementary and Secondary Education School Lunch: $2,000
- Construction - Regular Highways: $2,140,000
Electric Utilities: $1,109,000
Elementary and Secondary Education: $36,000
- Current Operations - Electric Utilities: $36,605,000
Elementary and Secondary Education: $3,732,000
Correctional Institutions: $2,476,000
Regular Highways: $2,069,000
Police Protection: $2,042,000
Judicial and Legal Services: $1,802,000
Solid Waste Management: $1,577,000
General Public Buildings: $970,000
General - Other: $848,000
Central Staff Services: $756,000
Air Transportation: $643,000
Parks and Recreation: $377,000
Financial Administration: $356,000
Local Fire Protection: $336,000
Health - Other: $268,000
Public Welfare - Other: $135,000
Libraries: $100,000
Natural Resources - Other: $95,000
- Electric Utilities - Interest on Debt: $1,000
- Federal Intergovernmental - Other: $606,000
- General - Interest on Debt: $187,000
- Intergovernmental to Local - Other - General - Other: $49,000
- Local Intergovernmental - Education: $761,000
Other: $266,000
- Long Term Debt - Beginning Outstanding - Unspecified Public Purpose: $8,805,000
Outstanding Unspecified Public Purpose: $8,280,000
Retired Unspecified Public Purpose: $525,000
- Miscellaneous - General Revenue - Other: $368,000
Fines and Forfeits: $263,000
Interest Earnings: $172,000
Rents: $53,000
Donations From Private Sources: $17,000
Sale of Property: $6,000
- Other Capital Outlay - Elementary and Secondary Education: $458,000
Judicial and Legal Services: $1,000
- Other Funds - Cash and Securities: $14,702,000
- Revenue - Electric Utilities: $38,234,000
- Sinking Funds - Cash and Securities: $1,457,000
- State Intergovernmental - Highways: $3,173,000
Education: $3,020,000
Other: $2,206,000
General Local Government Support: $150,000
- Tax - Property: $5,755,000
Motor Vehicle License: $1,297,000
General Sales and Gross Receipts: $391,000
Other Selective Sales: $240,000
Alcoholic Beverage Sales: $63,000
Severance: $46,000
Other License: $1,000
Alcoholic Beverage License: $1,000
- Total Salaries and Wages: $3,419,000
Supplemental Security Income (SSI) in 2006:
- Total number of recipients: 795
- Number of aged recipients: 86
- Number of blind and disabled recipients: 709
- Number of recipients under 18: 83
- Number of recipients between 18 and 64: 503
- Number of recipients older than 64: 209
- Number of recipients also receiving OASDI: 390
- Amount of payments (thousands of dollars): 351
| Most common first names in Carroll County, TN among deceased individuals | ||
| Name | Count | Lived (average) |
|---|---|---|
| James | 441 | 72.9 years |
| William | 325 | 73.9 years |
| Mary | 312 | 78.2 years |
| John | 268 | 74.8 years |
| Robert | 177 | 73.0 years |
| Thomas | 123 | 72.7 years |
| Willie | 116 | 77.1 years |
| Charles | 107 | 69.0 years |
| George | 103 | 76.1 years |
| Joe | 86 | 72.2 years |
| Most common last names in Carroll County, TN among deceased individuals | ||
| Last name | Count | Lived (average) |
|---|---|---|
| Smith | 176 | 76.4 years |
| Williams | 163 | 76.2 years |
| Taylor | 95 | 75.8 years |
| Johnson | 90 | 77.4 years |
| Jones | 88 | 78.4 years |
| Wilson | 77 | 74.5 years |
| Moore | 77 | 75.8 years |
| Scott | 76 | 76.1 years |
| Arnold | 71 | 76.4 years |
| Allen | 70 | 73.4 years |
| Businesses in Carroll County, TN | ||||
| Name | Count | Name | Count | |
|---|---|---|---|---|
| Advance Auto Parts | 1 | McDonald's | 2 | |
| AutoZone | 1 | Pizza Hut | 1 | |
| Baskin-Robbins | 1 | RadioShack | 1 | |
| Best Western | 1 | Rite Aid | 1 | |
| Dairy Queen | 1 | SONIC Drive-In | 2 | |
| Domino's Pizza | 1 | Subway | 2 | |
| FedEx | 2 | True Value | 1 | |
| Ford | 1 | U-Haul | 2 | |
| H&R Block | 2 | UPS | 1 | |
| Kincaid | 1 | Walmart | 1 | |
| La-Z-Boy | 1 | Wendy's | 1 | |
| Lane Furniture | 1 | |||