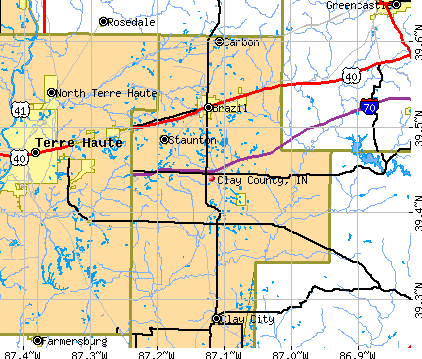
Clay County, Indiana (IN)
County owner-occupied free and clear houses and condos in 2010: 2,693
County owner-occupied houses and condos in 2000: 8,077
Renter-occupied apartments: 2,549 (it was 2,139 in 2000)
| % of renters here: | 21% |
| State: | 30% |
Land area: 358 sq. mi.
Water area: 2.8 sq. mi.
Population density: 74 people per square mile (average).
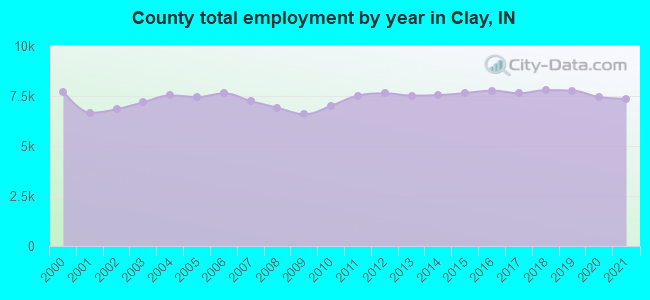
Industries providing employment: Educational, health and social services (25.4%), Manufacturing (24.0%).
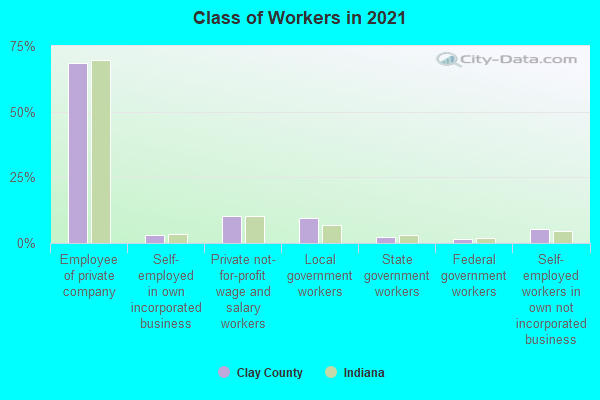
Type of workers:
- Private wage or salary: 81%
- Government: 14%
- Self-employed, not incorporated: 5%
- Unpaid family work: 0%
- OSM Map
- General Map
- Google Map
- MSN Map

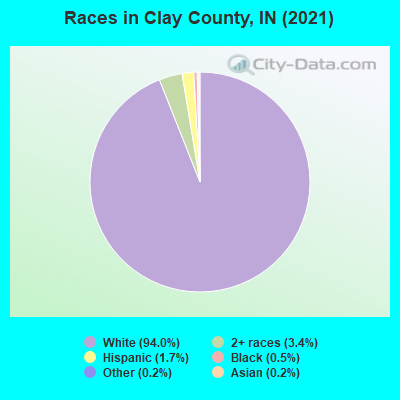
- 24,73893.6%White Non-Hispanic Alone
- 9793.7%Two or more races
- 4851.8%Hispanic or Latino
- 990.4%Black Non-Hispanic Alone
- 560.2%Asian alone
- 560.2%Some other race alone
- 200.08%Native Hawaiian and Other
Pacific Islander alone
| Median resident age: | 41.3 years |
| Indiana median age: | 38.2 years |
| Males: 13,230 | |
| Females: 13,355 |

 | very small towns around indianapolis... (16 replies) |
| Where does Southern Indiana REALLY begin? (73 replies) |
| Share your Indiana photos here! (572 replies) |
| HoJo Gospel House / Brazil, IN (3 replies) |
| Clay County: | 2.0 people |
| Indiana: | 3 people |
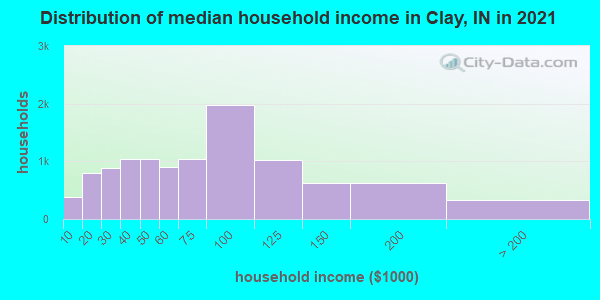
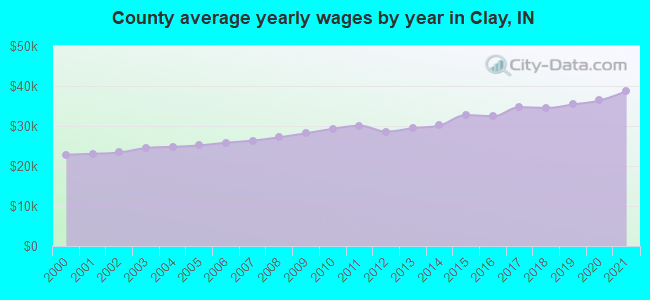
Estimated median household income in 2022: $67,969 ($36,865 in 1999)
| This county: | $67,969 |
| Indiana: | $66,785 |
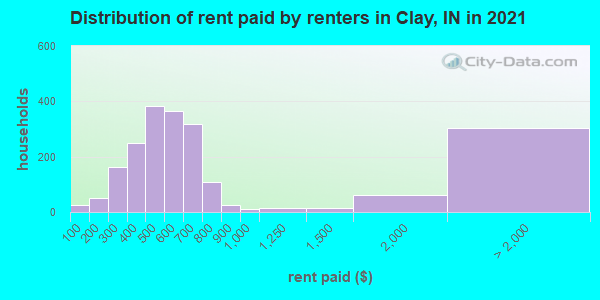
Median contract rent in 2022 for apartments: $548 (lower quartile is $430, upper quartile is $729)
| This county: | $548 |
| State: | $780 |
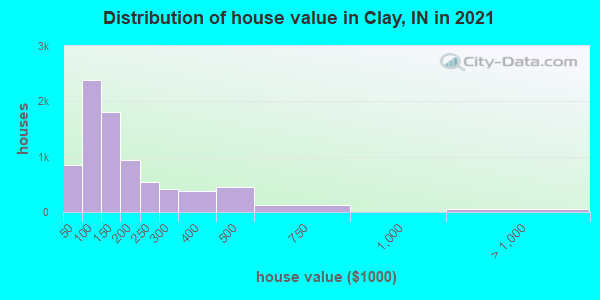
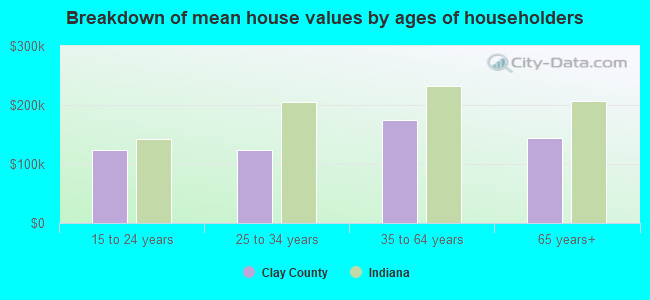
Estimated median house or condo value in 2022: $147,772 (it was $71,900 in 2000)
| Clay: | $147,772 |
| Indiana: | $208,700 |
Mean price in 2022:
Median monthly housing costs for homes and condos with a mortgage: $1,098Detached houses: $176,612
Here: $176,612 State: $257,916 Townhouses or other attached units: $169,922
Here: $169,922 State: $224,114 Mobile homes: $37,070
Here: $37,070 State: $67,116
Median monthly housing costs for units without a mortgage: $435
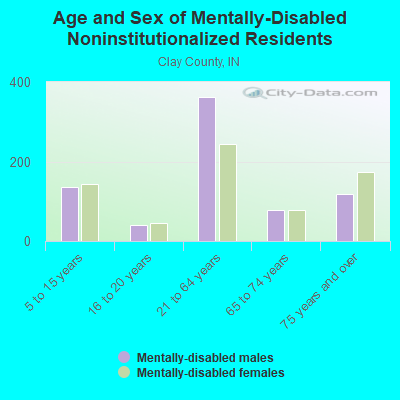
Institutionalized population: 278
Crime in 2008 (reported by the sheriff's office or county police, not the county total):
- Murders: 0
- Rapes: 1
- Robberies: 1
- Assaults: 36
- Burglaries: 69
- Thefts: 83
- Auto thefts: 34
Crime in 2007 (reported by the sheriff's office or county police, not the county total):
- Murders: 0
- Rapes: 2
- Robberies: 0
- Assaults: 55
- Burglaries: 93
- Thefts: 189
- Auto thefts: 45

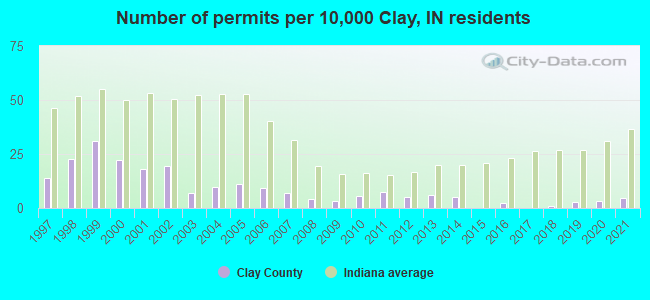
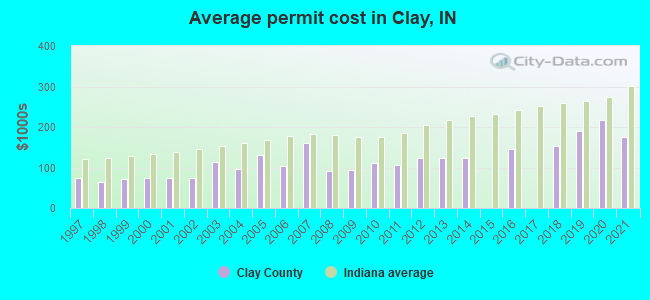
Single-family new house construction building permits:
- 2022: 14 buildings, average cost: $163,000
- 2021: 12 buildings, average cost: $176,300
- 2020: 9 buildings, average cost: $217,300
- 2019: 7 buildings, average cost: $188,600
- 2018: 2 buildings, average cost: $152,500
- 2017: 0 buildings
- 2016: 6 buildings, average cost: $146,100
- 2015: 0 buildings
- 2014: 14 buildings, average cost: $123,700
- 2013: 16 buildings, average cost: $123,700
- 2012: 13 buildings, average cost: $123,700
- 2011: 20 buildings, average cost: $105,400
- 2010: 15 buildings, average cost: $112,200
- 2009: 9 buildings, average cost: $95,400
- 2008: 11 buildings, average cost: $91,500
- 2007: 18 buildings, average cost: $160,700
- 2006: 24 buildings, average cost: $103,900
- 2005: 30 buildings, average cost: $130,300
- 2004: 26 buildings, average cost: $97,200
- 2003: 19 buildings, average cost: $112,500
- 2002: 52 buildings, average cost: $73,200
- 2001: 48 buildings, average cost: $73,200
- 2000: 59 buildings, average cost: $74,000
- 1999: 83 buildings, average cost: $72,000
- 1998: 60 buildings, average cost: $63,600
- 1997: 37 buildings, average cost: $75,000
Median real estate property taxes paid for housing units with mortgages in 2022: $660 (0.4%)
Median real estate property taxes paid for housing units with no mortgage in 2022: $569 (0.5%)
| Clay County: | 11.1% |
| Indiana: | 12.6% |
Median age of residents in 2022: 41.3 years old
(Males: 40.7 years old, Females: 42.1 years old)
(Median age for: White residents: 42.3 years old, Black residents: 32.7 years old, Asian residents: 53.6 years old, Hispanic or Latino residents: 33.0 years old, Other race residents: 74.4 years old)
Area name: Terre Haute, IN HUD Metro FMR Area
Fair market rent in 2006 for a 1-bedroom apartment in Clay County is $409 a month.
Fair market rent for a 2-bedroom apartment is $527 a month.
Fair market rent for a 3-bedroom apartment is $650 a month.
Cities in this county include: Brazil, Clay City, Knightsville, Harmony, Staunton, Coalmont, Carbon, Center Point.
Neighboring counties: Cecil County, Maryland  , Clark County, Illinois
  , Mineral County, West Virginia , Taylor County, West Virginia , Morgan County, Illinois , Vinton County, Ohio .
| Here: | 2.7% |
| Indiana: | 2.8% |
Current college students: 872
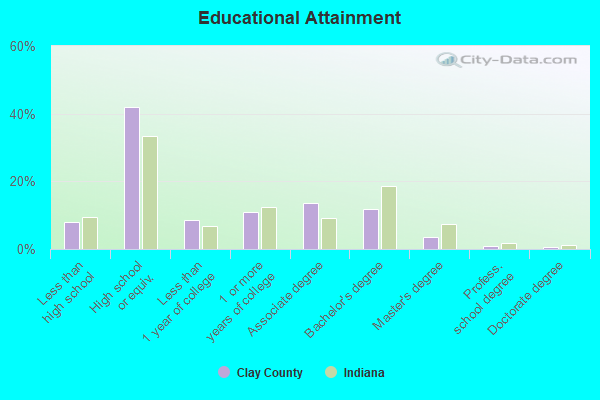
People 25 years of age or older with a high school degree or higher: 91.4%
People 25 years of age or older with a bachelor's degree or higher: 16.9%
Number of foreign born residents: 245 (80.8% naturalized citizens)
| Clay County: | 0.9% |
| Whole state: | 6.1% |
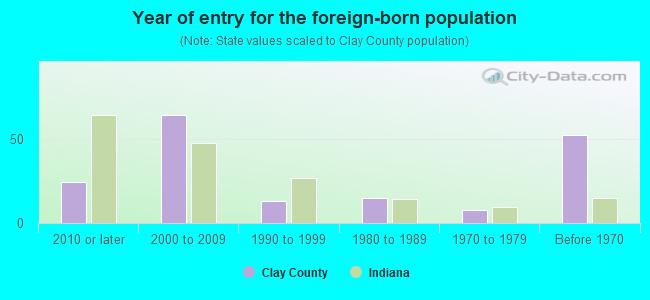
- Year of entry for the foreign-born population
- 222010 or later
- 1062000 to 2009
- 131990 to 1999
- 151980 to 1989
- 81970 to 1979
- 52Before 1970
Mean travel time to work (commute): minutes
Percentage of county residents living and working in this county: 98.9%
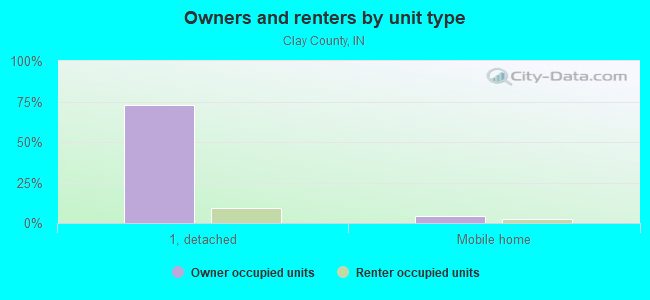
Housing units in structures:
- One, detached: 9,505
- One, attached: 217
- Two: 225
- 3 or 4: 232
- 5 to 9: 291
- 10 to 19: 19
- 20 to 49: 64
- 50 or more: 165
- Mobile homes: 1,074
Housing units in Clay County with a mortgage: 5,206 (573 second mortgage, 1 home equity loan, 445 both second mortgage and home equity loan)
Houses without a mortgage: 61
| Here: | 7.6% with mortgage |
| State: | 96.6% with mortgage |
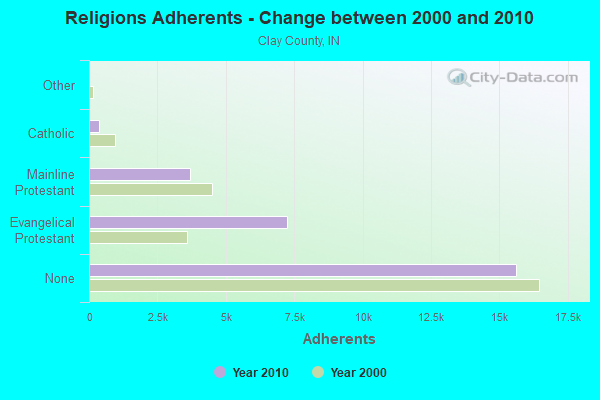
Religion statistics for Clay County
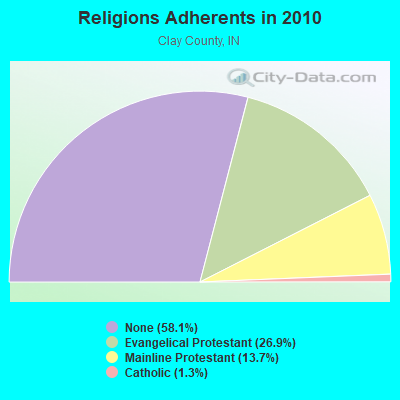
| Religion | Adherents | Congregations |
|---|---|---|
| Evangelical Protestant | 7,236 | 36 |
| Mainline Protestant | 3,684 | 25 |
| Catholic | 356 | 1 |
| Other | 4 | 1 |
| None | 15,610 | - |
Source: Clifford Grammich, Kirk Hadaway, Richard Houseal, Dale E.Jones, Alexei Krindatch, Richie Stanley and Richard H.Taylor. 2012. 2010 U.S.Religion Census: Religious Congregations & Membership Study. Association of Statisticians of American Religious Bodies. Jones, Dale E., et al. 2002. Congregations and Membership in the United States 2000. Nashville, TN: Glenmary Research Center.
Food Environment Statistics:
| Clay County: | 1.50 / 10,000 pop. |
| State: | 1.73 / 10,000 pop. |
| This county: | 0.38 / 10,000 pop. |
| Indiana: | 0.50 / 10,000 pop. |
| Clay County: | 5.63 / 10,000 pop. |
| Indiana: | 3.57 / 10,000 pop. |
| This county: | 6.01 / 10,000 pop. |
| State: | 6.78 / 10,000 pop. |
| Clay County: | 9.2% |
| Indiana: | 9.2% |
| Clay County: | 29.7% |
| State: | 29.0% |
| Here: | 13.9% |
| State: | 14.3% |
Agriculture in Clay County:
Average size of farms: 273 acresAverage value of agricultural products sold per farm: $58,422
Average value of crops sold per acre for harvested cropland: $225.31
The value of livestock, poultry, and their products as a percentage of the total market value of agricultural products sold: 17.72%
Average total farm production expenses per farm: $48,438
Harvested cropland as a percentage of land in farms: 78.11%
Irrigated harvested cropland as a percentage of land in farms: 0.01%
Average market value of all machinery and equipment per farm: $66,464
The percentage of farms operated by a family or individual: 90.27%
Average age of principal farm operators: 54 years
Average number of cattle and calves per 100 acres of all land in farms: 4.04
Milk cows as a percentage of all cattle and calves: 18.30%
Corn for grain: 48441 harvested acres
All wheat for grain: 2221 harvested acres
Soybeans for beans: 64456 harvested acres
Vegetables: 19 harvested acres
Earthquake activity:
Clay County-area historical earthquake activity is significantly above Indiana state average. It is 127% greater than the overall U.S. average.On 4/18/2008 at 09:36:59, a magnitude 5.4 (5.1 MB, 4.8 MS, 5.4 MW, 5.2 MW, Class: Moderate, Intensity: VI - VII) earthquake occurred 79.7 miles away from Clay County center
On 4/18/2008 at 09:36:59, a magnitude 5.2 (5.2 MW, Depth: 8.9 mi) earthquake occurred 79.8 miles away from the county center
On 6/10/1987 at 23:48:54, a magnitude 5.1 (4.9 MB, 4.4 MS, 4.6 MS, 5.1 LG) earthquake occurred 59.3 miles away from the county center
On 6/18/2002 at 17:37:15, a magnitude 5.0 (4.3 MB, 4.6 MW, 5.0 LG) earthquake occurred 106.6 miles away from the county center
On 4/18/2008 at 15:14:16, a magnitude 4.8 (4.5 MB, 4.8 MW, 4.6 MW, Class: Light, Intensity: IV - V) earthquake occurred 77.2 miles away from Clay County center
On 4/3/1974 at 23:05:02, a magnitude 4.7 (4.5 MB, 4.7 LG) earthquake occurred 78.6 miles away from the county center
Magnitude types: regional Lg-wave magnitude (LG), body-wave magnitude (MB), surface-wave magnitude (MS), moment magnitude (MW)
Most recent natural disasters:
- Indiana Covid-19 Pandemic, Incident Period: January 31, 2020, FEMA Id: 4515, Natural disaster type: Other
- Indiana Severe Winter Storm and Snowstorm, Incident Period: January 05, 2014 to January 09, 2014, Major Disaster (Presidential) Declared DR-4173: April 22, 2014, FEMA Id: 4173, Natural disaster type: Snowstorm, Winter Storm
- Indiana Severe Storms, Tornadoes, Straight-Line Winds, and Flooding, Incident Period: April 19, 2011 to June 06, 2011, Major Disaster (Presidential) Declared DR-1997: June 23, 2011, FEMA Id: 1997, Natural disaster type: Storm, Tornado, Flood, Wind
- Indiana Severe Storms and Flooding, Incident Period: May 30, 2008 to June 27, 2008, Major Disaster (Presidential) Declared DR-1766: June 08, 2008, FEMA Id: 1766, Natural disaster type: Storm, Flood
- Indiana Hurricane Katrina Evacuation, Incident Period: August 29, 2005 to October 01, 2005, Emergency Declared EM-3238: September 10, 2005, FEMA Id: 3238, Natural disaster type: Hurricane
- Indiana Severe Winter Storms and Flooding, Incident Period: January 01, 2005 to February 11, 2005, Major Disaster (Presidential) Declared DR-1573: January 21, 2005, FEMA Id: 1573, Natural disaster type: Winter Storm, Flood
- Indiana Tornadoes, and Flooding, Incident Period: July 03, 2004 to July 18, 2004, Major Disaster (Presidential) Declared DR-1542: September 01, 2004, FEMA Id: 1542, Natural disaster type: Tornado, Flood
- Indiana Severe Storms, Tornadoes, and Flooding, Incident Period: May 25, 2004 to June 25, 2004, Major Disaster (Presidential) Declared DR-1520: June 03, 2004, FEMA Id: 1520, Natural disaster type: Storm, Tornado, Flood
- Indiana Severe Storms, Tornadoes, and Flooding, Incident Period: August 26, 2003 to September 15, 2003, Major Disaster (Presidential) Declared DR-1487: September 05, 2003, FEMA Id: 1487, Natural disaster type: Storm, Tornado, Flood
- Indiana Severe Storms, Tornadoes, and Flooding, Incident Period: July 04, 2003 to August 06, 2003, Major Disaster (Presidential) Declared DR-1476: July 11, 2003, FEMA Id: 1476, Natural disaster type: Storm, Tornado, Flood
- 7 other natural disasters have been reported since 1953.
The number of natural disasters in Clay County (17) is near the US average (15).
Major Disasters (Presidential) Declared: 13
Emergencies Declared: 3
Causes of natural disasters: Floods: 11, Storms: 8, Tornadoes: 7, Winter Storms: 3, Snowstorms: 2, Blizzard: 1, Hurricane: 1, Wind: 1, Other: 1 (Note: some incidents may be assigned to more than one category).
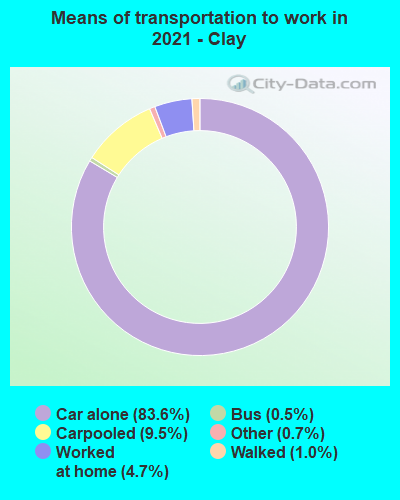
Means of transportation to work:
- Drove a car alone: 5,618 (77.3%)
- Carpooled: 783 (10.8%)
- Bus: 38 (0.5%)
- Taxicab, motorcycle, or other means: 58 (0.8%)
- Bicycle: 31 (0.4%)
- Walked: 86 (1.2%)
- Worked at home: 619 (8.5%)
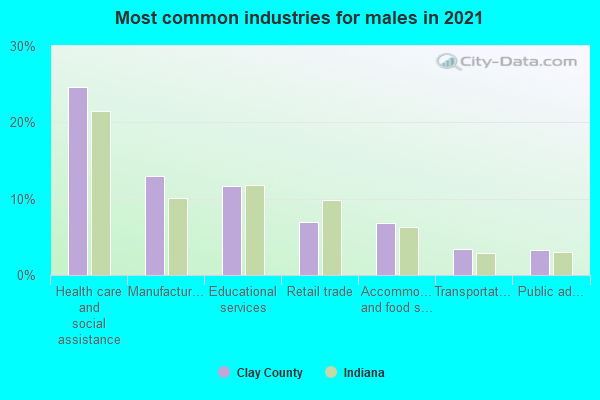
- Health care and social assistance (26%)
- Educational services (12%)
- Manufacturing (11%)
- Retail trade (7%)
- Accommodation and food services (6%)
- Transportation and warehousing (4%)
- Public administration (4%)
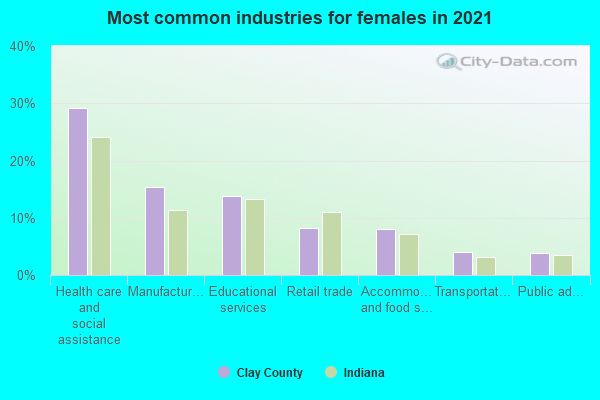
- Health care and social assistance (32%)
- Educational services (14%)
- Manufacturing (13%)
- Retail trade (8%)
- Accommodation and food services (8%)
- Transportation and warehousing (5%)
- Public administration (5%)
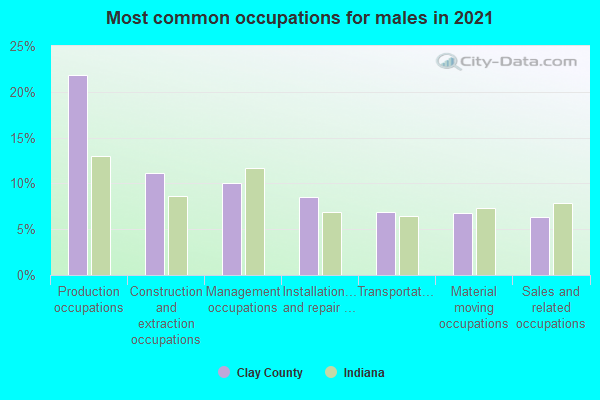
- Production occupations (21%)
- Construction and extraction occupations (12%)
- Management occupations (10%)
- Installation, maintenance, and repair occupations (8%)
- Material moving occupations (7%)
- Sales and related occupations (7%)
- Transportation occupations (6%)
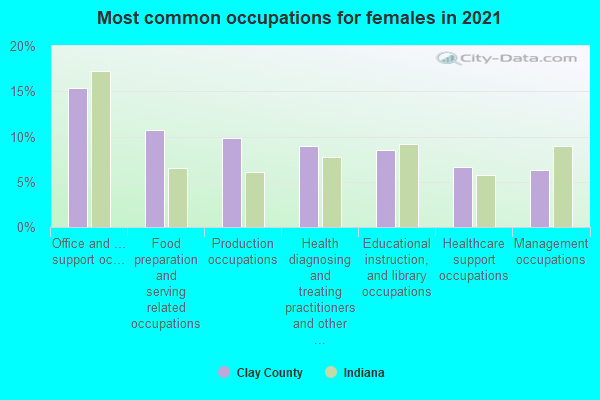
- Office and administrative support occupations (16%)
- Food preparation and serving related occupations (10%)
- Health diagnosing and treating practitioners and other technical occupations (10%)
- Educational instruction, and library occupations (8%)
- Sales and related occupations (8%)
- Healthcare support occupations (7%)
- Production occupations (7%)
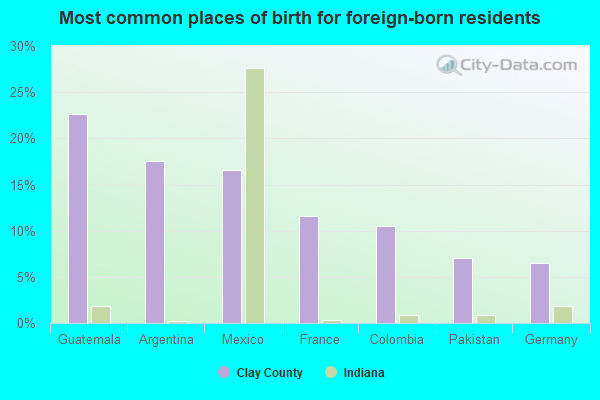
- Mexico (24%)
- Guatemala (20%)
- Argentina (14%)
- Colombia (10%)
- Philippines (8%)
- France (8%)
- Pakistan (6%)
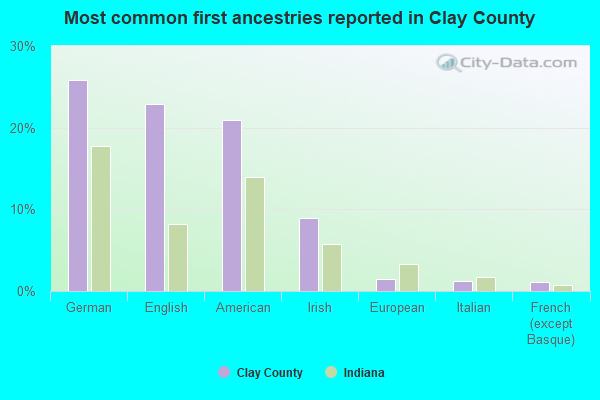
- American (25%)
- German (21%)
- English (21%)
- Irish (9%)
- European (2%)
- French (except Basque) (1%)
- Italian (1%)
People in group quarters in Clay County, Indiana in 2010:
- 184 people in nursing facilities/skilled-nursing facilities
- 91 people in local jails and other municipal confinement facilities
- 37 people in residential treatment centers for adults
- 26 people in group homes intended for adults
- 3 people in group homes for juveniles (non-correctional)
People in group quarters in Clay County, Indiana in 2000:
- 244 people in nursing homes
- 36 people in local jails and other confinement facilities (including police lockups)
- 28 people in homes or halfway houses for drug/alcohol abuse
- 6 people in wards in general hospitals for patients who have no usual home elsewhere
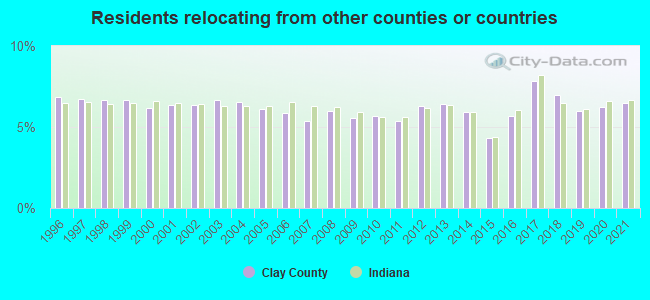
6.47% of this county's 2021 resident taxpayers lived in other counties in 2020 ($47,817 average adjusted gross income)
| Here: | 6.47% |
| Indiana average: | 6.66% |
10 or fewer of this county's residents moved from foreign countries.
5.40% relocated from other counties in Indiana ($40,589 average AGI)
1.07% relocated from other states ($7,228 average AGI)
Clay County: 1.07% Indiana average: 2.58%
Top counties from which taxpayers relocated into this county between 2020 and 2021:
| from Vigo County, IN | |
| from Putnam County, IN | |
| from Marion County, IN | |
| from Owen County, IN | |
| from Parke County, IN | |
| from Hendricks County, IN |
6.31% of this county's 2020 resident taxpayers moved to other counties in 2021 ($42,902 average adjusted gross income)
| Here: | 6.31% |
| Indiana average: | 6.55% |
10 or fewer of this county's residents moved to foreign countries.
5.37% relocated to other counties in Indiana ($36,229 average AGI)
0.94% relocated to other states ($6,674 average AGI)
Clay County: 0.94% Indiana average: 2.46%

Top counties to which taxpayers relocated from this county between 2020 and 2021:
| to Vigo County, IN | |
| to Putnam County, IN | |
| to Owen County, IN | |
| to Hendricks County, IN | |
| to Marion County, IN | |
| to Greene County, IN | |
| to Parke County, IN |
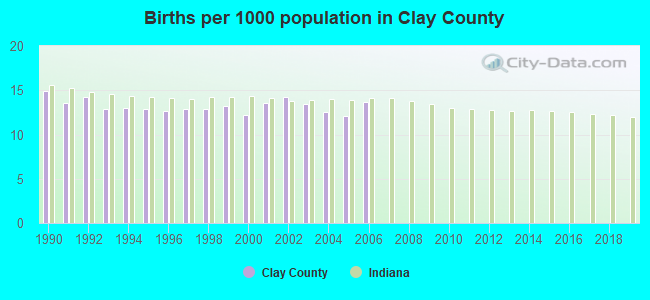
Births per 1000 population from 1990 to 1999: 13.3
Births per 1000 population from 2000 to 2006: 13.1
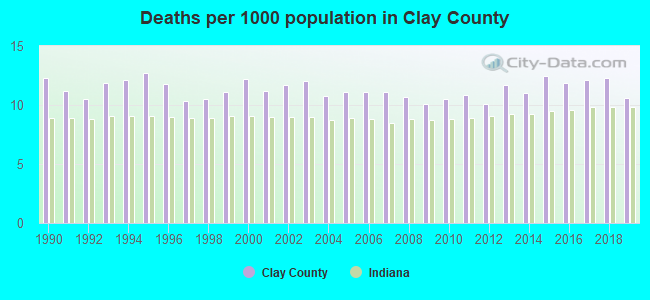
Deaths per 1000 population from 1990 to 1999: 11.4
Deaths per 1000 population from 2000 to 2009: 11.2
Deaths per 1000 population from 2010 to 2020: 11.6
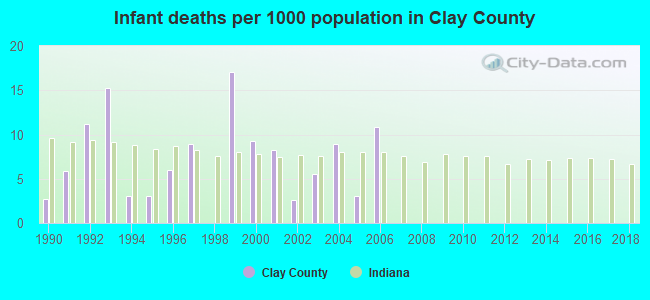
Infant deaths per 1000 live births from 1990 to 1999: 7.3
Infant deaths per 1000 live births from 2000 to 2006: 6.9
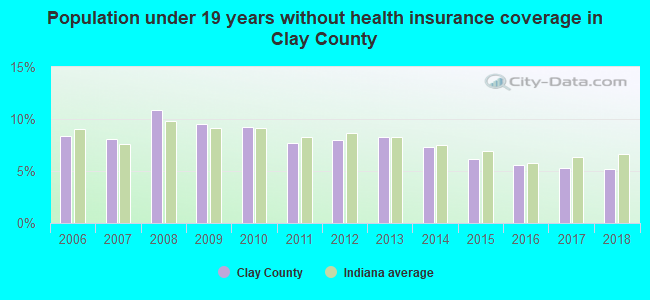
Persons under 19 years old without health insurance coverage in 2018: 5.2%

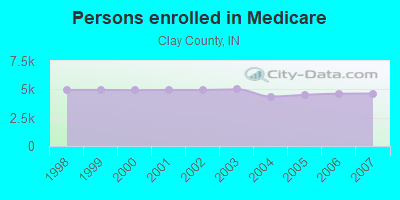
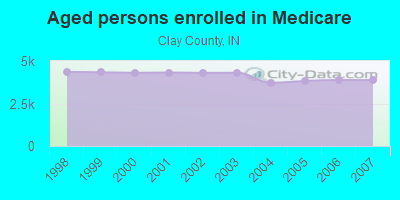
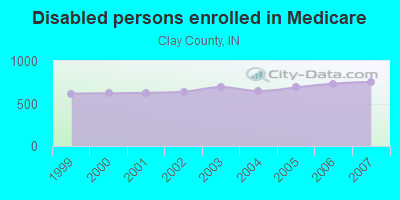
Persons enrolled in hospital insurance and/or supplemental medical insurance (Medicare) in July 1, 2007: 4,629 (3,875 aged, 754 disabled)
Children under 18 without health insurance coverage in 2007: 505 (7%)
Most common underlying causes of death in Clay County, Indiana in 1999 - 2019:
- Acute myocardial infarction, unspecified (543)
- Atherosclerotic heart disease (468)
- Bronchus or lung, unspecified - Malignant neoplasms (422)
- Chronic obstructive pulmonary disease, unspecified (324)
- Alzheimer disease, unspecified (240)
- Stroke, not specified as haemorrhage or infarction (145)
- Other specified general symptoms and signs (57)
- Unspecified dementia (46)
- Congestive heart failure (44)
- Cardiac arrhythmia, unspecified (36)
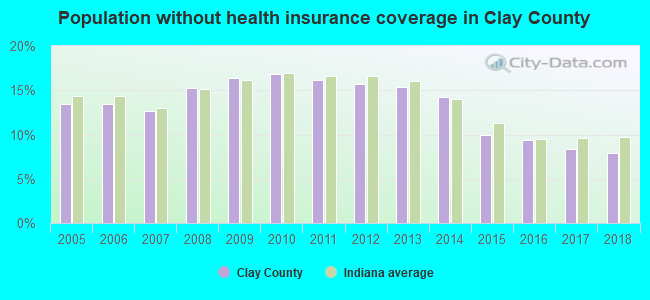
Population without health insurance coverage in 2000: 11%
Children under 18 without health insurance coverage in 2000: 9%
Short term general hospital admissions per 100,000 population in 2004: 3,866
Short term general hospital beds per 100,000 population in 2004: 92
Emergency room visits per 100,000 population in 2004: 34,366
General practice office based MDs per 100,000 population in 2005: 1,315
Medical specialist MDs per 100,000 population in 2005: 1,127
Dentists per 100,000 population in 1998: 4
Total births per 100,000 population, July 2005 - July 2006 : 15
Total deaths per 100,000 population, July 2005 - July 2006: 92
Limited-service eating places per 100,000 population in 2005 : 4
Suicides per 1,000,000 population from 2000 to 2006: 203.7. This is more than state average.
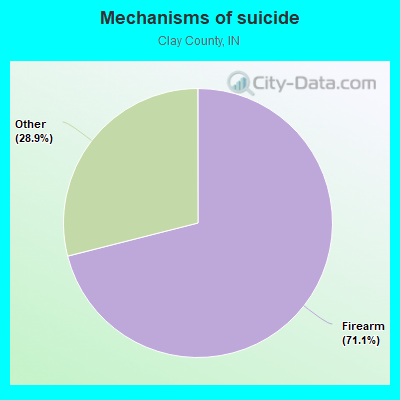
- Firearm - 144.8
- Other - 59.0
Household type by relationship:
Households: 26,585- Male householders: 5,317 (1,223 living alone), Female householders: 5,391 (1,420 living alone)
5,630 spouses (5,615 opposite-sex spouses), 647 unmarried partners, (645 opposite-sex unmarried partners), 6,931 children (6,395 natural, 99 adopted, 433 stepchildren), 792 grandchildren, 236 brothers or sisters, 259 parents, 20 foster children, 269 other relatives, 599 non-relatives
- In group quarters: 497
Size of family households: 3,799 2-persons, 1,537 3-persons, 1,212 4-persons, 742 5-persons, 94 6-persons, 210 7-or-more-persons.
Size of nonfamily households: 2,644 1-person, 322 2-persons, 71 3-persons, 45 4-persons, 1 5-persons, 32 7-or-more-persons.
3,917 married couples with children.
1,253 single-parent households (202 men, 1,051 women).
98.2% of residents of Clay speak English at home.
0.8% of residents speak Spanish at home (76% speak English very well, 8% speak English well, 13% speak English not well, 3% don't speak English at all).
0.2% of residents speak other Indo-European language at home (100% speak English very well).
0.1% of residents speak Asian or Pacific Island language at home (5% speak English very well, 81% speak English well, 14% speak English not well).
In fiscal year 2004:
Federal Government expenditure: $158,091,000 ($5,810 per capita)
Department of Defense expenditure: $6,885,000
Federal direct payments to individuals for retirement and disability: $75,956,000
Federal other direct payments to individuals: $35,772,000
Federal direct payments not to individuals: $4,933,000
Federal grants: $31,470,000
Federal procurement contracts: $1,245,000 ($45,000 Department of Defense)
Federal salaries and wages: $8,713,000 ($4,104,000 Department of Defense)
Federal Government direct loans: $1,206,000
Federal guaranteed/insured loans: $7,704,000
Federal Government insurance: $17,775,000
Population change from April 1, 2000 to July 1, 2005:
Births: 1,829| Here: | 67 per 1000 residents |
| State: | 72 per 1000 residents |
Deaths: 1,648
| Here: | 61 per 1000 residents |
| State: | 47 per 1000 residents |
Net international migration: +62
| Here: | +2 per 1000 residents |
| State: | +9 per 1000 residents |
Net internal migration: +370
| Here: | |
| State: |
Total withdrawal of fresh water for public supply: 0.32 millions of gallons per day (all from ground)
| Here: | 6.3 |
| State: | 6.6 |
| Here: | 4.6 |
| State: | 4.3 |
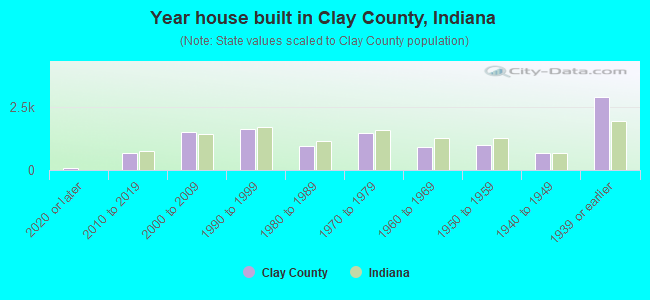
- Year house built in Clay County, Indiana
- 962020 or later
- 7302010 to 2019
- 1,4792000 to 2009
- 1,6561990 to 1999
- 8381980 to 1989
- 1,6081970 to 1979
- 8631960 to 1969
- 1,2181950 to 1959
- 5951940 to 1949
- 2,5781939 or earlier
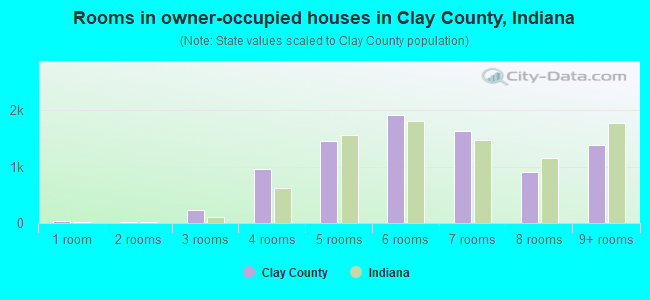
- Rooms in owner-occupied houses in Clay County, Indiana
- 261 room
- 102 rooms
- 2313 rooms
- 7674 rooms
- 1,4105 rooms
- 2,0996 rooms
- 1,5377 rooms
- 9258 rooms
- 1,3949+ rooms
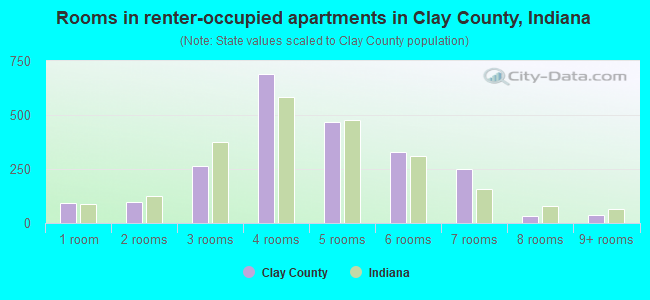
- Rooms in renter-occupied apartments in Clay County, Indiana
- 571 room
- 1382 rooms
- 2553 rooms
- 6684 rooms
- 4645 rooms
- 4616 rooms
- 2157 rooms
- 368 rooms
- 399+ rooms
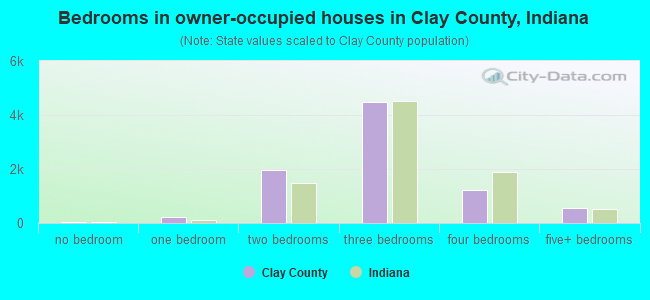
- Bedrooms in owner-occupied houses in Clay County, Indiana
- 50no bedroom
- 2651 bedroom
- 1,7152 bedrooms
- 4,4983 bedrooms
- 1,3214 bedrooms
- 5495+ bedrooms
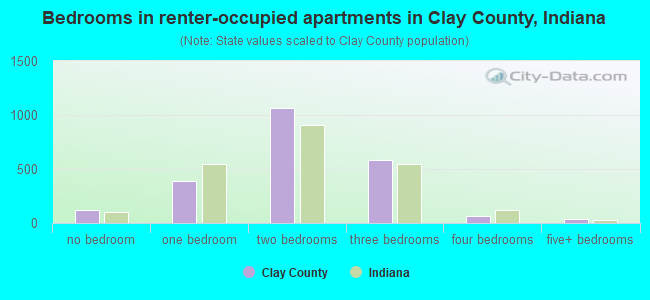
- Bedrooms in renter-occupied apartments in Clay County, Indiana
- 59no bedroom
- 4671 bedroom
- 1,0602 bedrooms
- 6383 bedrooms
- 744 bedrooms
- 345+ bedrooms
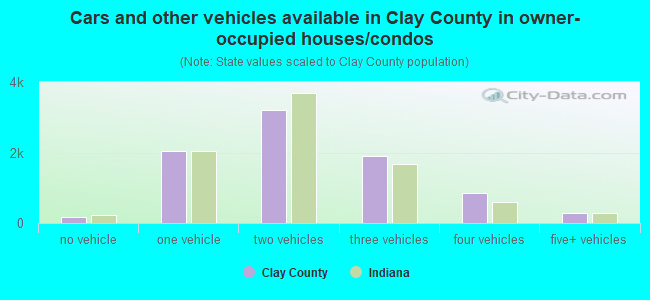
- Cars and other vehicles available in Clay County in owner-occupied houses/condos
- 186no vehicle
- 1,8581 vehicle
- 3,2782 vehicles
- 1,9493 vehicles
- 8134 vehicles
- 2815+ vehicles
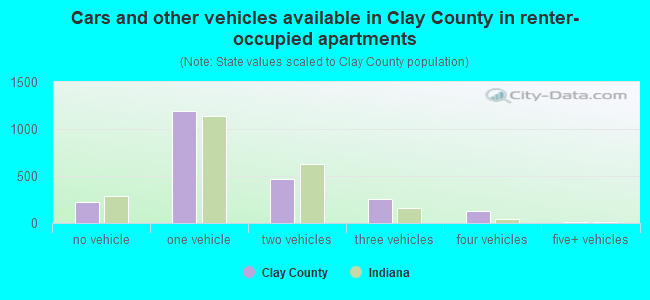
- Cars and other vehicles available in Clay County in renter-occupied apartments
- 185no vehicle
- 1,3481 vehicle
- 5072 vehicles
- 1613 vehicles
- 1264 vehicles
- 95+ vehicles
89.6% of Clay County residents lived in the same house 1 years ago.
Out of people who lived in different houses, 37% lived in this county.
Out of people who lived in different counties, 71% lived in Indiana.
| Clay County: | 89.6% |
| State average: | 87.1% |
Place of birth for U.S.-born residents:
- This state: 21,905
- Other state: 4,180
- Northeast: 233
- Midwest: 2,273
- South: 1,065
- West: 627
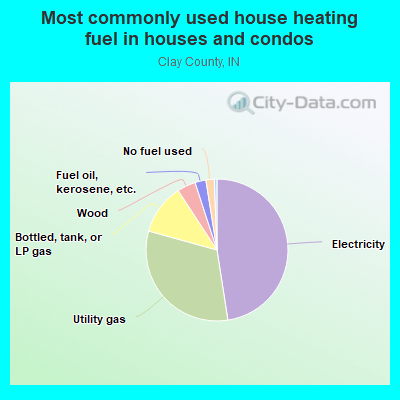
- 49.6%Electricity
- 31.5%Utility gas
- 11.4%Bottled, tank, or LP gas
- 4.2%Wood
- 1.9%Fuel oil, kerosene, etc.
- 1.1%No fuel used
- 0.3%Other fuel
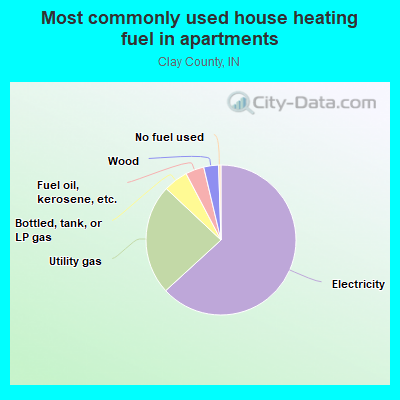
- 59.4%Electricity
- 26.7%Utility gas
- 5.6%Bottled, tank, or LP gas
- 4.8%Fuel oil, kerosene, etc.
- 3.0%Wood
- 0.6%No fuel used
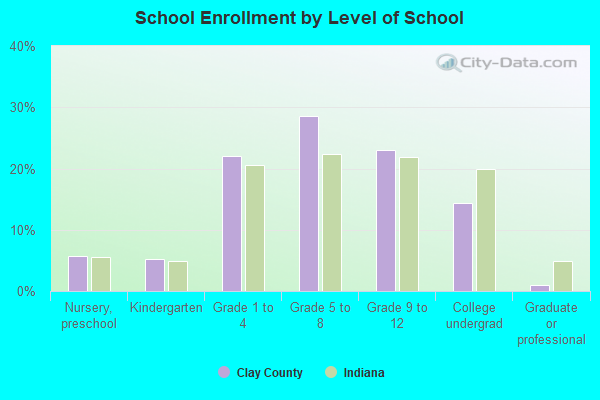
Private vs. public school enrollment:
| Here: | 6.1% |
| Indiana: | 14.9% |
| Here: | 2.4% |
| Indiana: | 11.4% |
| Here: | 17.4% |
| Indiana: | 22.3% |
Clay County government finances - Expenditure in 2018:
- Bond Funds - Cash and Securities: $510,000
- Charges - Other: $394,000
Sewerage: $28,000
Air Transportation: $20,000
- Construction - Regular Highways: $656,000
General - Other: $54,000
- Current Operations - Regular Highways: $3,312,000
Central Staff Services: $3,107,000
General - Other: $2,714,000
Judicial and Legal Services: $2,096,000
Police Protection: $1,771,000
Correctional Institutions: $1,679,000
Financial Administration: $834,000
Health - Other: $428,000
Corrections - Other: $282,000
Natural Resources - Other: $250,000
Air Transportation: $69,000
Public Welfare - Other: $37,000
Sewerage: $3,000
- Federal Intergovernmental - Other: $40,000
- General - Interest on Debt: $40,000
- Local Intergovernmental - Highways: $307,000
- Long Term Debt - Beginning Outstanding - Unspecified Public Purpose: $989,000
Outstanding Unspecified Public Purpose: $989,000
- Miscellaneous - General Revenue - Other: $1,411,000
Fines and Forfeits: $198,000
Special Assessments: $106,000
Interest Earnings: $11,000
- Other Capital Outlay - Regular Highways: $324,000
Police Protection: $150,000
Correctional Institutions: $22,000
General - Other: $22,000
Judicial and Legal Services: $2,000
- Other Funds - Cash and Securities: $12,788,000
- Sinking Funds - Cash and Securities: $45,000
- State Intergovernmental - Highways: $2,610,000
General Local Government Support: $2,179,000
Other: $1,862,000
Health and Hospitals: $61,000
- Tax - Property: $4,006,000
Documentary and Stock Transfer: $3,000
Clay County government finances - Revenue in 2018:
- Bond Funds - Cash and Securities: $510,000
- Charges - Other: $394,000
Sewerage: $28,000
Air Transportation: $20,000
- Construction - Regular Highways: $656,000
General - Other: $54,000
- Current Operations - Regular Highways: $3,312,000
Central Staff Services: $3,107,000
General - Other: $2,714,000
Judicial and Legal Services: $2,096,000
Police Protection: $1,771,000
Correctional Institutions: $1,679,000
Financial Administration: $834,000
Health - Other: $428,000
Corrections - Other: $282,000
Natural Resources - Other: $250,000
Air Transportation: $69,000
Public Welfare - Other: $37,000
Sewerage: $3,000
- Federal Intergovernmental - Other: $40,000
- General - Interest on Debt: $40,000
- Local Intergovernmental - Highways: $307,000
- Long Term Debt - Beginning Outstanding - Unspecified Public Purpose: $989,000
Outstanding Unspecified Public Purpose: $989,000
- Miscellaneous - General Revenue - Other: $1,411,000
Fines and Forfeits: $198,000
Special Assessments: $106,000
Interest Earnings: $11,000
- Other Capital Outlay - Regular Highways: $324,000
Police Protection: $150,000
Correctional Institutions: $22,000
General - Other: $22,000
Judicial and Legal Services: $2,000
- Other Funds - Cash and Securities: $12,788,000
- Sinking Funds - Cash and Securities: $45,000
- State Intergovernmental - Highways: $2,610,000
General Local Government Support: $2,179,000
Other: $1,862,000
Health and Hospitals: $61,000
- Tax - Property: $4,006,000
Documentary and Stock Transfer: $3,000
Clay County government finances - Debt in 2018:
- Bond Funds - Cash and Securities: $510,000
- Charges - Other: $394,000
Sewerage: $28,000
Air Transportation: $20,000
- Construction - Regular Highways: $656,000
General - Other: $54,000
- Current Operations - Regular Highways: $3,312,000
Central Staff Services: $3,107,000
General - Other: $2,714,000
Judicial and Legal Services: $2,096,000
Police Protection: $1,771,000
Correctional Institutions: $1,679,000
Financial Administration: $834,000
Health - Other: $428,000
Corrections - Other: $282,000
Natural Resources - Other: $250,000
Air Transportation: $69,000
Public Welfare - Other: $37,000
Sewerage: $3,000
- Federal Intergovernmental - Other: $40,000
- General - Interest on Debt: $40,000
- Local Intergovernmental - Highways: $307,000
- Long Term Debt - Beginning Outstanding - Unspecified Public Purpose: $989,000
Outstanding Unspecified Public Purpose: $989,000
- Miscellaneous - General Revenue - Other: $1,411,000
Fines and Forfeits: $198,000
Special Assessments: $106,000
Interest Earnings: $11,000
- Other Capital Outlay - Regular Highways: $324,000
Police Protection: $150,000
Correctional Institutions: $22,000
General - Other: $22,000
Judicial and Legal Services: $2,000
- Other Funds - Cash and Securities: $12,788,000
- Sinking Funds - Cash and Securities: $45,000
- State Intergovernmental - Highways: $2,610,000
General Local Government Support: $2,179,000
Other: $1,862,000
Health and Hospitals: $61,000
- Tax - Property: $4,006,000
Documentary and Stock Transfer: $3,000
Clay County government finances - Cash and Securities in 2018:
- Bond Funds - Cash and Securities: $510,000
- Charges - Other: $394,000
Sewerage: $28,000
Air Transportation: $20,000
- Construction - Regular Highways: $656,000
General - Other: $54,000
- Current Operations - Regular Highways: $3,312,000
Central Staff Services: $3,107,000
General - Other: $2,714,000
Judicial and Legal Services: $2,096,000
Police Protection: $1,771,000
Correctional Institutions: $1,679,000
Financial Administration: $834,000
Health - Other: $428,000
Corrections - Other: $282,000
Natural Resources - Other: $250,000
Air Transportation: $69,000
Public Welfare - Other: $37,000
Sewerage: $3,000
- Federal Intergovernmental - Other: $40,000
- General - Interest on Debt: $40,000
- Local Intergovernmental - Highways: $307,000
- Long Term Debt - Beginning Outstanding - Unspecified Public Purpose: $989,000
Outstanding Unspecified Public Purpose: $989,000
- Miscellaneous - General Revenue - Other: $1,411,000
Fines and Forfeits: $198,000
Special Assessments: $106,000
Interest Earnings: $11,000
- Other Capital Outlay - Regular Highways: $324,000
Police Protection: $150,000
Correctional Institutions: $22,000
General - Other: $22,000
Judicial and Legal Services: $2,000
- Other Funds - Cash and Securities: $12,788,000
- Sinking Funds - Cash and Securities: $45,000
- State Intergovernmental - Highways: $2,610,000
General Local Government Support: $2,179,000
Other: $1,862,000
Health and Hospitals: $61,000
- Tax - Property: $4,006,000
Documentary and Stock Transfer: $3,000
Supplemental Security Income (SSI) in 2006:
- Total number of recipients: 533
- Number of aged recipients: 18
- Number of blind and disabled recipients: 515
- Number of recipients under 18: 122
- Number of recipients between 18 and 64: 357
- Number of recipients older than 64: 54
- Number of recipients also receiving OASDI: 152
- Amount of payments (thousands of dollars): 245
| Most common first names in Clay County, IN among deceased individuals | ||
| Name | Count | Lived (average) |
|---|---|---|
| William | 256 | 76.4 years |
| Mary | 254 | 80.0 years |
| John | 241 | 73.3 years |
| James | 210 | 72.4 years |
| Charles | 184 | 75.3 years |
| Robert | 168 | 69.9 years |
| Ruth | 124 | 81.5 years |
| George | 100 | 76.2 years |
| Helen | 92 | 79.6 years |
| Anna | 90 | 82.6 years |
| Most common last names in Clay County, IN among deceased individuals | ||
| Last name | Count | Lived (average) |
|---|---|---|
| Brown | 107 | 78.2 years |
| Smith | 107 | 75.8 years |
| Miller | 99 | 78.6 years |
| Johnson | 60 | 74.5 years |
| Jones | 60 | 78.7 years |
| Thomas | 52 | 76.6 years |
| Williams | 50 | 77.3 years |
| Thompson | 46 | 76.4 years |
| Moore | 45 | 73.0 years |
| Wilson | 44 | 76.5 years |
| Businesses in Clay County, IN | ||||
| Name | Count | Name | Count | |
|---|---|---|---|---|
| ALDI | 1 | Little Caesars Pizza | 1 | |
| AT&T | 2 | Long John Silver's | 1 | |
| Advance Auto Parts | 1 | MasterBrand Cabinets | 2 | |
| Burger King | 1 | McDonald's | 2 | |
| CVS | 1 | Nike | 1 | |
| Chevrolet | 2 | Papa John's Pizza | 1 | |
| Curves | 1 | Pizza Hut | 1 | |
| Dairy Queen | 1 | RadioShack | 1 | |
| FedEx | 2 | Subway | 3 | |
| Ford | 2 | Taco Bell | 1 | |
| Goodwill | 2 | U-Haul | 1 | |
| H&R Block | 1 | UPS | 3 | |
| Hardee's | 1 | Walgreens | 1 | |
| KFC | 1 | Walmart | 1 | |
| Knights Inn | 1 | Wendy's | 1 | |
| Kroger | 1 | YMCA | 1 | |