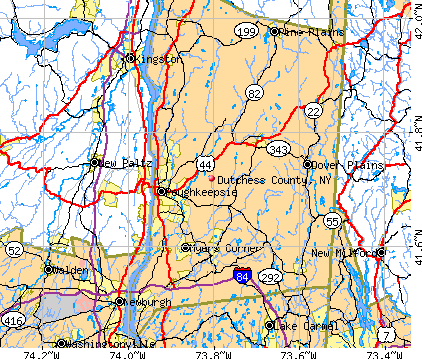
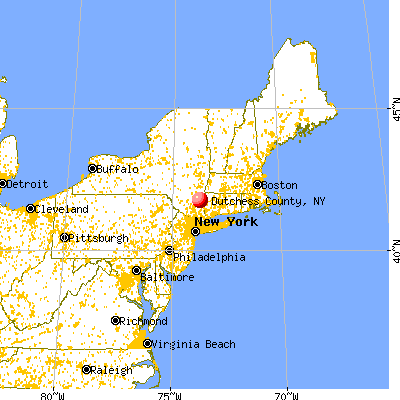
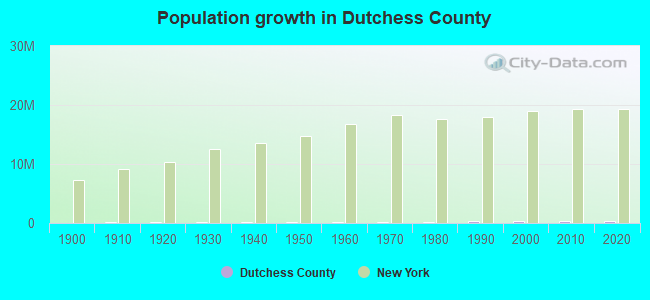
Dutchess County, New York (NY)
County owner-occupied free and clear houses and condos in 2010: 21,269
County owner-occupied houses and condos in 2000: 68,628
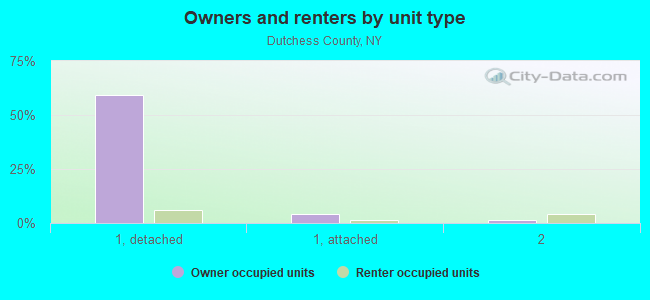
Renter-occupied apartments: 32,897 (it was 30,908 in 2000)
| % of renters here: | 31% |
| State: | 47% |
Land area: 802 sq. mi.
Water area: 23.8 sq. mi.
Population density: 371 people per square mile (high).
Industries providing employment: Educational, health and social services (30.7%), Retail trade (12.8%), Professional, scientific, management, administrative, and waste management services (11.4%).
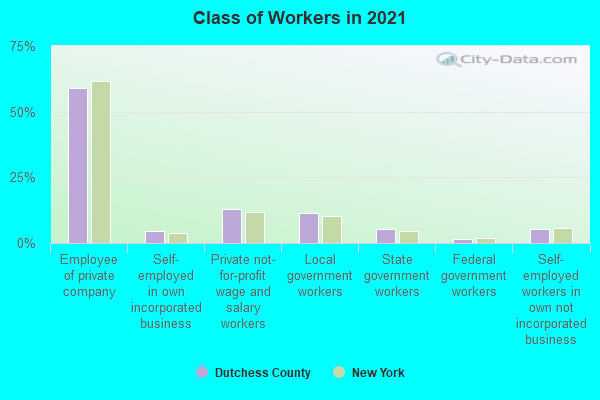
Type of workers:
- Private wage or salary: 77%
- Government: 18%
- Self-employed, not incorporated: 5%
- Unpaid family work: 0%
- OSM Map
- General Map
- Google Map
- MSN Map

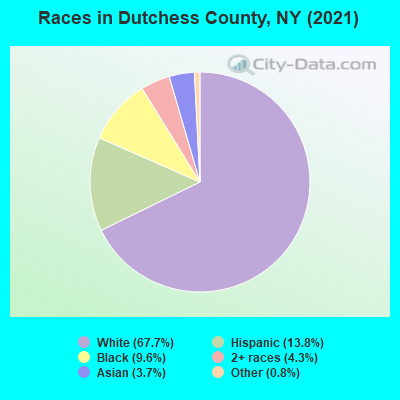
- 197,23266.3%White Non-Hispanic Alone
- 43,26614.5%Hispanic or Latino
- 27,4629.2%Black Non-Hispanic Alone
- 15,9455.4%Two or more races
- 9,7723.3%Asian alone
- 3,5111.2%Some other race alone
- 2730.09%Native Hawaiian and Other
Pacific Islander alone - 840.03%American Indian and Alaska Native alone
| Median resident age: | 42.8 years |
| New York median age: | 40.0 years |
| Males: 148,488 | |
| Females: 149,057 |


| Dutchess County: | 2.0 people |
| New York: | 3 people |
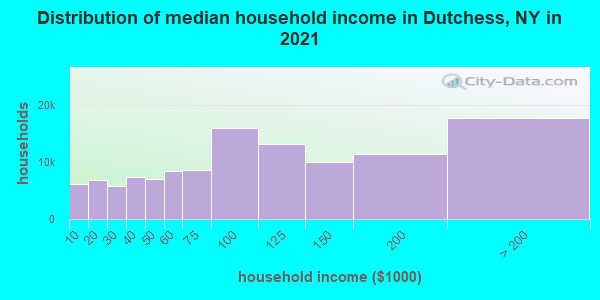
Estimated median household income in 2022: $90,889 ($53,086 in 1999)
| This county: | $90,889 |
| New York: | $79,557 |
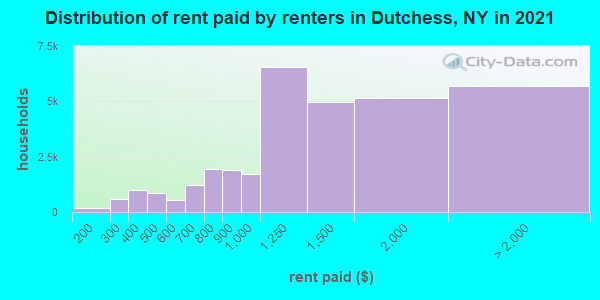
Median contract rent in 2022 for apartments: $1,301 (lower quartile is $991, upper quartile is $1,701)
| This county: | $1301 |
| State: | $1354 |
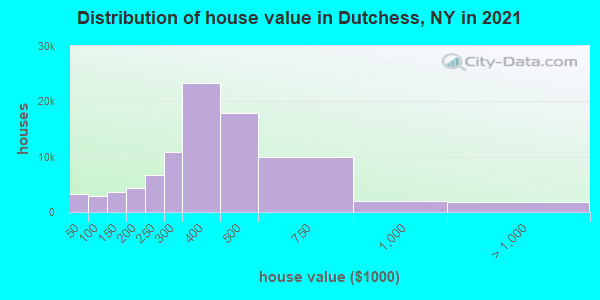
Estimated median house or condo value in 2022: $374,800 (it was $150,800 in 2000)
| Dutchess: | $374,800 |
| New York: | $400,400 |
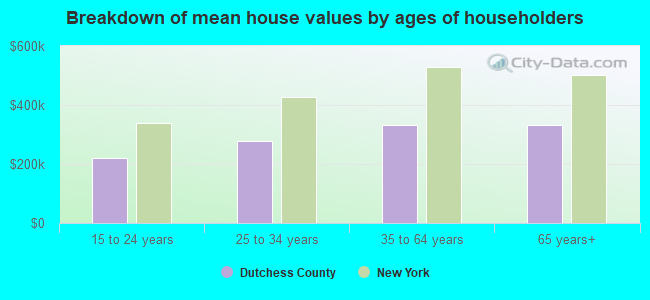
Mean price in 2022:
Median monthly housing costs for homes and condos with a mortgage: $2,480Detached houses: $452,020
Here: $452,020 State: $476,719 Townhouses or other attached units: $307,694
Here: $307,694 State: $699,270 In 2-unit structures: $268,927
Here: $268,927 State: $713,077 In 3-to-4-unit structures: $222,482
Here: $222,482 State: $764,568 In 5-or-more-unit structures: $275,815
Here: $275,815 State: $912,009 Mobile homes: $90,593
Here: $90,593 State: $88,925
Median monthly housing costs for units without a mortgage: $1,018
Institutionalized population: 8,812
Crime in 2021 (reported by the sheriff's office or county police, not the county total):
- Murders: 1
- Rapes: 9
- Robberies: 0
- Assaults: 18
- Burglaries: 28
- Thefts: 275
- Auto thefts: 29
Crime in 2020 (reported by the sheriff's office or county police, not the county total):
- Murders: 0
- Rapes: 11
- Robberies: 4
- Assaults: 19
- Burglaries: 42
- Thefts: 308
- Auto thefts: 26
Health of residents in Dutchess County based on CDC Behavioral Risk Factor Surveillance System Survey Questionnaires from 2013 to 2021:
General health status score of residents in this county from 1 (poor) to 5 (excellent) is 3.5. This is about average.72.2% of residents exercised in the past month. This is about average.
43.4% of residents smoked 100+ cigarettes in their lives. This is about average.
57.2% of adult residents drank alcohol in the past 30 days. This is less than average.
70.2% of residents visited a dentist within the past year. This is about average.
Average weight of males is 198 pounds. This is about average.
Average weight of females is 163 pounds. This is about average.
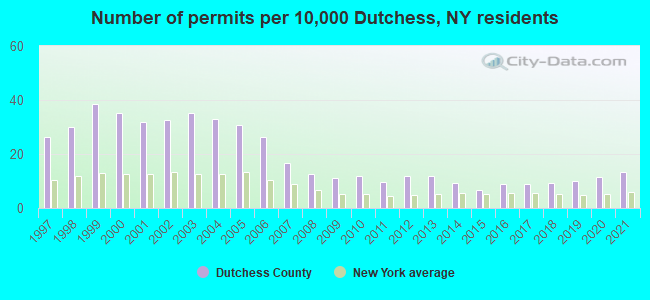
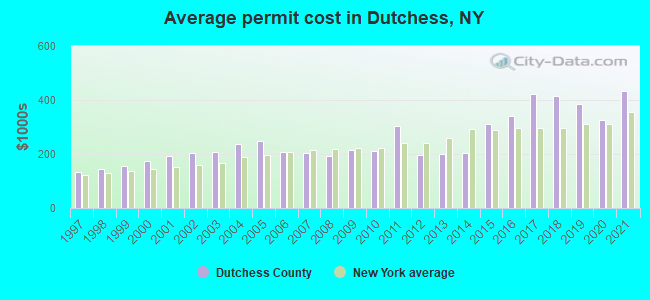
Single-family new house construction building permits:
- 2022: 346 buildings, average cost: $549,600
- 2021: 374 buildings, average cost: $433,300
- 2020: 323 buildings, average cost: $325,300
- 2019: 284 buildings, average cost: $386,100
- 2018: 257 buildings, average cost: $414,700
- 2017: 252 buildings, average cost: $423,900
- 2016: 244 buildings, average cost: $339,000
- 2015: 182 buildings, average cost: $312,400
- 2014: 262 buildings, average cost: $204,800
- 2013: 334 buildings, average cost: $198,600
- 2012: 328 buildings, average cost: $195,400
- 2011: 266 buildings, average cost: $302,200
- 2010: 336 buildings, average cost: $210,700
- 2009: 312 buildings, average cost: $215,600
- 2008: 354 buildings, average cost: $191,800
- 2007: 472 buildings, average cost: $204,800
- 2006: 736 buildings, average cost: $209,300
- 2005: 858 buildings, average cost: $248,100
- 2004: 926 buildings, average cost: $237,900
- 2003: 986 buildings, average cost: $206,100
- 2002: 909 buildings, average cost: $202,600
- 2001: 890 buildings, average cost: $193,100
- 2000: 983 buildings, average cost: $173,900
- 1999: 1075 buildings, average cost: $157,300
- 1998: 838 buildings, average cost: $146,100
- 1997: 736 buildings, average cost: $131,700
Median real estate property taxes paid for housing units with mortgages in 2022: $7,148 (1.8%)
Median real estate property taxes paid for housing units with no mortgage in 2022: $6,554 (1.9%)
| Dutchess County: | 9.0% |
| New York: | 14.3% |
Median age of residents in 2022: 42.8 years old
(Males: 41.3 years old, Females: 44.2 years old)
(Median age for: White residents: 48.1 years old, Black residents: 40.0 years old, American Indian residents: 39.5 years old, Asian residents: 45.0 years old, Hispanic or Latino residents: 32.4 years old, Other race residents: 32.7 years old)
Area name: Poughkeepsie-Newburgh-Middletown, NY MSA
Fair market rent in 2006 for a 1-bedroom apartment in Dutchess County is $815 a month.
Fair market rent for a 2-bedroom apartment is $998 a month.
Fair market rent for a 3-bedroom apartment is $1224 a month.
Cities in this county include: Poughkeepsie, Wappinger, East Fishkill, Hyde Park, La Grange, Beacon, Arlington, Beekman, Dover, Myers Corner.
| City or Town | Homes measured | Living Area | Basement | ||
|---|---|---|---|---|---|
| Homes Above 4 pCi/L Best Estimate (%) | Homes Above 4 pCi/L Range (%) | Homes Above 4 pCi/L Best Estimate (%) | Homes Above 4 pCi/L Range (%) | ||
| Amenia town | 23 | 24 | 19 - 29 | 58 | 52 - 65 |
| Beacon city | 30 | 13 | 10 - 17 | 40 | 34 - 46 |
| Beekman town | 92 | 19 | 16 - 22 | 52 | 48 - 57 |
| Clinton town | 58 | 17 | 14 - 21 | 52 | 47 - 57 |
| Dover town | 27 | 22 | 17 - 27 | 56 | 49 - 63 |
| East Fishkill town | 279 | 18 | 16 - 20 | 54 | 52 - 57 |
| Fishkill town | 118 | 10 | 8 - 12 | 35 | 32 - 39 |
| Hyde Park town | 197 | 16 | 14 - 18 | 51 | 48 - 54 |
| La Grange town | 254 | 18 | 16 - 20 | 52 | 49 - 54 |
| Milan town | 14 | 21 | 16 - 27 | 55 | 48 - 64 |
| North East town | 13 | 20 | 14 - 26 | 53 | 44 - 60 |
| Pawling town | 59 | 11 | 8 - 14 | 38 | 33 - 43 |
| Pine Plains town | 32 | 38 | 31 - 45 | 74 | 68 - 81 |
| Pleasant Valley town | 107 | 25 | 21 - 28 | 62 | 58 - 66 |
| Poughkeepsie city | 179 | 10 | 9 - 12 | 41 | 38 - 43 |
| Poughkeepsie town | 575 | 15 | 13 - 16 | 47 | 46 - 49 |
| Red Hook town | 108 | 16 | 14 - 19 | 46 | 43 - 50 |
| Rhinebeck town | 87 | 17 | 13 - 19 | 51 | 47 - 55 |
| Stanford town | 56 | 17 | 13 - 20 | 49 | 43 - 54 |
| Union Vale town | 58 | 23 | 19 - 27 | 56 | 51 - 61 |
| Wappinger town | 246 | 9 | 8 - 11 | 34 | 32 - 36 |
| Washington town | 55 | 20 | 16 - 24 | 51 | 46 - 57 |
| Dutchess county | 2667 | 16 | 47 | ||
2023 air pollution in Dutchess County:
Ozone (1-hour): 0.030 ppm (standard limit: 0.12 ppm). Near U.S. average.
Neighboring counties: Blaine County, Nebraska  , Franklin County, Idaho , Hillsdale County, Michigan , Jackson County, Michigan , Lake County, Indiana , LaPorte County, Indiana , Ottawa County, Ohio .
| Here: | 3.6% |
| New York: | 4.4% |
Current college students: 20,086
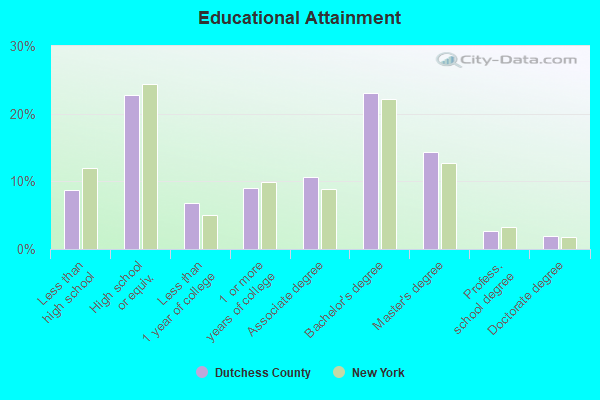
People 25 years of age or older with a high school degree or higher: 91.5%
People 25 years of age or older with a bachelor's degree or higher: 42.0%
Number of foreign born residents: 35,997 (64.3% naturalized citizens)
| Dutchess County: | 12.1% |
| Whole state: | 22.7% |
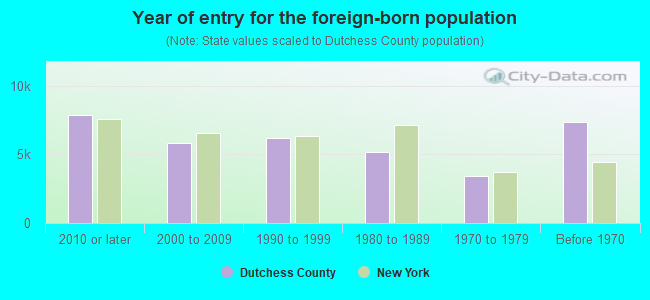
- Year of entry for the foreign-born population
- 9,3142010 or later
- 7,5632000 to 2009
- 7,8001990 to 1999
- 5,1411980 to 1989
- 3,4041970 to 1979
- 7,376Before 1970
Mean travel time to work (commute): minutes
Percentage of county residents living and working in this county: 95.7%
Housing units in structures:
- One, detached: 74,970
- One, attached: 7,641
- Two: 7,878
- 3 or 4: 10,076
- 5 to 9: 5,397
- 10 to 19: 4,513
- 20 to 49: 4,094
- 50 or more: 4,846
- Mobile homes: 3,701
Housing units in Dutchess County with a mortgage: 51,454 (6,095 second mortgage, 0 home equity loan, 5,494 both second mortgage and home equity loan)
Houses without a mortgage: 1,812
| Here: | 98.1% with mortgage |
| State: | 95.5% with mortgage |
Religion statistics for Dutchess County
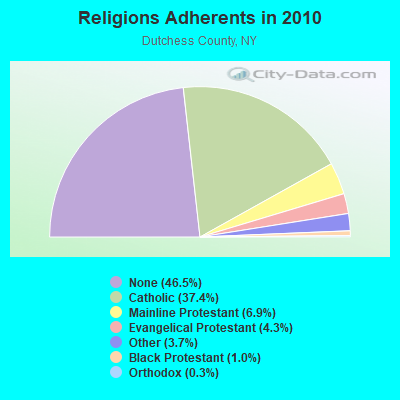
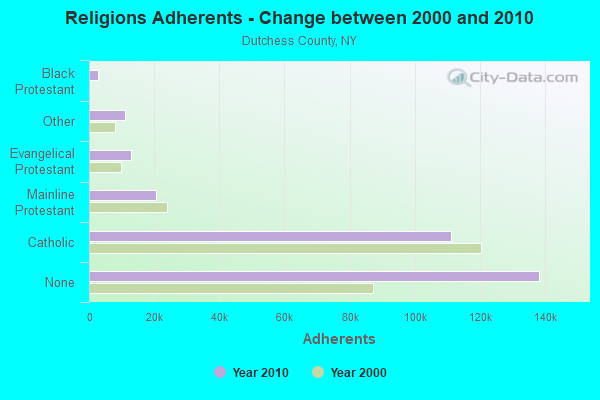
| Religion | Adherents | Congregations |
|---|---|---|
| Catholic | 111,112 | 22 |
| Mainline Protestant | 20,556 | 87 |
| Evangelical Protestant | 12,799 | 69 |
| Other | 10,970 | 28 |
| Black Protestant | 2,898 | 11 |
| Orthodox | 854 | 5 |
| None | 138,299 | - |
Source: Clifford Grammich, Kirk Hadaway, Richard Houseal, Dale E.Jones, Alexei Krindatch, Richie Stanley and Richard H.Taylor. 2012. 2010 U.S.Religion Census: Religious Congregations & Membership Study. Association of Statisticians of American Religious Bodies. Jones, Dale E., et al. 2002. Congregations and Membership in the United States 2000. Nashville, TN: Glenmary Research Center.
Food Environment Statistics:
| Dutchess County: | 3.42 / 10,000 pop. |
| State: | 4.13 / 10,000 pop. |
| Here: | 0.10 / 10,000 pop. |
| New York: | 0.06 / 10,000 pop. |
| This county: | 1.16 / 10,000 pop. |
| New York: | 0.92 / 10,000 pop. |
| Dutchess County: | 2.63 / 10,000 pop. |
| New York: | 1.68 / 10,000 pop. |
| This county: | 10.33 / 10,000 pop. |
| State: | 8.82 / 10,000 pop. |
| Dutchess County: | 8.1% |
| New York: | 8.2% |
| Dutchess County: | 24.4% |
| State: | 23.8% |
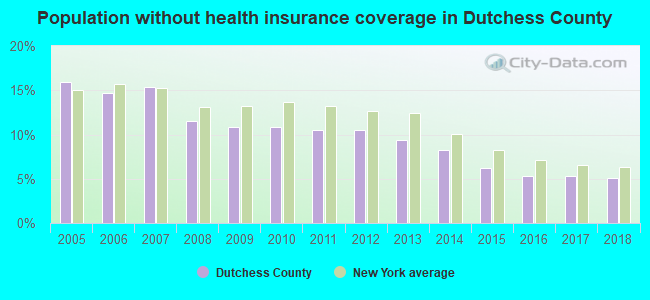
| Here: | 13.4% |
| State: | 15.6% |
Agriculture in Dutchess County:
Average size of farms: 168 acresAverage value of agricultural products sold per farm: $47,544
Average value of crops sold per acre for harvested cropland: $485.76
The value of nursery, greenhouse, floriculture, and sod as a percentage of the total market value of agricultural products sold: 26.77%
The value of livestock, poultry, and their products as a percentage of the total market value of agricultural products sold: 33.32%
Average total farm production expenses per farm: $53,226
Harvested cropland as a percentage of land in farms: 38.75%
Irrigated harvested cropland as a percentage of land in farms: 2.81%
Average market value of all machinery and equipment per farm: $58,787
The percentage of farms operated by a family or individual: 74.51%
Average age of principal farm operators: 56 years
Average number of cattle and calves per 100 acres of all land in farms: 7.87
Milk cows as a percentage of all cattle and calves: 32.38%
Corn for grain: 5819 harvested acres
All wheat for grain: 222 harvested acres
Vegetables: 2,410 harvested acres
Land in orchards: 824 acres
Earthquake activity:
Dutchess County-area historical earthquake activity is significantly above New York state average. It is 68% smaller than the overall U.S. average.On 10/7/1983 at 10:18:46, a magnitude 5.3 (5.1 MB, 5.3 LG, 5.1 ML, Class: Moderate, Intensity: VI - VII) earthquake occurred 157.0 miles away from Dutchess County center
On 4/20/2002 at 10:50:47, a magnitude 5.3 (5.3 ML, Depth: 3.0 mi) earthquake occurred 193.4 miles away from the county center
On 4/20/2002 at 10:50:47, a magnitude 5.2 (5.2 MB, 4.2 MS, 5.2 MW, 5.0 MW) earthquake occurred 191.6 miles away from the county center
On 8/23/2011 at 17:51:04, a magnitude 5.8 (5.8 MW, Depth: 3.7 mi) earthquake occurred 342.7 miles away from the county center
On 1/19/1982 at 00:14:42, a magnitude 4.7 (4.5 MB, 4.7 MD, 4.5 LG, Class: Light, Intensity: IV - V) earthquake occurred 166.8 miles away from Dutchess County center
On 1/16/1994 at 01:49:16, a magnitude 4.6 (4.6 MB, 4.6 LG, Depth: 3.1 mi) earthquake occurred 150.8 miles away from the county center
Magnitude types: regional Lg-wave magnitude (LG), body-wave magnitude (MB), duration magnitude (MD), local magnitude (ML), surface-wave magnitude (MS), moment magnitude (MW)
Most recent natural disasters:
- New York Covid-19 Pandemic, Incident Period: January 20, 2020, Major Disaster (Presidential) Declared DR-4480-NY: March 20, 2020, FEMA Id: 4480, Natural disaster type: Other
- New York Severe Winter Storm And Snowstorm, Incident Period: March 14, 2017 - March 15, 2017, FEMA Id: 4322, Natural disaster type: Snowstorm, Winter Storm
- New York Hurricane Sandy, Incident Period: October 27, 2012 to November 09, 2012, Emergency Declared EM-3351: October 28, 2012, FEMA Id: 3351, Natural disaster type: Hurricane
- New York Hurricane Irene, Incident Period: August 26, 2011 to September 05, 2011, Major Disaster (Presidential) Declared DR-4020: August 31, 2011, FEMA Id: 4020, Natural disaster type: Hurricane
- New York Severe Storms and Inland and Coastal Flooding, Incident Period: April 14, 2007 to April 18, 2007, Major Disaster (Presidential) Declared DR-1692: April 24, 2007, FEMA Id: 1692, Natural disaster type: Storm, Flood
- New York Hurricane Katrina Evacuation, Incident Period: August 29, 2005 to October 01, 2005, Emergency Declared EM-3262: September 30, 2005, FEMA Id: 3262, Natural disaster type: Hurricane
- New York Power Outage, Incident Period: August 14, 2003 to August 16, 2003, Emergency Declared EM-3186: August 23, 2003, FEMA Id: 3186, Natural disaster type: Power Outage
- New York Snowstorm, Incident Period: February 17, 2003 to February 18, 2003, Emergency Declared EM-3184: March 27, 2003, FEMA Id: 3184, Natural disaster type: Snowstorm
- New York Terrorist Attack, Incident Period: September 11, 2001, Major Disaster (Presidential) Declared DR-1391: September 11, 2001, FEMA Id: 1391, Natural disaster type: Other
- New York Virus Threat, Incident Period: May 22, 2000 to November 01, 2000, Emergency Declared EM-3155: October 11, 2000, FEMA Id: 3155, Natural disaster type: Other
- 9 other natural disasters have been reported since 1953.
The number of natural disasters in Dutchess County (19) is greater than the US average (15).
Major Disasters (Presidential) Declared: 12
Emergencies Declared: 6
Causes of natural disasters: Storms: 5, Floods: 4, Hurricanes: 4, Blizzards: 2, Snowstorms: 2, Winter Storms: 2, Power Outage: 1, Water Shortage: 1, Other: 3 (Note: some incidents may be assigned to more than one category).
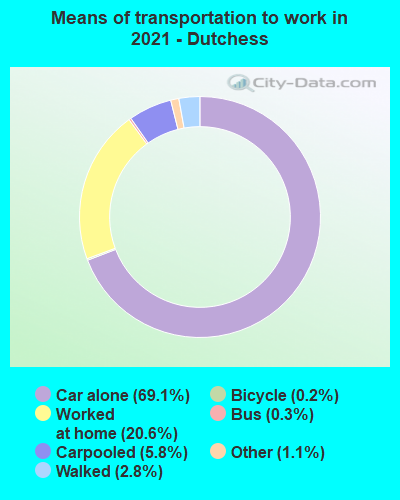
Means of transportation to work:
- Drove a car alone: 88,018 (69.2%)
- Carpooled: 8,185 (6.4%)
- Bus: 263 (0.2%)
- Subway or elevated rail: 147 (0.1%)
- Long-distance train or commuter rail: 563 (0.4%)
- Taxicab, motorcycle, or other means: 1,886 (1.5%)
- Bicycle: 120 (0.1%)
- Walked: 4,749 (3.7%)
- Worked at home: 23,212 (18.3%)
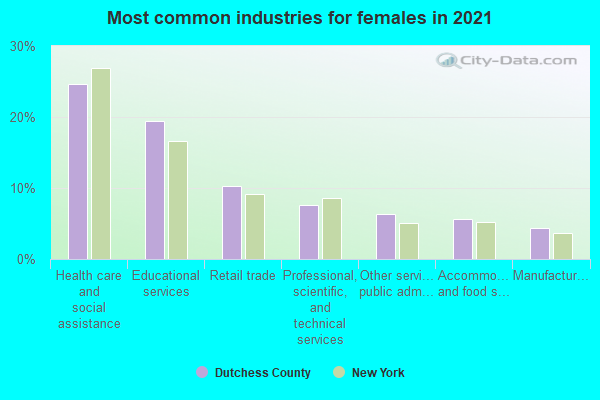
- Educational services (20%)
- Health care and social assistance (20%)
- Retail trade (12%)
- Professional, scientific, and technical services (7%)
- Accommodation and food services (6%)
- Finance and insurance (5%)
- Public administration (4%)
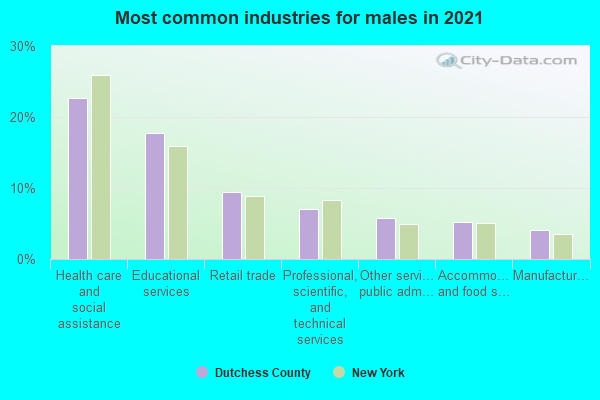
- Educational services (22%)
- Health care and social assistance (21%)
- Retail trade (13%)
- Professional, scientific, and technical services (7%)
- Accommodation and food services (7%)
- Finance and insurance (5%)
- Public administration (4%)
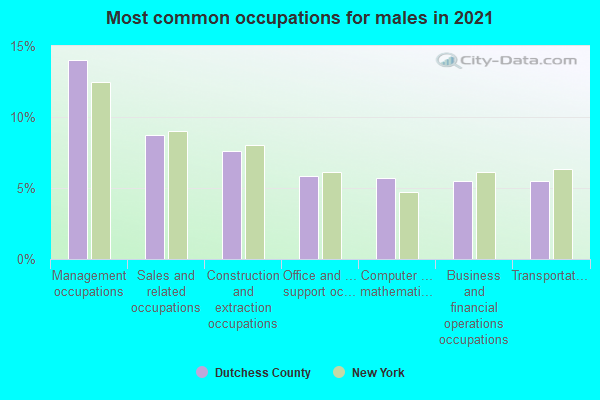
- Management occupations (12%)
- Sales and related occupations (9%)
- Construction and extraction occupations (9%)
- Computer and mathematical occupations (7%)
- Installation, maintenance, and repair occupations (6%)
- Business and financial operations occupations (6%)
- Building and grounds cleaning and maintenance occupations (5%)
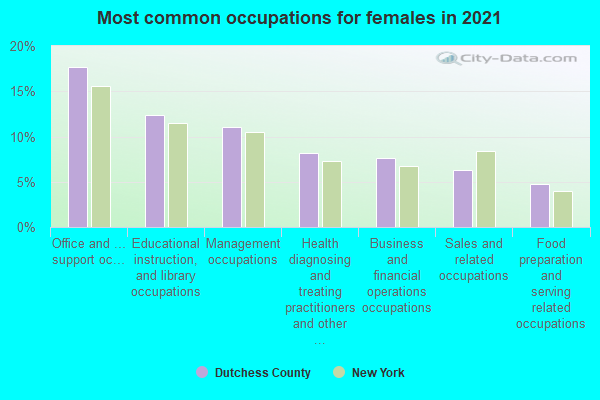
- Office and administrative support occupations (18%)
- Educational instruction, and library occupations (14%)
- Sales and related occupations (12%)
- Management occupations (9%)
- Health diagnosing and treating practitioners and other technical occupations (8%)
- Healthcare support occupations (6%)
- Business and financial operations occupations (6%)
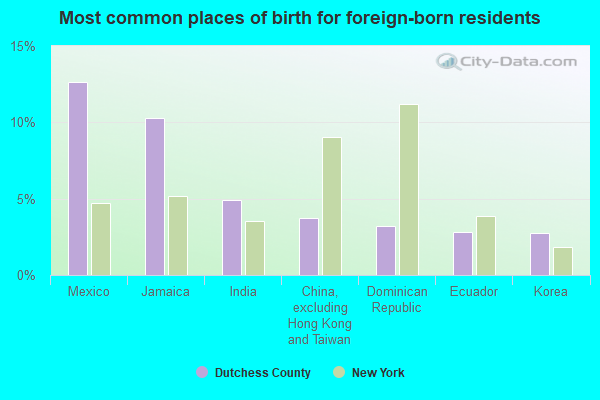
- Mexico (13%)
- Jamaica (10%)
- India (5%)
- Ecuador (4%)
- China, excluding Hong Kong and Taiwan (4%)
- Dominican Republic (3%)
- Canada (3%)
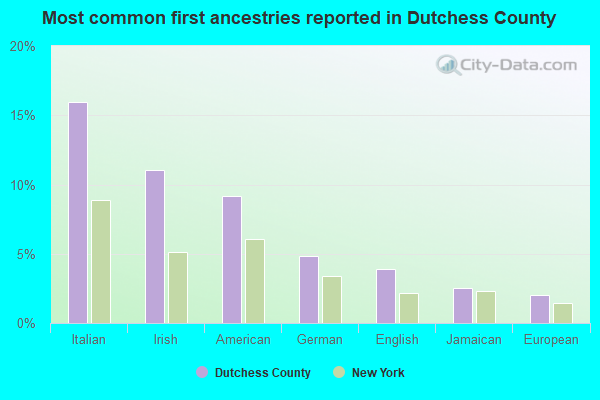
- Italian (16%)
- American (10%)
- Irish (10%)
- German (5%)
- English (4%)
- Jamaican (2%)
- European (2%)
People in group quarters in Dutchess County, New York in 2010:
- 8,262 people in college/university student housing
- 5,392 people in state prisons
- 2,300 people in nursing facilities/skilled-nursing facilities
- 936 people in group homes intended for adults
- 747 people in workers' group living quarters and job corps centers
- 621 people in residential treatment centers for adults
- 367 people in local jails and other municipal confinement facilities
- 311 people in other noninstitutional facilities
- 276 people in emergency and transitional shelters (with sleeping facilities) for people experiencing homelessness
- 254 people in residential treatment centers for juveniles (non-correctional)
- 192 people in residential schools for people with disabilities
- 135 people in group homes for juveniles (non-correctional)
- 120 people in mental (psychiatric) hospitals and psychiatric units in other hospitals
- 21 people in correctional facilities intended for juveniles
- 17 people in in-patient hospice facilities
- 14 people in hospitals with patients who have no usual home elsewhere
People in group quarters in Dutchess County, New York in 2000:
- 6,403 people in college dormitories (includes college quarters off campus)
- 6,142 people in state prisons
- 1,820 people in nursing homes
- 764 people in other noninstitutional group quarters
- 651 people in homes for the mentally retarded
- 465 people in homes or halfway houses for drug/alcohol abuse
- 369 people in mental (psychiatric) hospitals or wards
- 289 people in local jails and other confinement facilities (including police lockups)
- 278 people in other group homes
- 190 people in homes for the mentally ill
- 180 people in training schools for juvenile delinquents
- 162 people in religious group quarters
- 111 people in schools, hospitals, or wards for the intellectually disabled
- 90 people in hospitals/wards and hospices for chronically ill
- 90 people in hospices or homes for chronically ill
- 83 people in hospitals or wards for drug/alcohol abuse
- 75 people in other nonhousehold living situations
- 45 people in homes for abused, dependent, and neglected children
- 37 people in residential treatment centers for emotionally disturbed children
- 9 people in wards in general hospitals for patients who have no usual home elsewhere
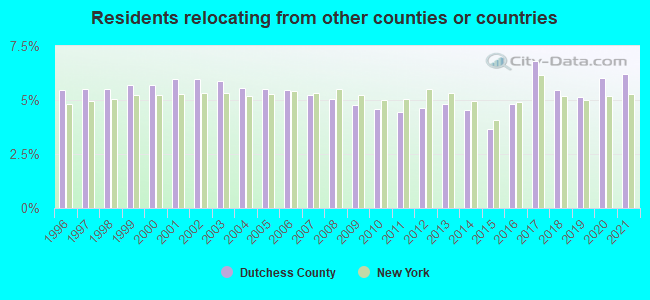
6.22% of this county's 2021 resident taxpayers lived in other counties in 2020 ($108,054 average adjusted gross income)
| Here: | 6.22% |
| New York average: | 5.29% |
10 or fewer of this county's residents moved from foreign countries.
4.54% relocated from other counties in New York ($87,457 average AGI)
1.69% relocated from other states ($20,597 average AGI)
Dutchess County: 1.69% New York average: 1.86%
Top counties from which taxpayers relocated into this county between 2020 and 2021:
| from Westchester County, NY | |
| from New York County, NY | |
| from Kings County, NY | |
| from Putnam County, NY | |
| from Orange County, NY | |
| from Ulster County, NY | |
| from Bronx County, NY |
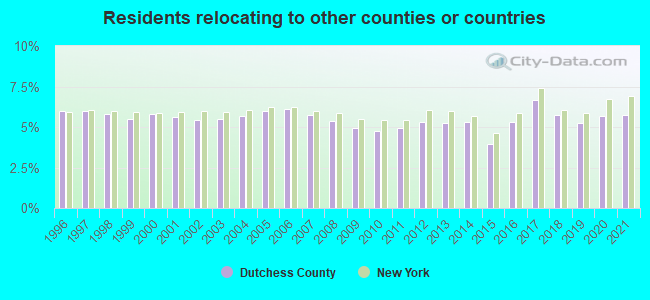
5.75% of this county's 2020 resident taxpayers moved to other counties in 2021 ($90,395 average adjusted gross income)
| Here: | 5.75% |
| New York average: | 6.93% |
10 or fewer of this county's residents moved to foreign countries.
2.69% relocated to other counties in New York ($36,922 average AGI)
3.05% relocated to other states ($53,473 average AGI)
Dutchess County: 3.05% New York average: 3.55%
Top counties to which taxpayers relocated from this county between 2020 and 2021:
| to Ulster County, NY | |
| to Orange County, NY | |
| to Westchester County, NY | |
| to Putnam County, NY | |
| to New York County, NY | |
| to Fairfield County, CT | |
| to Kings County, NY |
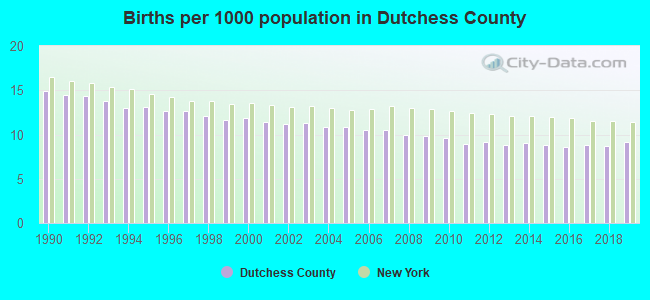
Births per 1000 population from 1990 to 1999: 13.3
Births per 1000 population from 2000 to 2009: 10.8
Births per 1000 population from 2010 to 2022: 7.6
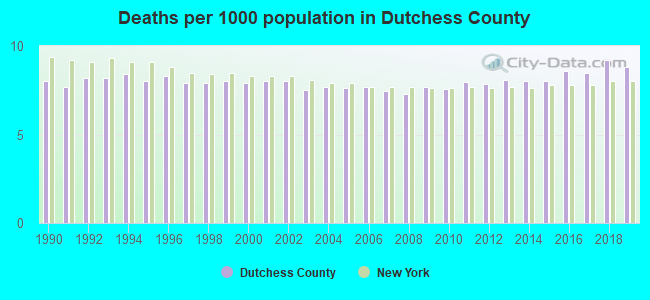
Deaths per 1000 population from 1990 to 1999: 8.1
Deaths per 1000 population from 2000 to 2009: 7.7
Deaths per 1000 population from 2010 to 2020: 8.4
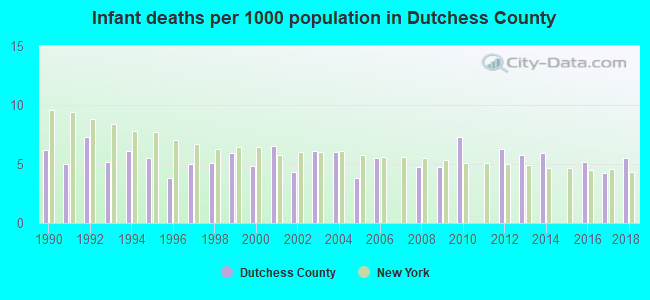
Infant deaths per 1000 live births from 1990 to 1999: 5.5
Infant deaths per 1000 live births from 2000 to 2009: 4.7
Infant deaths per 1000 live births from 2010 to 2021: 3.7
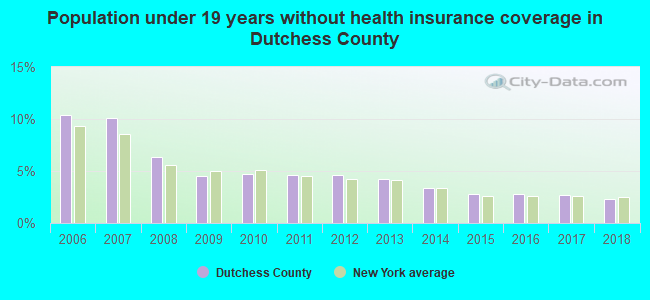
Persons under 19 years old without health insurance coverage in 2018: 2.3%

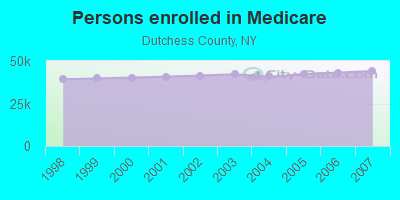
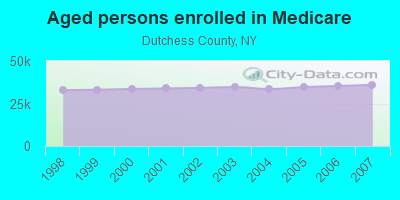
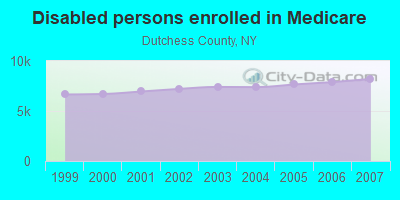
Persons enrolled in hospital insurance and/or supplemental medical insurance (Medicare) in July 1, 2007: 44,140 (35,937 aged, 8,203 disabled)
Children under 18 without health insurance coverage in 2007: 5,082 (7%)
Most common underlying causes of death in Dutchess County, New York in 1999 - 2019:
- Atherosclerotic heart disease (5,180)
- Bronchus or lung, unspecified - Malignant neoplasms (3,073)
- Acute myocardial infarction, unspecified (2,524)
- Chronic obstructive pulmonary disease, unspecified (1,994)
- Unspecified dementia (1,339)
- Atherosclerotic cardiovascular disease, so described (1,170)
- Stroke, not specified as haemorrhage or infarction (1,170)
- Pneumonia, unspecified (1,068)
- Septicaemia, unspecified (1,027)
- Congestive heart failure (1,007)
Population without health insurance coverage in 2000: 10%
Children under 18 without health insurance coverage in 2000: 7%
Short term general hospital admissions per 100,000 population in 2004: 10,298
Short term general hospital beds per 100,000 population in 2004: 239
Emergency room visits per 100,000 population in 2004: 32,575
General practice office based MDs per 100,000 population in 2005: 1,071
Medical specialist MDs per 100,000 population in 2005: 788
Dentists per 100,000 population in 1998: 11
Total births per 100,000 population, July 2005 - July 2006 : 64
Total deaths per 100,000 population, July 2005 - July 2006: 78
Limited-service eating places per 100,000 population in 2005 : 17
Beer, wine & liquor stores per 100,000 population in 2005: 1
Homicides per 1,000,000 population from 2000 to 2006: 24.8. This is less than state average.
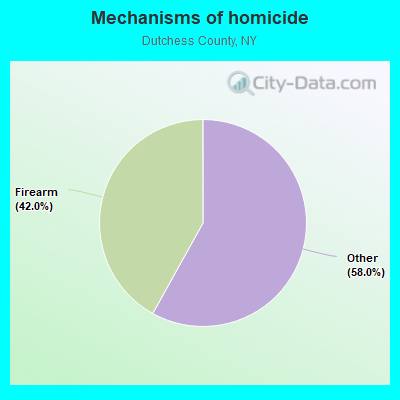
- Firearm - 10.4
- Other - 14.4
Suicides per 1,000,000 population from 2000 to 2006: 59.1. This is less than state average.
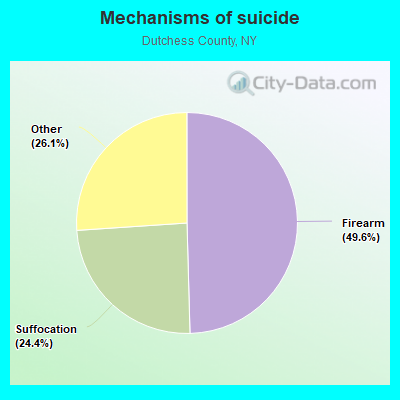
- Firearm - 29.3
- Suffocation - 14.4
- Other - 15.4
Household type by relationship:
Households: 297,545- Male householders: 55,942 (14,874 living alone), Female householders: 61,086 (20,123 living alone)
58,351 spouses (57,258 opposite-sex spouses), 7,400 unmarried partners, (6,678 opposite-sex unmarried partners), 76,632 children (73,071 natural, 773 adopted, 2,788 stepchildren), 4,765 grandchildren, 1,114 brothers or sisters, 2,674 parents, 24 foster children, 4,210 other relatives, 6,302 non-relatives
- In group quarters: 19,045
Size of family households: 33,868 2-persons, 17,005 3-persons, 15,392 4-persons, 5,814 5-persons, 1,353 6-persons, 629 7-or-more-persons.
Size of nonfamily households: 34,997 1-person, 6,659 2-persons, 929 3-persons, 288 4-persons, 94 5-persons.
35,861 married couples with children.
11,401 single-parent households (2,546 men, 8,855 women).
85.1% of residents of Dutchess speak English at home.
8.1% of residents speak Spanish at home (60% speak English very well, 21% speak English well, 14% speak English not well, 4% don't speak English at all).
3.9% of residents speak other Indo-European language at home (78% speak English very well, 15% speak English well, 6% speak English not well, 1% don't speak English at all).
1.9% of residents speak Asian or Pacific Island language at home (61% speak English very well, 23% speak English well, 14% speak English not well, 2% don't speak English at all).
1.0% of residents speak other language at home (80% speak English very well, 18% speak English well, 2% speak English not well).
In fiscal year 2004:
Federal Government expenditure: $1,390,631,000 ($4,740 per capita)
Department of Defense expenditure: $13,619,000
Federal direct payments to individuals for retirement and disability: $645,788,000
Federal other direct payments to individuals: $281,820,000
Federal direct payments not to individuals: $1,674,000
Federal grants: $364,793,000
Federal procurement contracts: $21,439,000 ($2,715,000 Department of Defense)
Federal salaries and wages: $75,118,000 ($672,000 Department of Defense)
Federal Government direct loans: $798,000
Federal guaranteed/insured loans: $57,512,000
Federal Government insurance: $117,571,000
Population change from April 1, 2000 to July 1, 2005:
Births: 17,097| Here: | 58 per 1000 residents |
| State: | 70 per 1000 residents |
Deaths: 11,736
| Here: | 40 per 1000 residents |
| State: | 42 per 1000 residents |
Net international migration: +3,927
| Here: | +13 per 1000 residents |
| State: | +35 per 1000 residents |
Net internal migration: +5,695
| Here: | |
| State: |
Total withdrawal of fresh water for public supply: 24.53 millions of gallons per day (48% from ground, 52% from surface)
| Here: | 6.8 |
| State: | 6.3 |
| Here: | 3.9 |
| State: | 3.8 |
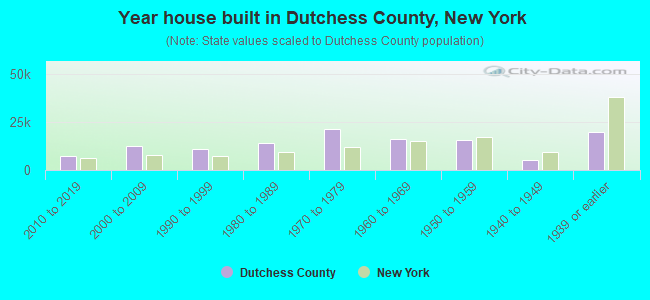
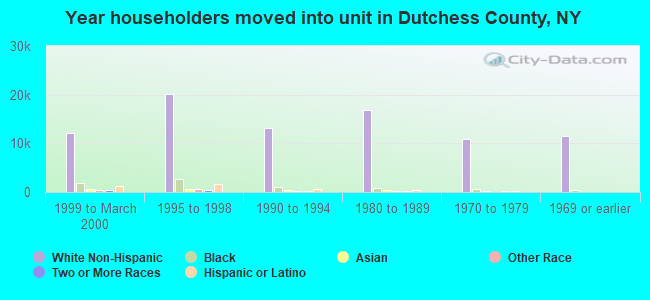
- Year house built in Dutchess County, New York
- 6822020 or later
- 5,8802010 to 2019
- 11,4502000 to 2009
- 10,3161990 to 1999
- 17,4301980 to 1989
- 16,7171970 to 1979
- 17,6741960 to 1969
- 15,1951950 to 1959
- 6,1921940 to 1949
- 21,5801939 or earlier
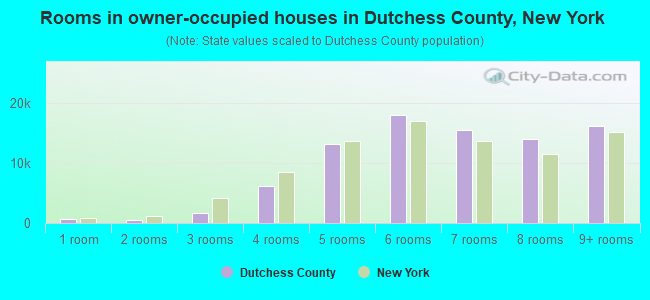
- Rooms in owner-occupied houses in Dutchess County, New York
- 471 room
- 3322 rooms
- 2,5553 rooms
- 6,0944 rooms
- 10,8425 rooms
- 16,5796 rooms
- 14,7257 rooms
- 11,7518 rooms
- 18,5569+ rooms
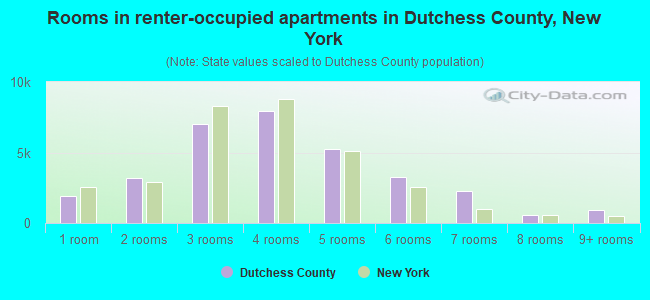
- Rooms in renter-occupied apartments in Dutchess County, New York
- 1,1721 room
- 3,8602 rooms
- 8,6293 rooms
- 9,7414 rooms
- 6,3885 rooms
- 4,0076 rooms
- 6107 rooms
- 2548 rooms
- 8869+ rooms
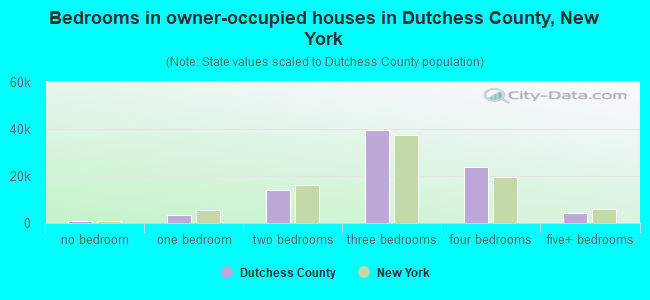
- Bedrooms in owner-occupied houses in Dutchess County, New York
- 99no bedroom
- 3,3301 bedroom
- 13,6932 bedrooms
- 38,0473 bedrooms
- 22,4504 bedrooms
- 3,8625+ bedrooms
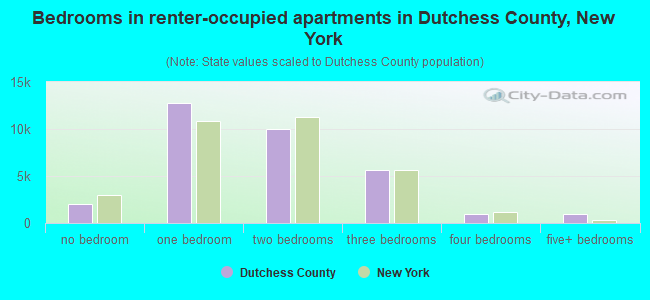
- Bedrooms in renter-occupied apartments in Dutchess County, New York
- 1,318no bedroom
- 14,0841 bedroom
- 12,6312 bedrooms
- 5,7363 bedrooms
- 1,2724 bedrooms
- 5065+ bedrooms
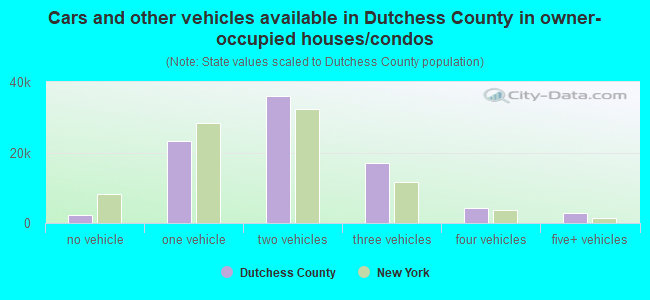
- Cars and other vehicles available in Dutchess County in owner-occupied houses/condos
- 2,474no vehicle
- 22,6031 vehicle
- 34,5112 vehicles
- 14,5603 vehicles
- 6,1094 vehicles
- 1,2245+ vehicles
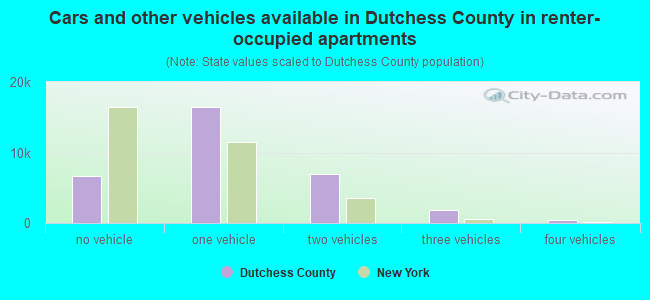
- Cars and other vehicles available in Dutchess County in renter-occupied apartments
- 5,005no vehicle
- 20,0391 vehicle
- 8,9982 vehicles
- 1,2293 vehicles
- 454 vehicles
- 2315+ vehicles
90.3% of Dutchess County residents lived in the same house 1 years ago.
Out of people who lived in different houses, 23% lived in this county.
Out of people who lived in different counties, 66% lived in New York.
| Dutchess County: | 90.3% |
| State average: | 89.6% |
Place of birth for U.S.-born residents:
- This state: 201,528
- Other state: 54,466
- Northeast: 27,868
- Midwest: 7,870
- South: 11,650
- West: 7,078
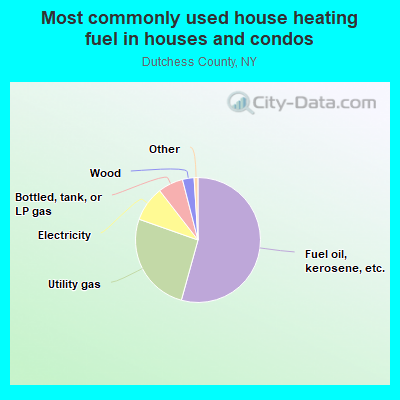
- 50.0%Fuel oil, kerosene, etc.
- 24.5%Utility gas
- 13.3%Electricity
- 8.4%Bottled, tank, or LP gas
- 2.1%Wood
- 0.8%Other fuel
- 0.6%Solar energy
- 0.3%No fuel used
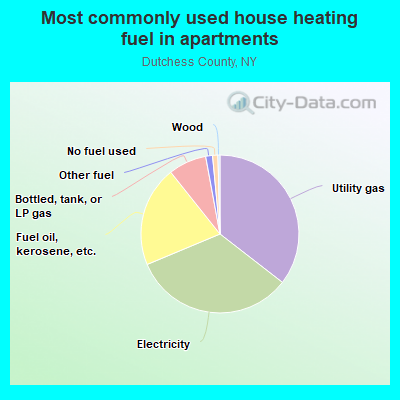
- 40.3%Utility gas
- 30.5%Electricity
- 22.4%Fuel oil, kerosene, etc.
- 5.6%Bottled, tank, or LP gas
- 0.6%Wood
- 0.2%Other fuel
- 0.2%No fuel used
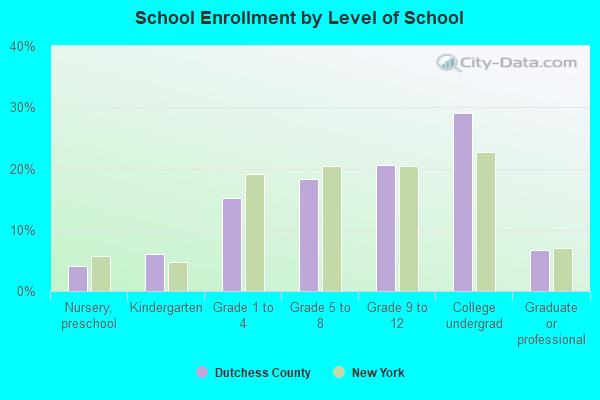
Private vs. public school enrollment:
| Here: | 11.6% |
| New York: | 15.6% |
| Here: | 6.3% |
| New York: | 15.0% |
| Here: | 60.8% |
| New York: | 39.2% |
Dutchess County government finances - Expenditure in 2020:
- Assistance and Subsidies - Public Welfare, Federal Categorical Assistance Programs: $8,786,000
Public Welfare, Cash Assistance Programs - Other: $8,398,000
Public Welfare, Federal Categorical Assistance Programs: $6,904,000
Public Welfare, Cash Assistance Programs - Other: $5,386,000
- Bond Funds - Cash and Securities: $36,143,000
Cash and Securities: $18,107,000
- Charges - Higher Education - Other: $21,869,000
Other: $20,312,000
Higher Education - Other: $19,438,000
Other: $19,132,000
Air Transportation: $955,000
Air Transportation: $926,000
Parks and Recreation: $256,000
Parks and Recreation: $224,000
Parking Facilities: $88,000
Parking Facilities: $85,000
- Construction - General - Other: $19,380,000
Regular Highways: $17,695,000
General - Other: $14,617,000
Regular Highways: $14,215,000
Parks and Recreation: $7,539,000
Parks and Recreation: $777,000
Police Protection: $445,000
Health - Other: $48,000
Health - Other: $44,000
- Current Operations - General - Other: $99,049,000
General - Other: $92,010,000
Public Welfare - Other: $76,364,000
Public Welfare - Other: $72,306,000
Other Higher Education: $68,528,000
Other Higher Education: $68,353,000
Health - Other: $63,099,000
Health - Other: $56,767,000
Correctional Institutions: $30,222,000
Correctional Institutions: $28,770,000
Police Protection: $16,566,000
Police Protection: $15,705,000
Corrections - Other: $13,899,000
Judicial and Legal Services: $13,353,000
Central Staff Services: $12,841,000
Corrections - Other: $12,596,000
Central Staff Services: $12,530,000
Judicial and Legal Services: $11,094,000
Regular Highways: $9,910,000
Regular Highways: $9,158,000
Public Welfare, Vendor Payments for Other Purposes: $5,332,000
General Public Buildings: $4,253,000
Financial Administration: $4,203,000
General Public Buildings: $4,166,000
Financial Administration: $3,903,000
Natural Resources - Other: $3,877,000
Natural Resources - Other: $3,659,000
Transit Utilities: $2,890,000
Transit Utilities: $2,807,000
Air Transportation: $2,623,000
Parks and Recreation: $2,211,000
Air Transportation: $1,953,000
Parks and Recreation: $1,910,000
Local Fire Protection: $874,000
Public Welfare, Vendor Payments for Other Purposes: $722,000
Local Fire Protection: $653,000
Housing and Community Development: $349,000
Solid Waste Management: $323,000
Housing and Community Development: $314,000
Solid Waste Management: $281,000
Public Welfare, Vendor Payments for Medical Care: $55,000
Parking Facilities: $49,000
Public Welfare, Vendor Payments for Medical Care: $28,000
Parking Facilities: $1,000
- Federal Intergovernmental - Highways: $10,957,000
Highways: $3,475,000
Housing and Community Development: $1,936,000
Housing and Community Development: $1,687,000
Other: $599,000
Other: $598,000
Health and Hospitals: $279,000
Health and Hospitals: $261,000
- General - Interest on Debt: $12,104,000
Interest on Debt: $5,608,000
- Intergovernmental to Local - Other - General - Other: $64,878,000
Other - General - Other: $56,451,000
Other - Financial Administration: $3,000
Other - Financial Administration: $3,000
- Intergovernmental to State - Public Welfare - Categorical Assistance Programs: $41,330,000
Public Welfare - Categorical Assistance Programs: $41,299,000
Transit Utilities: $10,884,000
Transit Utilities: $8,474,000
Corrections: $3,291,000
Corrections: $1,644,000
- Local Intergovernmental - Other: $702,000
Education: $680,000
Other: $573,000
Health and Hospitals: $40,000
Health and Hospitals: $30,000
- Long Term Debt - Beginning Outstanding - Public Debt for Private Purpose: $215,160,000
Outstanding Nonguaranteed - Industrial Revenue: $195,587,000
Beginning Outstanding - Public Debt for Private Purpose: $176,014,000
Outstanding Nonguaranteed - Industrial Revenue: $156,441,000
Outstanding Unspecified Public Purpose: $153,040,000
Beginning Outstanding - Unspecified Public Purpose: $133,375,000
Beginning Outstanding - Unspecified Public Purpose: $101,785,000
Outstanding Unspecified Public Purpose: $91,900,000
Issue, Unspecified Public Purpose: $47,805,000
Retired Unspecified Public Purpose: $28,140,000
Retired Nonguaranteed - Public Debt for Private Purpose: $19,573,000
Retired Nonguaranteed - Public Debt for Private Purpose: $19,573,000
Retired Unspecified Public Purpose: $14,885,000
Issue, Unspecified Public Purpose: $5,000,000
- Miscellaneous - General Revenue - Other: $15,591,000
General Revenue - Other: $9,899,000
Special Assessments: $3,448,000
Interest Earnings: $3,381,000
Special Assessments: $3,246,000
Interest Earnings: $929,000
Fines and Forfeits: $538,000
Rents: $526,000
Fines and Forfeits: $470,000
Rents: $410,000
Donations From Private Sources: $101,000
Donations From Private Sources: $70,000
- Other Capital Outlay - General - Other: $1,394,000
General - Other: $1,107,000
General Public Building: $587,000
Local Fire Protection: $230,000
Local Fire Protection: $88,000
Housing and Community Development: $82,000
Police Protection: $79,000
Housing and Community Development: $32,000
Public Welfare - Other: $32,000
Police Protection: $27,000
Health - Other: $16,000
Health - Other: $13,000
Parks and Recreation: $13,000
Corrections - Other: $12,000
Judicial and Legal Services: $12,000
Central Staff Services: $12,000
General Public Building: $9,000
Regular Highways: $7,000
Correctional Institutions: $6,000
Public Welfare - Other: $4,000
Regular Highways: $3,000
- Other Funds - Cash and Securities: $113,176,000
Cash and Securities: $110,865,000
- Sinking Funds - Cash and Securities: $195,833,000
Cash and Securities: $156,687,000
- State Intergovernmental - Public Welfare: $76,081,000
Public Welfare: $66,964,000
Health and Hospitals: $36,801,000
Health and Hospitals: $31,964,000
Other: $27,808,000
Other: $19,149,000
Highways: $11,584,000
Highways: $9,817,000
- Tax - General Sales and Gross Receipts: $240,700,000
General Sales and Gross Receipts: $212,291,000
Property: $112,597,000
Property: $110,594,000
Other Selective Sales: $3,305,000
Other Selective Sales: $2,806,000
Motor Vehicle License: $1,849,000
Other License: $919,000
Other License: $772,000
Other: $41,000
Other: $33,000
- Total Salaries and Wages: $130,520,000
: $121,116,000
Dutchess County government finances - Revenue in 2020:
- Assistance and Subsidies - Public Welfare, Federal Categorical Assistance Programs: $8,786,000
Public Welfare, Cash Assistance Programs - Other: $8,398,000
Public Welfare, Federal Categorical Assistance Programs: $6,904,000
Public Welfare, Cash Assistance Programs - Other: $5,386,000
- Bond Funds - Cash and Securities: $36,143,000
Cash and Securities: $18,107,000
- Charges - Higher Education - Other: $21,869,000
Other: $20,312,000
Higher Education - Other: $19,438,000
Other: $19,132,000
Air Transportation: $955,000
Air Transportation: $926,000
Parks and Recreation: $256,000
Parks and Recreation: $224,000
Parking Facilities: $88,000
Parking Facilities: $85,000
- Construction - General - Other: $19,380,000
Regular Highways: $17,695,000
General - Other: $14,617,000
Regular Highways: $14,215,000
Parks and Recreation: $7,539,000
Parks and Recreation: $777,000
Police Protection: $445,000
Health - Other: $48,000
Health - Other: $44,000
- Current Operations - General - Other: $99,049,000
General - Other: $92,010,000
Public Welfare - Other: $76,364,000
Public Welfare - Other: $72,306,000
Other Higher Education: $68,528,000
Other Higher Education: $68,353,000
Health - Other: $63,099,000
Health - Other: $56,767,000
Correctional Institutions: $30,222,000
Correctional Institutions: $28,770,000
Police Protection: $16,566,000
Police Protection: $15,705,000
Corrections - Other: $13,899,000
Judicial and Legal Services: $13,353,000
Central Staff Services: $12,841,000
Corrections - Other: $12,596,000
Central Staff Services: $12,530,000
Judicial and Legal Services: $11,094,000
Regular Highways: $9,910,000
Regular Highways: $9,158,000
Public Welfare, Vendor Payments for Other Purposes: $5,332,000
General Public Buildings: $4,253,000
Financial Administration: $4,203,000
General Public Buildings: $4,166,000
Financial Administration: $3,903,000
Natural Resources - Other: $3,877,000
Natural Resources - Other: $3,659,000
Transit Utilities: $2,890,000
Transit Utilities: $2,807,000
Air Transportation: $2,623,000
Parks and Recreation: $2,211,000
Air Transportation: $1,953,000
Parks and Recreation: $1,910,000
Local Fire Protection: $874,000
Public Welfare, Vendor Payments for Other Purposes: $722,000
Local Fire Protection: $653,000
Housing and Community Development: $349,000
Solid Waste Management: $323,000
Housing and Community Development: $314,000
Solid Waste Management: $281,000
Public Welfare, Vendor Payments for Medical Care: $55,000
Parking Facilities: $49,000
Public Welfare, Vendor Payments for Medical Care: $28,000
Parking Facilities: $1,000
- Federal Intergovernmental - Highways: $10,957,000
Highways: $3,475,000
Housing and Community Development: $1,936,000
Housing and Community Development: $1,687,000
Other: $599,000
Other: $598,000
Health and Hospitals: $279,000
Health and Hospitals: $261,000
- General - Interest on Debt: $12,104,000
Interest on Debt: $5,608,000
- Intergovernmental to Local - Other - General - Other: $64,878,000
Other - General - Other: $56,451,000
Other - Financial Administration: $3,000
Other - Financial Administration: $3,000
- Intergovernmental to State - Public Welfare - Categorical Assistance Programs: $41,330,000
Public Welfare - Categorical Assistance Programs: $41,299,000
Transit Utilities: $10,884,000
Transit Utilities: $8,474,000
Corrections: $3,291,000
Corrections: $1,644,000
- Local Intergovernmental - Other: $702,000
Education: $680,000
Other: $573,000
Health and Hospitals: $40,000
Health and Hospitals: $30,000
- Long Term Debt - Beginning Outstanding - Public Debt for Private Purpose: $215,160,000
Outstanding Nonguaranteed - Industrial Revenue: $195,587,000
Beginning Outstanding - Public Debt for Private Purpose: $176,014,000
Outstanding Nonguaranteed - Industrial Revenue: $156,441,000
Outstanding Unspecified Public Purpose: $153,040,000
Beginning Outstanding - Unspecified Public Purpose: $133,375,000
Beginning Outstanding - Unspecified Public Purpose: $101,785,000
Outstanding Unspecified Public Purpose: $91,900,000
Issue, Unspecified Public Purpose: $47,805,000
Retired Unspecified Public Purpose: $28,140,000
Retired Nonguaranteed - Public Debt for Private Purpose: $19,573,000
Retired Nonguaranteed - Public Debt for Private Purpose: $19,573,000
Retired Unspecified Public Purpose: $14,885,000
Issue, Unspecified Public Purpose: $5,000,000
- Miscellaneous - General Revenue - Other: $15,591,000
General Revenue - Other: $9,899,000
Special Assessments: $3,448,000
Interest Earnings: $3,381,000
Special Assessments: $3,246,000
Interest Earnings: $929,000
Fines and Forfeits: $538,000
Rents: $526,000
Fines and Forfeits: $470,000
Rents: $410,000
Donations From Private Sources: $101,000
Donations From Private Sources: $70,000
- Other Capital Outlay - General - Other: $1,394,000
General - Other: $1,107,000
General Public Building: $587,000
Local Fire Protection: $230,000
Local Fire Protection: $88,000
Housing and Community Development: $82,000
Police Protection: $79,000
Housing and Community Development: $32,000
Public Welfare - Other: $32,000
Police Protection: $27,000
Health - Other: $16,000
Health - Other: $13,000
Parks and Recreation: $13,000
Corrections - Other: $12,000
Judicial and Legal Services: $12,000
Central Staff Services: $12,000
General Public Building: $9,000
Regular Highways: $7,000
Correctional Institutions: $6,000
Public Welfare - Other: $4,000
Regular Highways: $3,000
- Other Funds - Cash and Securities: $113,176,000
Cash and Securities: $110,865,000
- Sinking Funds - Cash and Securities: $195,833,000
Cash and Securities: $156,687,000
- State Intergovernmental - Public Welfare: $76,081,000
Public Welfare: $66,964,000
Health and Hospitals: $36,801,000
Health and Hospitals: $31,964,000
Other: $27,808,000
Other: $19,149,000
Highways: $11,584,000
Highways: $9,817,000
- Tax - General Sales and Gross Receipts: $240,700,000
General Sales and Gross Receipts: $212,291,000
Property: $112,597,000
Property: $110,594,000
Other Selective Sales: $3,305,000
Other Selective Sales: $2,806,000
Motor Vehicle License: $1,849,000
Other License: $919,000
Other License: $772,000
Other: $41,000
Other: $33,000
- Total Salaries and Wages: $130,520,000
: $121,116,000
Dutchess County government finances - Debt in 2020:
- Assistance and Subsidies - Public Welfare, Federal Categorical Assistance Programs: $8,786,000
Public Welfare, Cash Assistance Programs - Other: $8,398,000
Public Welfare, Federal Categorical Assistance Programs: $6,904,000
Public Welfare, Cash Assistance Programs - Other: $5,386,000
- Bond Funds - Cash and Securities: $36,143,000
Cash and Securities: $18,107,000
- Charges - Higher Education - Other: $21,869,000
Other: $20,312,000
Higher Education - Other: $19,438,000
Other: $19,132,000
Air Transportation: $955,000
Air Transportation: $926,000
Parks and Recreation: $256,000
Parks and Recreation: $224,000
Parking Facilities: $88,000
Parking Facilities: $85,000
- Construction - General - Other: $19,380,000
Regular Highways: $17,695,000
General - Other: $14,617,000
Regular Highways: $14,215,000
Parks and Recreation: $7,539,000
Parks and Recreation: $777,000
Police Protection: $445,000
Health - Other: $48,000
Health - Other: $44,000
- Current Operations - General - Other: $99,049,000
General - Other: $92,010,000
Public Welfare - Other: $76,364,000
Public Welfare - Other: $72,306,000
Other Higher Education: $68,528,000
Other Higher Education: $68,353,000
Health - Other: $63,099,000
Health - Other: $56,767,000
Correctional Institutions: $30,222,000
Correctional Institutions: $28,770,000
Police Protection: $16,566,000
Police Protection: $15,705,000
Corrections - Other: $13,899,000
Judicial and Legal Services: $13,353,000
Central Staff Services: $12,841,000
Corrections - Other: $12,596,000
Central Staff Services: $12,530,000
Judicial and Legal Services: $11,094,000
Regular Highways: $9,910,000
Regular Highways: $9,158,000
Public Welfare, Vendor Payments for Other Purposes: $5,332,000
General Public Buildings: $4,253,000
Financial Administration: $4,203,000
General Public Buildings: $4,166,000
Financial Administration: $3,903,000
Natural Resources - Other: $3,877,000
Natural Resources - Other: $3,659,000
Transit Utilities: $2,890,000
Transit Utilities: $2,807,000
Air Transportation: $2,623,000
Parks and Recreation: $2,211,000
Air Transportation: $1,953,000
Parks and Recreation: $1,910,000
Local Fire Protection: $874,000
Public Welfare, Vendor Payments for Other Purposes: $722,000
Local Fire Protection: $653,000
Housing and Community Development: $349,000
Solid Waste Management: $323,000
Housing and Community Development: $314,000
Solid Waste Management: $281,000
Public Welfare, Vendor Payments for Medical Care: $55,000
Parking Facilities: $49,000
Public Welfare, Vendor Payments for Medical Care: $28,000
Parking Facilities: $1,000
- Federal Intergovernmental - Highways: $10,957,000
Highways: $3,475,000
Housing and Community Development: $1,936,000
Housing and Community Development: $1,687,000
Other: $599,000
Other: $598,000
Health and Hospitals: $279,000
Health and Hospitals: $261,000
- General - Interest on Debt: $12,104,000
Interest on Debt: $5,608,000
- Intergovernmental to Local - Other - General - Other: $64,878,000
Other - General - Other: $56,451,000
Other - Financial Administration: $3,000
Other - Financial Administration: $3,000
- Intergovernmental to State - Public Welfare - Categorical Assistance Programs: $41,330,000
Public Welfare - Categorical Assistance Programs: $41,299,000
Transit Utilities: $10,884,000
Transit Utilities: $8,474,000
Corrections: $3,291,000
Corrections: $1,644,000
- Local Intergovernmental - Other: $702,000
Education: $680,000
Other: $573,000
Health and Hospitals: $40,000
Health and Hospitals: $30,000
- Long Term Debt - Beginning Outstanding - Public Debt for Private Purpose: $215,160,000
Outstanding Nonguaranteed - Industrial Revenue: $195,587,000
Beginning Outstanding - Public Debt for Private Purpose: $176,014,000
Outstanding Nonguaranteed - Industrial Revenue: $156,441,000
Outstanding Unspecified Public Purpose: $153,040,000
Beginning Outstanding - Unspecified Public Purpose: $133,375,000
Beginning Outstanding - Unspecified Public Purpose: $101,785,000
Outstanding Unspecified Public Purpose: $91,900,000
Issue, Unspecified Public Purpose: $47,805,000
Retired Unspecified Public Purpose: $28,140,000
Retired Nonguaranteed - Public Debt for Private Purpose: $19,573,000
Retired Nonguaranteed - Public Debt for Private Purpose: $19,573,000
Retired Unspecified Public Purpose: $14,885,000
Issue, Unspecified Public Purpose: $5,000,000
- Miscellaneous - General Revenue - Other: $15,591,000
General Revenue - Other: $9,899,000
Special Assessments: $3,448,000
Interest Earnings: $3,381,000
Special Assessments: $3,246,000
Interest Earnings: $929,000
Fines and Forfeits: $538,000
Rents: $526,000
Fines and Forfeits: $470,000
Rents: $410,000
Donations From Private Sources: $101,000
Donations From Private Sources: $70,000
- Other Capital Outlay - General - Other: $1,394,000
General - Other: $1,107,000
General Public Building: $587,000
Local Fire Protection: $230,000
Local Fire Protection: $88,000
Housing and Community Development: $82,000
Police Protection: $79,000
Housing and Community Development: $32,000
Public Welfare - Other: $32,000
Police Protection: $27,000
Health - Other: $16,000
Health - Other: $13,000
Parks and Recreation: $13,000
Corrections - Other: $12,000
Judicial and Legal Services: $12,000
Central Staff Services: $12,000
General Public Building: $9,000
Regular Highways: $7,000
Correctional Institutions: $6,000
Public Welfare - Other: $4,000
Regular Highways: $3,000
- Other Funds - Cash and Securities: $113,176,000
Cash and Securities: $110,865,000
- Sinking Funds - Cash and Securities: $195,833,000
Cash and Securities: $156,687,000
- State Intergovernmental - Public Welfare: $76,081,000
Public Welfare: $66,964,000
Health and Hospitals: $36,801,000
Health and Hospitals: $31,964,000
Other: $27,808,000
Other: $19,149,000
Highways: $11,584,000
Highways: $9,817,000
- Tax - General Sales and Gross Receipts: $240,700,000
General Sales and Gross Receipts: $212,291,000
Property: $112,597,000
Property: $110,594,000
Other Selective Sales: $3,305,000
Other Selective Sales: $2,806,000
Motor Vehicle License: $1,849,000
Other License: $919,000
Other License: $772,000
Other: $41,000
Other: $33,000
- Total Salaries and Wages: $130,520,000
: $121,116,000
Dutchess County government finances - Cash and Securities in 2020:
- Assistance and Subsidies - Public Welfare, Federal Categorical Assistance Programs: $8,786,000
Public Welfare, Cash Assistance Programs - Other: $8,398,000
Public Welfare, Federal Categorical Assistance Programs: $6,904,000
Public Welfare, Cash Assistance Programs - Other: $5,386,000
- Bond Funds - Cash and Securities: $36,143,000
Cash and Securities: $18,107,000
- Charges - Higher Education - Other: $21,869,000
Other: $20,312,000
Higher Education - Other: $19,438,000
Other: $19,132,000
Air Transportation: $955,000
Air Transportation: $926,000
Parks and Recreation: $256,000
Parks and Recreation: $224,000
Parking Facilities: $88,000
Parking Facilities: $85,000
- Construction - General - Other: $19,380,000
Regular Highways: $17,695,000
General - Other: $14,617,000
Regular Highways: $14,215,000
Parks and Recreation: $7,539,000
Parks and Recreation: $777,000
Police Protection: $445,000
Health - Other: $48,000
Health - Other: $44,000
- Current Operations - General - Other: $99,049,000
General - Other: $92,010,000
Public Welfare - Other: $76,364,000
Public Welfare - Other: $72,306,000
Other Higher Education: $68,528,000
Other Higher Education: $68,353,000
Health - Other: $63,099,000
Health - Other: $56,767,000
Correctional Institutions: $30,222,000
Correctional Institutions: $28,770,000
Police Protection: $16,566,000
Police Protection: $15,705,000
Corrections - Other: $13,899,000
Judicial and Legal Services: $13,353,000
Central Staff Services: $12,841,000
Corrections - Other: $12,596,000
Central Staff Services: $12,530,000
Judicial and Legal Services: $11,094,000
Regular Highways: $9,910,000
Regular Highways: $9,158,000
Public Welfare, Vendor Payments for Other Purposes: $5,332,000
General Public Buildings: $4,253,000
Financial Administration: $4,203,000
General Public Buildings: $4,166,000
Financial Administration: $3,903,000
Natural Resources - Other: $3,877,000
Natural Resources - Other: $3,659,000
Transit Utilities: $2,890,000
Transit Utilities: $2,807,000
Air Transportation: $2,623,000
Parks and Recreation: $2,211,000
Air Transportation: $1,953,000
Parks and Recreation: $1,910,000
Local Fire Protection: $874,000
Public Welfare, Vendor Payments for Other Purposes: $722,000
Local Fire Protection: $653,000
Housing and Community Development: $349,000
Solid Waste Management: $323,000
Housing and Community Development: $314,000
Solid Waste Management: $281,000
Public Welfare, Vendor Payments for Medical Care: $55,000
Parking Facilities: $49,000
Public Welfare, Vendor Payments for Medical Care: $28,000
Parking Facilities: $1,000
- Federal Intergovernmental - Highways: $10,957,000
Highways: $3,475,000
Housing and Community Development: $1,936,000
Housing and Community Development: $1,687,000
Other: $599,000
Other: $598,000
Health and Hospitals: $279,000
Health and Hospitals: $261,000
- General - Interest on Debt: $12,104,000
Interest on Debt: $5,608,000
- Intergovernmental to Local - Other - General - Other: $64,878,000
Other - General - Other: $56,451,000
Other - Financial Administration: $3,000
Other - Financial Administration: $3,000
- Intergovernmental to State - Public Welfare - Categorical Assistance Programs: $41,330,000
Public Welfare - Categorical Assistance Programs: $41,299,000
Transit Utilities: $10,884,000
Transit Utilities: $8,474,000
Corrections: $3,291,000
Corrections: $1,644,000
- Local Intergovernmental - Other: $702,000
Education: $680,000
Other: $573,000
Health and Hospitals: $40,000
Health and Hospitals: $30,000
- Long Term Debt - Beginning Outstanding - Public Debt for Private Purpose: $215,160,000
Outstanding Nonguaranteed - Industrial Revenue: $195,587,000
Beginning Outstanding - Public Debt for Private Purpose: $176,014,000
Outstanding Nonguaranteed - Industrial Revenue: $156,441,000
Outstanding Unspecified Public Purpose: $153,040,000
Beginning Outstanding - Unspecified Public Purpose: $133,375,000
Beginning Outstanding - Unspecified Public Purpose: $101,785,000
Outstanding Unspecified Public Purpose: $91,900,000
Issue, Unspecified Public Purpose: $47,805,000
Retired Unspecified Public Purpose: $28,140,000
Retired Nonguaranteed - Public Debt for Private Purpose: $19,573,000
Retired Nonguaranteed - Public Debt for Private Purpose: $19,573,000
Retired Unspecified Public Purpose: $14,885,000
Issue, Unspecified Public Purpose: $5,000,000
- Miscellaneous - General Revenue - Other: $15,591,000
General Revenue - Other: $9,899,000
Special Assessments: $3,448,000
Interest Earnings: $3,381,000
Special Assessments: $3,246,000
Interest Earnings: $929,000
Fines and Forfeits: $538,000
Rents: $526,000
Fines and Forfeits: $470,000
Rents: $410,000
Donations From Private Sources: $101,000
Donations From Private Sources: $70,000
- Other Capital Outlay - General - Other: $1,394,000
General - Other: $1,107,000
General Public Building: $587,000
Local Fire Protection: $230,000
Local Fire Protection: $88,000
Housing and Community Development: $82,000
Police Protection: $79,000
Housing and Community Development: $32,000
Public Welfare - Other: $32,000
Police Protection: $27,000
Health - Other: $16,000
Health - Other: $13,000
Parks and Recreation: $13,000
Corrections - Other: $12,000
Judicial and Legal Services: $12,000
Central Staff Services: $12,000
General Public Building: $9,000
Regular Highways: $7,000
Correctional Institutions: $6,000
Public Welfare - Other: $4,000
Regular Highways: $3,000
- Other Funds - Cash and Securities: $113,176,000
Cash and Securities: $110,865,000
- Sinking Funds - Cash and Securities: $195,833,000
Cash and Securities: $156,687,000
- State Intergovernmental - Public Welfare: $76,081,000
Public Welfare: $66,964,000
Health and Hospitals: $36,801,000
Health and Hospitals: $31,964,000
Other: $27,808,000
Other: $19,149,000
Highways: $11,584,000
Highways: $9,817,000
- Tax - General Sales and Gross Receipts: $240,700,000
General Sales and Gross Receipts: $212,291,000
Property: $112,597,000
Property: $110,594,000
Other Selective Sales: $3,305,000
Other Selective Sales: $2,806,000
Motor Vehicle License: $1,849,000
Other License: $919,000
Other License: $772,000
Other: $41,000
Other: $33,000
- Total Salaries and Wages: $130,520,000
: $121,116,000
Supplemental Security Income (SSI) in 2006:
- Total number of recipients: 4,855
- Number of aged recipients: 623
- Number of blind and disabled recipients: 4,232
- Number of recipients under 18: 576
- Number of recipients between 18 and 64: 3,049
- Number of recipients older than 64: 1,230
- Number of recipients also receiving OASDI: 2,011
- Amount of payments (thousands of dollars): 2,309
| Home Mortgage Disclosure Act Aggregated Statistics For Year 2009 (Based on 64 full tracts) | ||||||||||||||
| A) FHA, FSA/RHS & VA Home Purchase Loans | B) Conventional Home Purchase Loans | C) Refinancings | D) Home Improvement Loans | E) Loans on Dwellings For 5+ Families | F) Non-occupant Loans on < 5 Family Dwellings (A B C & D) | G) Loans On Manufactured Home Dwelling (A B C & D) | ||||||||
|---|---|---|---|---|---|---|---|---|---|---|---|---|---|---|
| Number | Average Value | Number | Average Value | Number | Average Value | Number | Average Value | Number | Average Value | Number | Average Value | Number | Average Value | |
| LOANS ORIGINATED | 647 | $238,207 | 1,290 | $238,765 | 3,807 | $210,344 | 361 | $86,548 | 9 | $964,333 | 243 | $236,704 | 53 | $66,660 |
| APPLICATIONS APPROVED, NOT ACCEPTED | 50 | $220,700 | 159 | $256,893 | 349 | $257,501 | 42 | $77,667 | 1 | $155,000 | 38 | $377,342 | 15 | $75,933 |
| APPLICATIONS DENIED | 140 | $226,179 | 306 | $246,490 | 2,102 | $258,490 | 304 | $76,434 | 1 | $290,000 | 166 | $235,675 | 42 | $90,905 |
| APPLICATIONS WITHDRAWN | 105 | $222,876 | 220 | $235,395 | 1,444 | $240,251 | 93 | $123,000 | 0 | $0 | 77 | $220,935 | 12 | $77,167 |
| FILES CLOSED FOR INCOMPLETENESS | 17 | $218,471 | 53 | $267,642 | 319 | $278,853 | 20 | $194,900 | 1 | $3,000,000 | 17 | $383,118 | 6 | $66,833 |
| Private Mortgage Insurance Companies Aggregated Statistics For Year 2009 (Based on 62 full tracts) | ||||||
| A) Conventional Home Purchase Loans | B) Refinancings | C) Non-occupant Loans on < 5 Family Dwellings (A & B) | ||||
|---|---|---|---|---|---|---|
| Number | Average Value | Number | Average Value | Number | Average Value | |
| LOANS ORIGINATED | 261 | $247,636 | 109 | $272,844 | 1 | $197,000 |
| APPLICATIONS APPROVED, NOT ACCEPTED | 127 | $266,969 | 61 | $269,689 | 2 | $244,000 |
| APPLICATIONS DENIED | 76 | $247,842 | 38 | $283,763 | 0 | $0 |
| APPLICATIONS WITHDRAWN | 36 | $243,222 | 26 | $265,115 | 0 | $0 |
| FILES CLOSED FOR INCOMPLETENESS | 4 | $349,750 | 1 | $347,000 | 0 | $0 |
| Most common first names in Dutchess County, NY among deceased individuals | ||
| Name | Count | Lived (average) |
|---|---|---|
| John | 2,327 | 74.5 years |
| Mary | 2,228 | 80.9 years |
| William | 1,727 | 74.1 years |
| Joseph | 1,405 | 74.5 years |
| George | 1,116 | 75.2 years |
| Helen | 1,106 | 81.5 years |
| James | 1,094 | 72.1 years |
| Margaret | 1,063 | 80.2 years |
| Anna | 1,031 | 82.3 years |
| Robert | 1,015 | 69.9 years |
| Most common last names in Dutchess County, NY among deceased individuals | ||
| Last name | Count | Lived (average) |
|---|---|---|
| Smith | 510 | 75.2 years |
| Miller | 331 | 77.0 years |
| Johnson | 293 | 73.6 years |
| Williams | 268 | 74.3 years |
| Brown | 242 | 74.6 years |
| Jones | 196 | 76.3 years |
| Anderson | 174 | 77.7 years |
| White | 159 | 75.0 years |
| Murphy | 153 | 77.1 years |
| Robinson | 149 | 74.0 years |
| Businesses in Dutchess County, NY | ||||
| Name | Count | Name | Count | |
|---|---|---|---|---|
| 7-Eleven | 2 | KFC | 3 | |
| A&P | 3 | Kmart | 2 | |
| ALDO | 1 | Kohl's | 1 | |
| AT&T | 7 | Kroger | 1 | |
| Abercrombie & Fitch | 1 | La-Z-Boy | 2 | |
| Abercrombie Kids | 1 | Lane Bryant | 1 | |
| Ace Hardware | 4 | Lane Furniture | 1 | |
| Advance Auto Parts | 2 | LensCrafters | 1 | |
| Aeropostale | 1 | Little Caesars Pizza | 1 | |
| American Eagle Outfitters | 2 | Lowe's | 1 | |
| Ann Taylor | 1 | Macy's | 1 | |
| Applebee's | 1 | Marriott | 2 | |
| AutoZone | 3 | Marshalls | 1 | |
| BMW | 1 | MasterBrand Cabinets | 21 | |
| Banana Republic | 1 | McDonald's | 11 | |
| Barnes & Noble | 1 | Men's Wearhouse | 2 | |
| Bath & Body Works | 1 | Motherhood Maternity | 2 | |
| Bed Bath & Beyond | 1 | New Balance | 2 | |
| Blockbuster | 4 | New York & Co | 1 | |
| Brookstone | 1 | Nike | 14 | |
| Budget Car Rental | 1 | Nissan | 1 | |
| Burger King | 3 | Office Depot | 1 | |
| CVS | 11 | Old Navy | 1 | |
| Casual Male XL | 1 | Olive Garden | 1 | |
| Catherines | 1 | Outback | 1 | |
| Charlotte Russe | 1 | Outback Steakhouse | 1 | |
| Chevrolet | 3 | Pac Sun | 1 | |
| Chico's | 1 | Panera Bread | 2 | |
| Chuck E. Cheese's | 1 | Payless | 2 | |
| Clarion | 1 | Penske | 2 | |
| Cold Stone Creamery | 2 | Pier 1 Imports | 1 | |
| Cracker Barrel | 1 | Pizza Hut | 3 | |
| Curves | 2 | Quality | 2 | |
| DHL | 2 | Quiznos | 3 | |
| Dairy Queen | 2 | RadioShack | 5 | |
| Days Inn | 2 | Ramada | 1 | |
| Decora Cabinetry | 10 | Raymour & Flanigan | 2 | |
| Domino's Pizza | 2 | Red Lobster | 1 | |
| DressBarn | 1 | Red Robin | 1 | |
| Dressbarn | 1 | Rite Aid | 9 | |
| Dunkin Donuts | 21 | Ruby Tuesday | 2 | |
| Express | 1 | SONIC Drive-In | 1 | |
| Extended Stay America | 1 | Sam's Club | 1 | |
| Famous Footwear | 3 | Sears | 4 | |
| Fashion Bug | 1 | Spencer Gifts | 1 | |
| FedEx | 44 | Sprint Nextel | 4 | |
| Finish Line | 1 | Staples | 2 | |
| Firestone Complete Auto Care | 1 | Starbucks | 4 | |
| Ford | 4 | Stop & Shop | 6 | |
| Forever 21 | 1 | Subaru | 2 | |
| GNC | 8 | Subway | 17 | |
| GameStop | 3 | Super 8 | 1 | |
| Gap | 1 | T-Mobile | 6 | |
| Goodwill | 3 | T.G.I. Driday's | 1 | |
| H&M | 1 | T.J.Maxx | 1 | |
| H&R Block | 12 | Taco Bell | 2 | |
| Harmon Face Values | 1 | Talbots | 1 | |
| Hilton | 3 | Target | 1 | |
| Hobby Lobby | 1 | The Room Place | 1 | |
| Holiday Inn | 2 | Toyota | 1 | |
| Hollister Co. | 1 | Toys"R"Us | 2 | |
| Home Depot | 3 | True Value | 2 | |
| Homestead Studio Suites | 1 | U-Haul | 18 | |
| Honda | 1 | UPS | 60 | |
| Hot Topic | 1 | Vans | 2 | |
| Hyatt | 1 | Verizon Wireless | 5 | |
| Hyundai | 1 | Victoria's Secret | 1 | |
| IHOP | 1 | Volkswagen | 1 | |
| JCPenney | 1 | Walgreens | 4 | |
| JoS. A. Bank | 1 | Walmart | 1 | |
| Jones New York | 1 | Wendy's | 5 | |
| Journeys | 1 | Wet Seal | 1 | |
| Justice | 1 | World Gym | 1 | |
Dutchess County on our top lists:
- #3 on the list of "Top 101 counties with the largest decrease in the number of infant deaths per 1000 residents 2000-2006 to 2007-2013 (pop. 50,000+)"
- #4 on the list of "Top 101 counties with the lowest number of infant deaths per 1000 residents 2007-2013 (pop. 50,000+)"
- #28 on the list of "Top 101 counties with the lowest number of births per 1000 residents 2007-2013"
- #28 on the list of "Top 101 counties with the lowest number of births per 1000 residents 2007-2013 (pop 50,000+)"
- #49 on the list of "Top 101 counties with the largest decrease in the number of births per 1000 residents 2000-2006 to 2007-2013 (pop 50,000+)"