Putnam County, New York (NY)
County owner-occupied free and clear houses and condos in 2010: 6,443
County owner-occupied houses and condos in 2000: 26,884
Renter-occupied apartments: 6,353 (it was 5,819 in 2000)
| % of renters here: | 18% |
| State: | 47% |
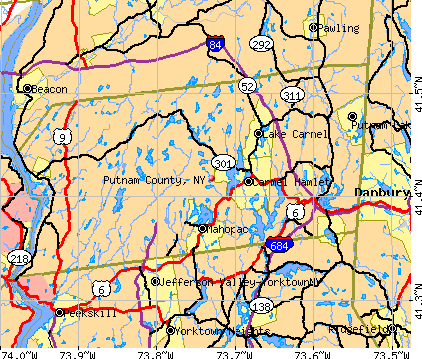
Land area: 231 sq. mi.
Water area: 15.0 sq. mi.
Population density: 424 people per square mile (high).
Industries providing employment: Educational, health and social services (30.3%), Professional, scientific, management, administrative, and waste management services (13.5%).
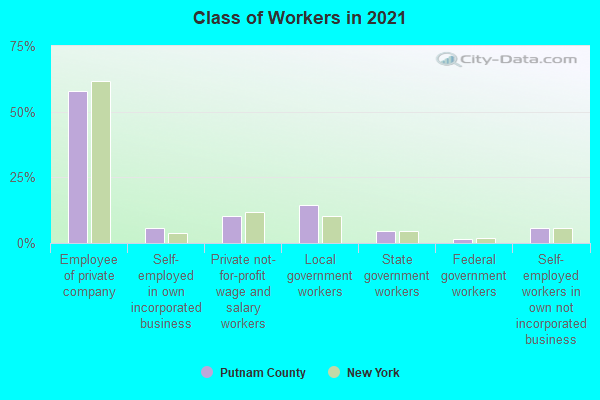
Type of workers:
- Private wage or salary: 74%
- Government: 19%
- Self-employed, not incorporated: 7%
- Unpaid family work: 0%
- OSM Map
- General Map
- Google Map
- MSN Map

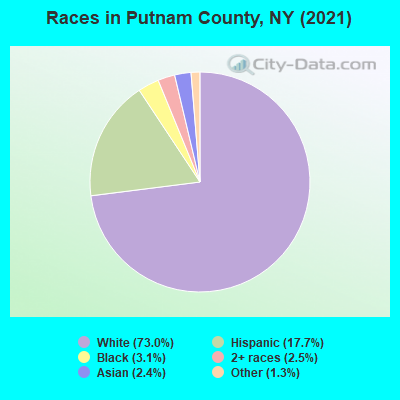
- 70,37271.8%White Non-Hispanic Alone
- 18,71319.1%Hispanic or Latino
- 2,8512.9%Black Non-Hispanic Alone
- 2,6102.7%Two or more races
- 2,4732.5%Asian alone
- 9871.0%Some other race alone
- 390.04%Native Hawaiian and Other
Pacific Islander alone
| Median resident age: | 44.3 years |
| New York median age: | 40.0 years |
| Males: 49,427 | |
| Females: 48,618 |

 | Pros/Cons of living in Putnam County (4 replies) |
| Upper Middle class african-american communities in ny (2034 replies) |
| For those interested in state political issues (424 replies) |
| Affluent Upstate NY... (139 replies) |
| Graduation videos… (38 replies) |
| Stop moving to NJ!! (171 replies) |
| Putnam County: | 2.0 people |
| New York: | 3 people |
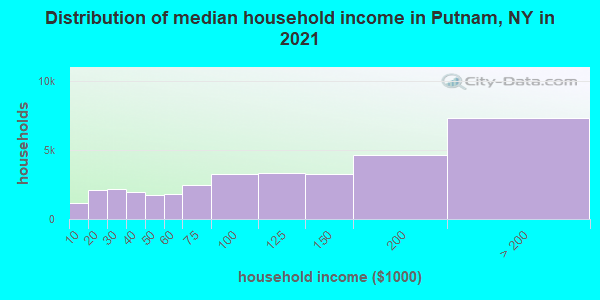
Estimated median household income in 2022: $111,102 ($72,279 in 1999)
| This county: | $111,102 |
| New York: | $79,557 |
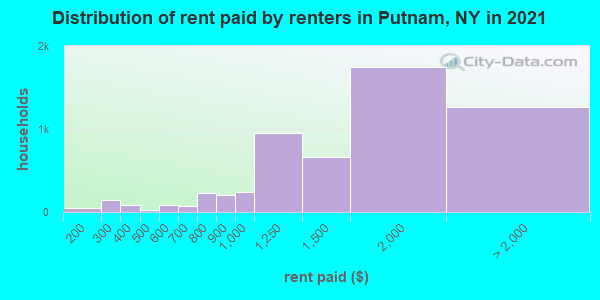
Median contract rent in 2022 for apartments: $1,681 (lower quartile is $1,237, upper quartile is $2,037)
| This county: | $1681 |
| State: | $1354 |
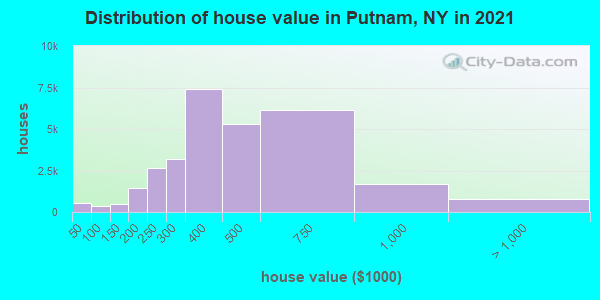
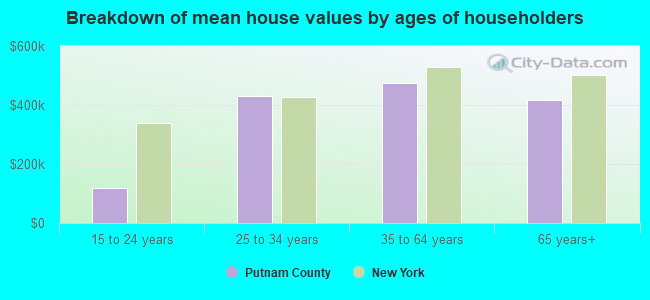
Estimated median house or condo value in 2022: $436,500 (it was $205,500 in 2000)
| Putnam: | $436,500 |
| New York: | $400,400 |
Mean price in 2022:
Median monthly housing costs for homes and condos with a mortgage: $2,892Detached houses: $544,773
Here: $544,773 State: $476,719 Townhouses or other attached units: $394,159
Here: $394,159 State: $699,270 In 2-unit structures: $469,697
Here: $469,697 State: $713,077 In 3-to-4-unit structures: $440,923
Here: $440,923 State: $764,568 In 5-or-more-unit structures: $358,923
Here: $358,923 State: $912,009 Mobile homes: $103,512
Here: $103,512 State: $88,925
Median monthly housing costs for units without a mortgage: $1,277
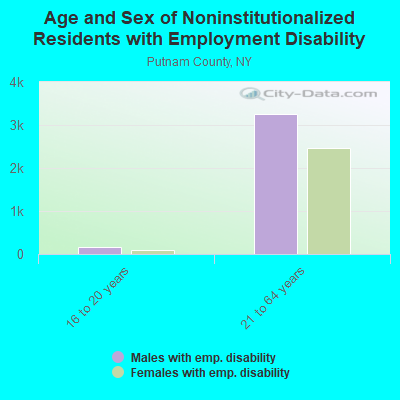
Institutionalized population: 674
Crime in 2020 (reported by the sheriff's office or county police, not the county total):
- Murders: 0
- Rapes: 3
- Robberies: 0
- Assaults: 9
- Burglaries: 20
- Thefts: 87
- Auto thefts: 10
Crime in 2019 (reported by the sheriff's office or county police, not the county total):
- Murders: 0
- Rapes: 4
- Robberies: 4
- Assaults: 10
- Burglaries: 15
- Thefts: 108
- Auto thefts: 4
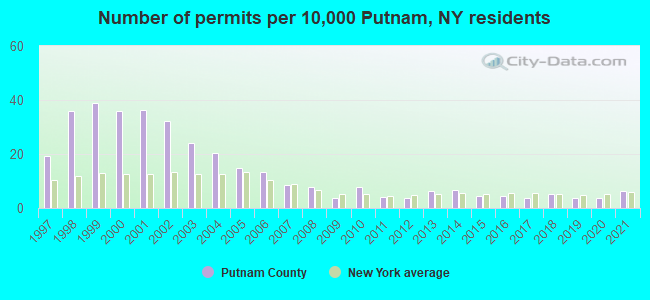
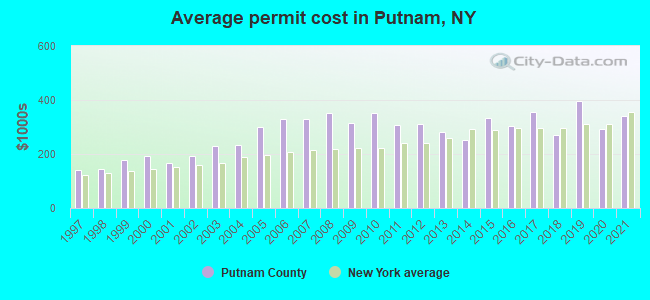
Single-family new house construction building permits:
- 2022: 47 buildings, average cost: $346,500
- 2021: 59 buildings, average cost: $341,300
- 2020: 34 buildings, average cost: $291,000
- 2019: 36 buildings, average cost: $396,200
- 2018: 48 buildings, average cost: $269,400
- 2017: 36 buildings, average cost: $357,200
- 2016: 41 buildings, average cost: $301,700
- 2015: 43 buildings, average cost: $332,800
- 2014: 63 buildings, average cost: $251,300
- 2013: 60 buildings, average cost: $282,600
- 2012: 37 buildings, average cost: $309,600
- 2011: 38 buildings, average cost: $308,200
- 2010: 74 buildings, average cost: $351,600
- 2009: 37 buildings, average cost: $315,900
- 2008: 75 buildings, average cost: $351,200
- 2007: 83 buildings, average cost: $330,700
- 2006: 129 buildings, average cost: $328,600
- 2005: 141 buildings, average cost: $301,400
- 2004: 196 buildings, average cost: $235,200
- 2003: 232 buildings, average cost: $230,900
- 2002: 308 buildings, average cost: $191,500
- 2001: 346 buildings, average cost: $166,900
- 2000: 344 buildings, average cost: $192,800
- 1999: 372 buildings, average cost: $178,000
- 1998: 344 buildings, average cost: $144,700
- 1997: 184 buildings, average cost: $138,800
Median real estate property taxes paid for housing units with mortgages in 2022: $10,001 (2.3%)
Median real estate property taxes paid for housing units with no mortgage in 2022: $10,001 (2.3%)
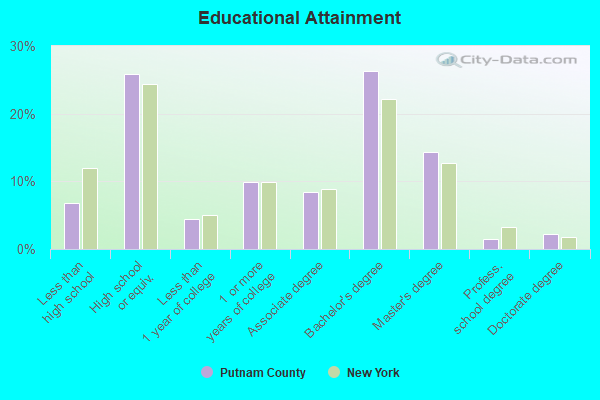
| Putnam County: | 6.5% |
| New York: | 14.3% |
Median age of residents in 2022: 44.3 years old
(Males: 43.2 years old, Females: 45.9 years old)
(Median age for: White residents: 49.0 years old, Black residents: 44.6 years old, American Indian residents: 36.2 years old, Asian residents: 40.0 years old, Hispanic or Latino residents: 34.4 years old, Other race residents: 31.4 years old)
Area name: New York-Monmouth-Ocean, NY-NJ HUD Metro FMR Area
Fair market rent in 2006 for a 1-bedroom apartment in Putnam County is $1003 a month.
Fair market rent for a 2-bedroom apartment is $1133 a month.
Fair market rent for a 3-bedroom apartment is $1406 a month.
Cities in this county include: Carmel, Southeast, Kent, Patterson, Putnam Valley, Philipstown, Lake Carmel, Mahopac, Carmel Hamlet, Putnam Lake.
| City or Town | Homes measured | Living Area | Basement | ||
|---|---|---|---|---|---|
| Homes Above 4 pCi/L Best Estimate (%) | Homes Above 4 pCi/L Range (%) | Homes Above 4 pCi/L Best Estimate (%) | Homes Above 4 pCi/L Range (%) | ||
| Carmel town | 250 | 5 | 4 - 6 | 26 | 24 - 29 |
| Kent town | 129 | 10 | 8 - 13 | 42 | 38 - 46 |
| Patterson town | 70 | 5 | 4 - 7 | 26 | 21 - 30 |
| Philipstown town | 113 | 14 | 11 - 16 | 45 | 41 - 49 |
| Putnam Valley town | 131 | 13 | 10 - 15 | 45 | 41 - 48 |
| Southeast town | 126 | 4 | 3 - 5 | 20 | 17 - 23 |
| Putnam county | 819 | 8 | 32 | ||
2023 air pollution in Putnam County:
Ozone (1-hour): 0.030 ppm (standard limit: 0.12 ppm). Near U.S. average.
Neighboring counties: Arthur County, Nebraska  , Custer County, Nebraska , Keith County, Nebraska , Sherman County, Nebraska , Whiteside County, Illinois .
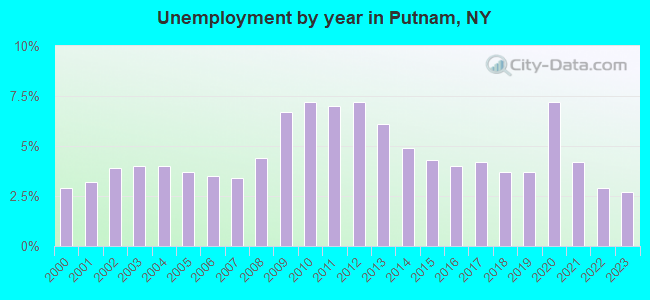
| Here: | 3.4% |
| New York: | 4.4% |
Current college students: 4,700
People 25 years of age or older with a high school degree or higher: 94.0%
People 25 years of age or older with a bachelor's degree or higher: 45.3%
Number of foreign born residents: 12,811 (73.1% naturalized citizens)
| Putnam County: | 13.1% |
| Whole state: | 22.7% |
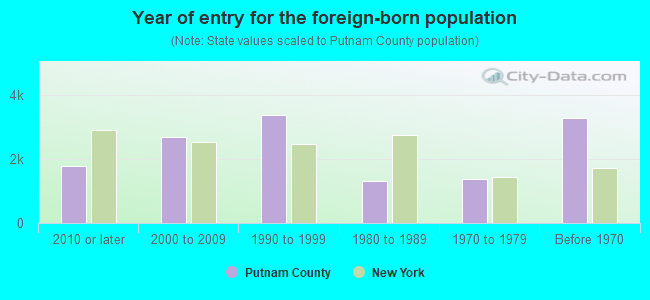
- Year of entry for the foreign-born population
- 2,1702010 or later
- 2,5282000 to 2009
- 3,5061990 to 1999
- 1,3021980 to 1989
- 1,3861970 to 1979
- 3,268Before 1970
Mean travel time to work (commute): ( minutes
Percentage of county residents living and working in this county: 94.2%
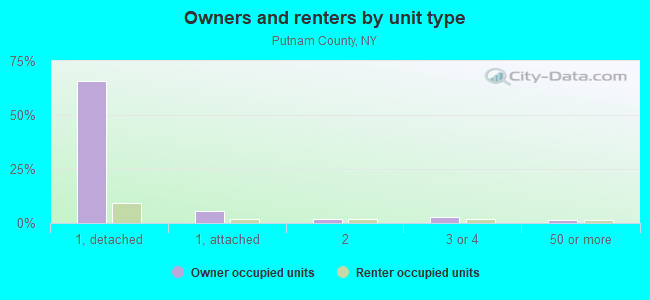
Housing units in structures:
- One, detached: 31,105
- One, attached: 3,200
- Two: 500
- 3 or 4: 1,121
- 5 to 9: 1,104
- 10 to 19: 531
- 20 to 49: 405
- 50 or more: 413
- Mobile homes: 26
Housing units in Putnam County with a mortgage: 19,187 (1,892 second mortgage, 85 home equity loan, 1,751 both second mortgage and home equity loan)
Houses without a mortgage: 831
| Here: | 2.2% with mortgage |
| State: | 95.5% with mortgage |
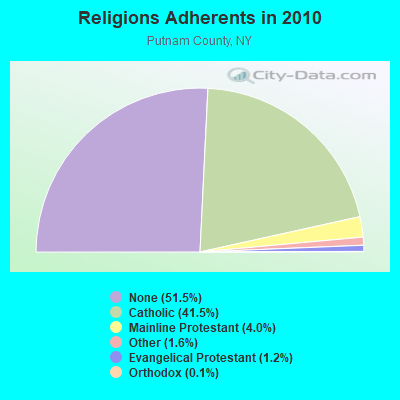
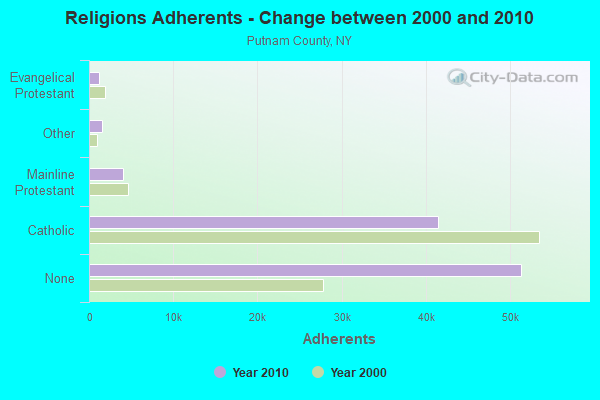
Religion statistics for Putnam County
| Religion | Adherents | Congregations |
|---|---|---|
| Catholic | 41,420 | 9 |
| Mainline Protestant | 4,017 | 23 |
| Other | 1,588 | 7 |
| Evangelical Protestant | 1,208 | 14 |
| Orthodox | 145 | 2 |
| None | 51,332 | - |
Source: Clifford Grammich, Kirk Hadaway, Richard Houseal, Dale E.Jones, Alexei Krindatch, Richie Stanley and Richard H.Taylor. 2012. 2010 U.S.Religion Census: Religious Congregations & Membership Study. Association of Statisticians of American Religious Bodies. Jones, Dale E., et al. 2002. Congregations and Membership in the United States 2000. Nashville, TN: Glenmary Research Center.
Food Environment Statistics:
| Putnam County: | 3.12 / 10,000 pop. |
| State: | 4.13 / 10,000 pop. |
| This county: | 0.81 / 10,000 pop. |
| New York: | 0.92 / 10,000 pop. |
| Putnam County: | 2.22 / 10,000 pop. |
| New York: | 1.68 / 10,000 pop. |
| This county: | 8.77 / 10,000 pop. |
| State: | 8.82 / 10,000 pop. |
| Putnam County: | 6.9% |
| New York: | 8.2% |
| Putnam County: | 24.3% |
| State: | 23.8% |
| Here: | 22.7% |
| State: | 15.6% |
Agriculture in Putnam County:
Average size of farms: 129 acresAverage value of agricultural products sold per farm: $46,653
Average value of crops sold per acre for harvested cropland: $1981.33
The value of nursery, greenhouse, floriculture, and sod as a percentage of the total market value of agricultural products sold: 81.38%
The value of livestock, poultry, and their products as a percentage of the total market value of agricultural products sold: 3.46%
Average total farm production expenses per farm: $69,186
Harvested cropland as a percentage of land in farms: 17.59%
Irrigated harvested cropland as a percentage of land in farms: 2.54%
Average market value of all machinery and equipment per farm: $56,224
The percentage of farms operated by a family or individual: 65.38%
Average age of principal farm operators: 56 years
Average number of cattle and calves per 100 acres of all land in farms: 1.92
Milk cows as a percentage of all cattle and calves: 6.20%
Vegetables: 69 harvested acres
Earthquake activity:
Putnam County-area historical earthquake activity is significantly above New York state average. It is 69% smaller than the overall U.S. average.On 10/7/1983 at 10:18:46, a magnitude 5.3 (5.1 MB, 5.3 LG, 5.1 ML, Class: Moderate, Intensity: VI - VII) earthquake occurred 178.1 miles away from Putnam County center
On 4/20/2002 at 10:50:47, a magnitude 5.3 (5.3 ML, Depth: 3.0 mi) earthquake occurred 214.1 miles away from the county center
On 4/20/2002 at 10:50:47, a magnitude 5.2 (5.2 MB, 4.2 MS, 5.2 MW, 5.0 MW) earthquake occurred 212.4 miles away from the county center
On 8/23/2011 at 17:51:04, a magnitude 5.8 (5.8 MW, Depth: 3.7 mi) earthquake occurred 330.0 miles away from the county center
On 1/16/1994 at 01:49:16, a magnitude 4.6 (4.6 MB, 4.6 LG, Depth: 3.1 mi, Class: Light, Intensity: IV - V) earthquake occurred 142.1 miles away from Putnam County center
On 1/19/1982 at 00:14:42, a magnitude 4.7 (4.5 MB, 4.7 MD, 4.5 LG) earthquake occurred 180.5 miles away from the county center
Magnitude types: regional Lg-wave magnitude (LG), body-wave magnitude (MB), duration magnitude (MD), local magnitude (ML), surface-wave magnitude (MS), moment magnitude (MW)
Most recent natural disasters:
- New York Tropical Storm Isaias, Incident Period: August 4, 2020, FEMA Id: 4567, Natural disaster type: Tropical Storm
- New York Covid-19 Pandemic, Incident Period: January 20, 2020, Major Disaster (Presidential) Declared DR-4480-NY: March 20, 2020, FEMA Id: 4480, Natural disaster type: Other
- New York Hurricane Sandy, Incident Period: October 27, 2012 to November 09, 2012, Emergency Declared EM-3351: October 28, 2012, FEMA Id: 3351, Natural disaster type: Hurricane
- New York Hurricane Sandy, Incident Period: October 27, 2012 to November 09, 2012, Major Disaster (Presidential) Declared DR-4085: October 30, 2012, FEMA Id: 4085, Natural disaster type: Hurricane
- New York Hurricane Irene, Incident Period: August 26, 2011 to September 05, 2011, Major Disaster (Presidential) Declared DR-4020: August 31, 2011, FEMA Id: 4020, Natural disaster type: Hurricane
- New York Hurricane Irene, Incident Period: August 25, 2011 to September 05, 2011, Emergency Declared EM-3328: August 26, 2011, FEMA Id: 3328, Natural disaster type: Hurricane
- New York Severe Storms and Inland and Coastal Flooding, Incident Period: April 14, 2007 to April 18, 2007, Major Disaster (Presidential) Declared DR-1692: April 24, 2007, FEMA Id: 1692, Natural disaster type: Storm, Flood
- New York Hurricane Katrina Evacuation, Incident Period: August 29, 2005 to October 01, 2005, Emergency Declared EM-3262: September 30, 2005, FEMA Id: 3262, Natural disaster type: Hurricane
- New York Severe Storms and Flooding, Incident Period: April 02, 2005 to April 04, 2005, Major Disaster (Presidential) Declared DR-1589: April 19, 2005, FEMA Id: 1589, Natural disaster type: Storm, Flood
- New York Power Outage, Incident Period: August 14, 2003 to August 16, 2003, Emergency Declared EM-3186: August 23, 2003, FEMA Id: 3186, Natural disaster type: Power Outage
- 12 other natural disasters have been reported since 1953.
The number of natural disasters in Putnam County (22) is greater than the US average (15).
Major Disasters (Presidential) Declared: 13
Emergencies Declared: 8
Causes of natural disasters: Hurricanes: 7, Floods: 5, Storms: 5, Blizzards: 2, Heavy Rain: 1, Landslide: 1, Power Outage: 1, Snowstorm: 1, Tropical Storm: 1, Water Shortage: 1, Winter Storm: 1, Other: 3 (Note: some incidents may be assigned to more than one category).
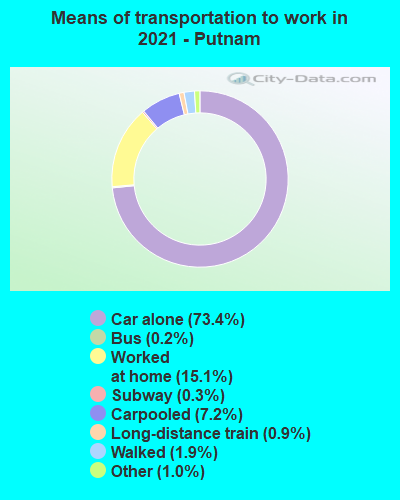
Means of transportation to work:
- Drove a car alone: 21,686 (68.7%)
- Carpooled: 2,343 (7.4%)
- Bus: 56 (0.2%)
- Subway or elevated rail: 55 (0.2%)
- Long-distance train or commuter rail: 227 (0.7%)
- Taxicab, motorcycle, or other means: 381 (1.2%)
- Bicycle: 9 (0.0%)
- Walked: 628 (2.0%)
- Worked at home: 7,083 (22.4%)
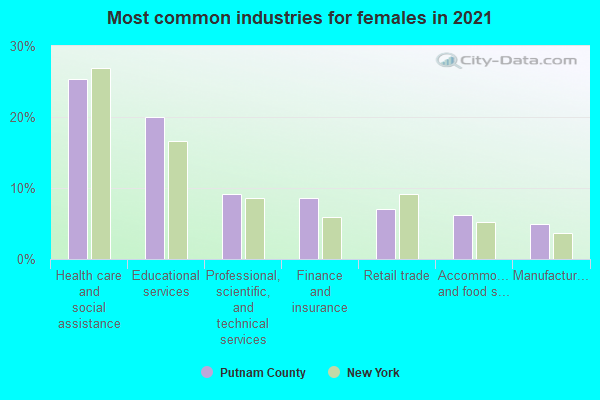
- Educational services (20%)
- Health care and social assistance (19%)
- Retail trade (8%)
- Professional, scientific, and technical services (8%)
- Accommodation and food services (5%)
- Finance and insurance (5%)
- Other services, except public administration (3%)
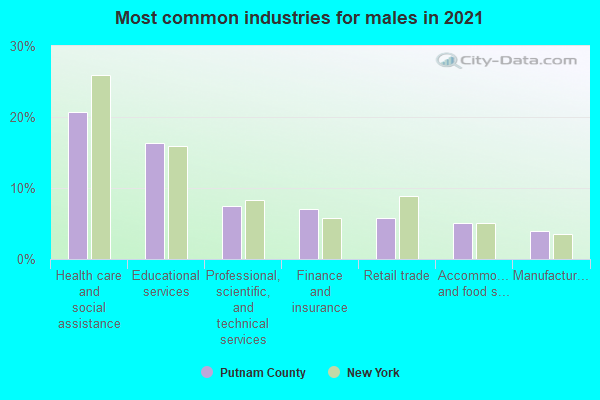
- Educational services (23%)
- Health care and social assistance (22%)
- Retail trade (9%)
- Professional, scientific, and technical services (9%)
- Accommodation and food services (6%)
- Finance and insurance (5%)
- Other services, except public administration (4%)
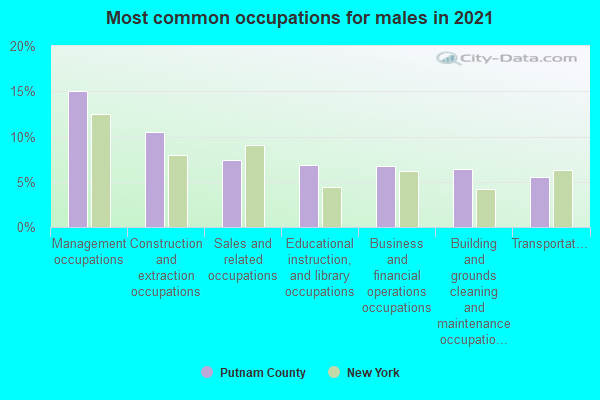
- Management occupations (14%)
- Construction and extraction occupations (11%)
- Educational instruction, and library occupations (7%)
- Installation, maintenance, and repair occupations (6%)
- Business and financial operations occupations (6%)
- Sales and related occupations (6%)
- Office and administrative support occupations (5%)
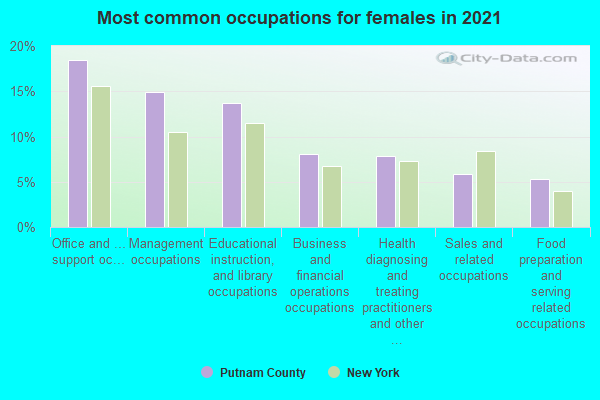
- Office and administrative support occupations (18%)
- Management occupations (14%)
- Educational instruction, and library occupations (13%)
- Health diagnosing and treating practitioners and other technical occupations (8%)
- Sales and related occupations (8%)
- Business and financial operations occupations (7%)
- Food preparation and serving related occupations (5%)
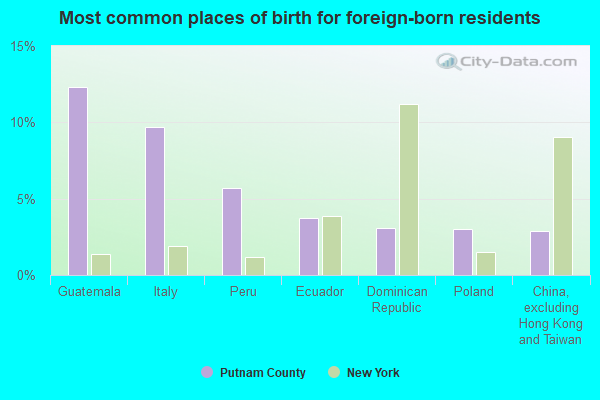
- Guatemala (11%)
- Italy (9%)
- Ecuador (6%)
- Peru (6%)
- Dominican Republic (4%)
- China, excluding Hong Kong and Taiwan (4%)
- Ireland (4%)
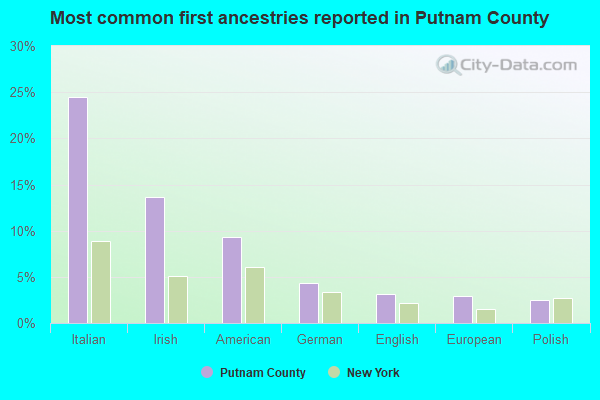
- Italian (24%)
- Irish (12%)
- American (12%)
- German (4%)
- English (3%)
- European (3%)
- Polish (2%)
People in group quarters in Putnam County, New York in 2010:
- 890 people in college/university student housing
- 324 people in residential treatment centers for adults
- 304 people in other noninstitutional facilities
- 290 people in nursing facilities/skilled-nursing facilities
- 242 people in group homes intended for adults
- 225 people in local jails and other municipal confinement facilities
- 142 people in emergency and transitional shelters (with sleeping facilities) for people experiencing homelessness
- 86 people in residential treatment centers for juveniles (non-correctional)
- 72 people in correctional residential facilities
- 16 people in workers' group living quarters and job corps centers
People in group quarters in Putnam County, New York in 2000:
- 1,088 people in college dormitories (includes college quarters off campus)
- 193 people in religious group quarters
- 155 people in homes or halfway houses for drug/alcohol abuse
- 149 people in homes for the mentally retarded
- 147 people in nursing homes
- 119 people in hospitals or wards for drug/alcohol abuse
- 101 people in residential treatment centers for emotionally disturbed children
- 88 people in state prisons
- 44 people in other noninstitutional group quarters
- 42 people in homes for the mentally ill
- 22 people in mental (psychiatric) hospitals or wards
- 10 people in other group homes
- 4 people in other nonhousehold living situations
- 2 people in other workers' dormitories
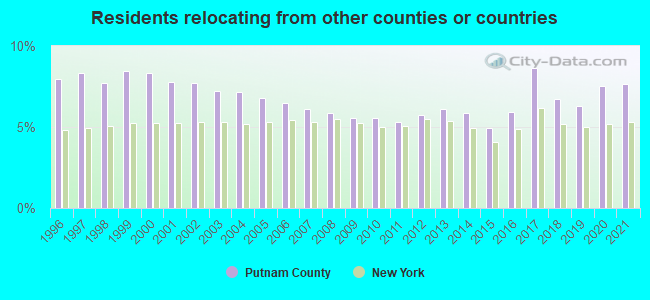
7.63% of this county's 2021 resident taxpayers lived in other counties in 2020 ($110,816 average adjusted gross income)
| Here: | 7.63% |
| New York average: | 5.29% |
10 or fewer of this county's residents moved from foreign countries.
6.22% relocated from other counties in New York ($96,013 average AGI)
1.41% relocated from other states ($14,803 average AGI)
Putnam County: 1.41% New York average: 1.86%
Top counties from which taxpayers relocated into this county between 2020 and 2021:
| from Westchester County, NY | |
| from Bronx County, NY | |
| from New York County, NY | |
| from Dutchess County, NY | |
| from Queens County, NY | |
| from Kings County, NY | |
| from Fairfield County, CT |
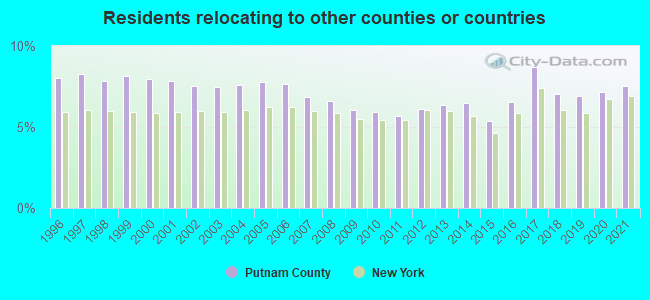
7.51% of this county's 2020 resident taxpayers moved to other counties in 2021 ($93,792 average adjusted gross income)
| Here: | 7.51% |
| New York average: | 6.93% |
10 or fewer of this county's residents moved to foreign countries.
4.16% relocated to other counties in New York ($47,994 average AGI)
3.35% relocated to other states ($45,799 average AGI)
Putnam County: 3.35% New York average: 3.55%
Top counties to which taxpayers relocated from this county between 2020 and 2021:
| to Westchester County, NY | |
| to Dutchess County, NY | |
| to Fairfield County, CT | |
| to Orange County, NY | |
| to Bronx County, NY | |
| to New York County, NY | |
| to Queens County, NY |
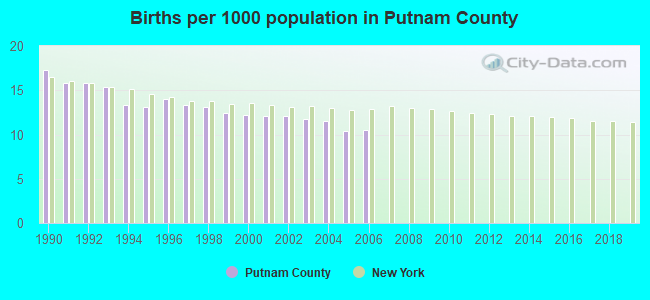
Births per 1000 population from 1990 to 1999: 14.4
Births per 1000 population from 2000 to 2006: 11.5
Deaths per 1000 population from 1990 to 1999: 6.2
Deaths per 1000 population from 2000 to 2009: 6.1
Deaths per 1000 population from 2010 to 2020: 7.1

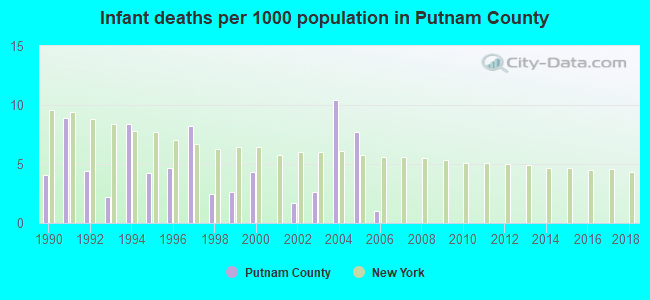
Infant deaths per 1000 live births from 1990 to 1999: 5.0
Infant deaths per 1000 live births from 2000 to 2006: 4.0
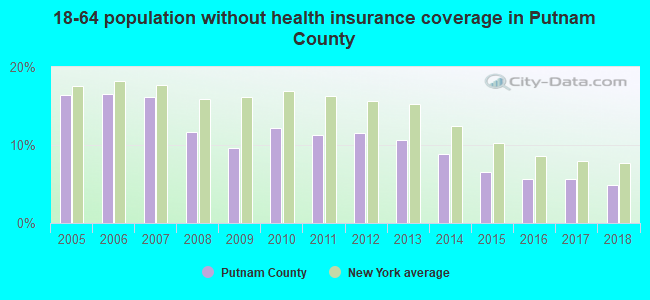
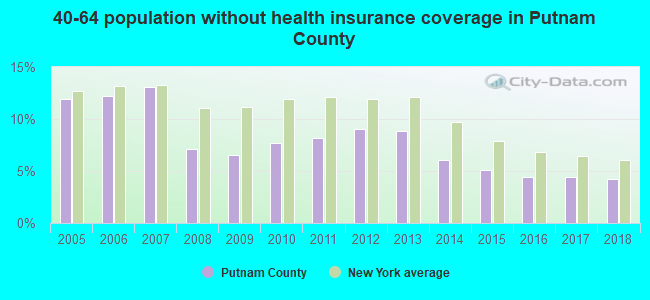
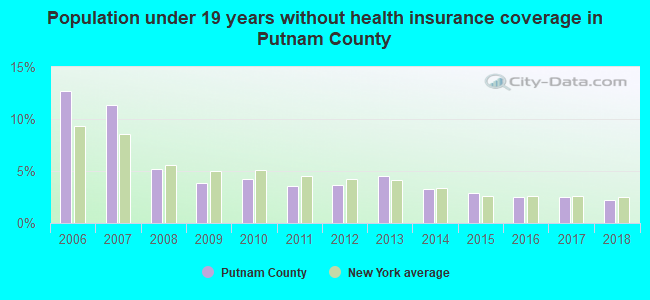
Persons under 19 years old without health insurance coverage in 2018: 2.2%
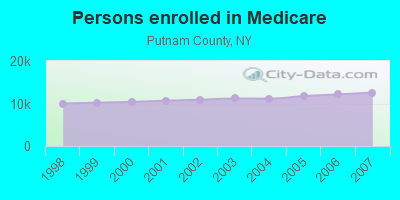
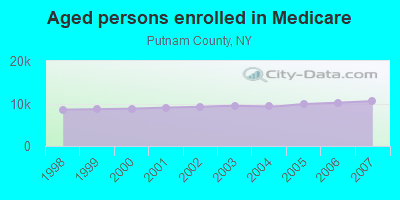
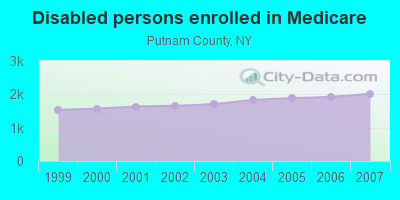
Persons enrolled in hospital insurance and/or supplemental medical insurance (Medicare) in July 1, 2007: 12,588 (10,571 aged, 2,017 disabled)
Children under 18 without health insurance coverage in 2007: 2,043 (8%)
Most common underlying causes of death in Putnam County, New York in 1999 - 2019:
- Atherosclerotic heart disease (2,220)
- Bronchus or lung, unspecified - Malignant neoplasms (1,004)
- Acute myocardial infarction, unspecified (535)
- Chronic obstructive pulmonary disease, unspecified (437)
- Septicaemia, unspecified (265)
- Breast, unspecified - Malignant neoplasms (242)
- Pneumonia, unspecified (222)
- Colon, unspecified - Malignant neoplasms (219)
- Stroke, not specified as haemorrhage or infarction (208)
- Pancreas, unspecified - Malignant neoplasms (207)
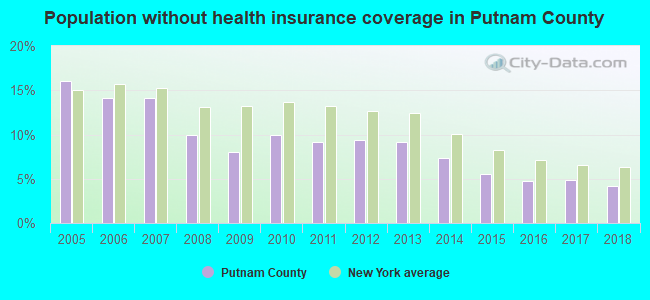
Population without health insurance coverage in 2000: 9%
Children under 18 without health insurance coverage in 2000: 6%
Short term general hospital admissions per 100,000 population in 2004: 6,981
Short term general hospital beds per 100,000 population in 2004: 143
Emergency room visits per 100,000 population in 2004: 23,868
General practice office based MDs per 100,000 population in 2005: 1,132
Medical specialist MDs per 100,000 population in 2005: 588
Dentists per 100,000 population in 1998: 25
Total births per 100,000 population, July 2005 - July 2006 : 43
Total deaths per 100,000 population, July 2005 - July 2006: 75
Limited-service eating places per 100,000 population in 2005 : 23
Beer, wine & liquor stores per 100,000 population in 2005: 1
EPA green book nonattainment status in 2004-2006: 1
Suicides per 1,000,000 population from 2000 to 2006: 58.2. This is less than state average.
Household type by relationship:
Households: 98,045- Male householders: 18,038 (3,390 living alone), Female householders: 18,066 (5,604 living alone)
21,557 spouses (21,328 opposite-sex spouses), 2,245 unmarried partners, (2,203 opposite-sex unmarried partners), 28,453 children (27,853 natural, 348 adopted, 252 stepchildren), 1,905 grandchildren, 418 brothers or sisters, 1,588 parents, 0 foster children, 1,207 other relatives, 2,046 non-relatives
- In group quarters: 2,522
Size of family households: 10,629 2-persons, 6,394 3-persons, 5,739 4-persons, 1,334 5-persons, 624 6-persons, 438 7-or-more-persons.
Size of nonfamily households: 8,994 1-person, 1,669 2-persons, 60 3-persons, 223 4-persons.
13,629 married couples with children.
2,758 single-parent households (434 men, 2,324 women).
79.2% of residents of Putnam speak English at home.
11.4% of residents speak Spanish at home (72% speak English very well, 19% speak English well, 8% speak English not well, 2% don't speak English at all).
6.7% of residents speak other Indo-European language at home (77% speak English very well, 15% speak English well, 7% speak English not well).
1.7% of residents speak Asian or Pacific Island language at home (55% speak English very well, 31% speak English well, 14% speak English not well).
0.8% of residents speak other language at home (74% speak English very well, 9% speak English well, 16% speak English not well).
In fiscal year 2004:
Federal Government expenditure: $343,627,000 ($3,417 per capita)
Department of Defense expenditure: $7,319,000
Federal direct payments to individuals for retirement and disability: $183,540,000
Federal other direct payments to individuals: $84,318,000
Federal direct payments not to individuals: $3,046,000
Federal grants: $52,103,000
Federal procurement contracts: $8,286,000 ($4,631,000 Department of Defense)
Federal salaries and wages: $12,334,000 ($0,000 Department of Defense)
Federal Government direct loans: $0,000
Federal guaranteed/insured loans: $18,290,000
Federal Government insurance: $41,451,000
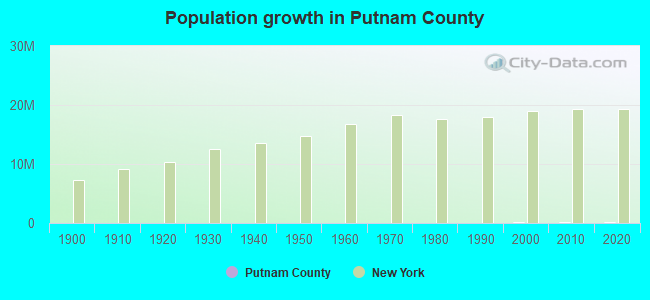
Population change from April 1, 2000 to July 1, 2005:
Births: 6,125| Here: | 61 per 1000 residents |
| State: | 70 per 1000 residents |
Deaths: 3,114
| Here: | 31 per 1000 residents |
| State: | 42 per 1000 residents |
Net international migration: +1,278
| Here: | +13 per 1000 residents |
| State: | +35 per 1000 residents |
Net internal migration: +532
| Here: | |
| State: |
Total withdrawal of fresh water for public supply: 118.11 millions of gallons per day (2% from ground, 98% from surface)
| Here: | 6.4 |
| State: | 6.3 |
| Here: | 4.6 |
| State: | 3.8 |
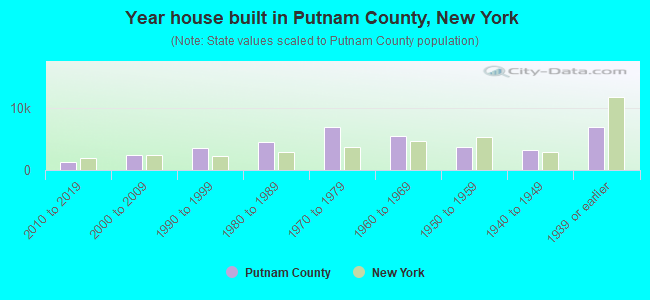
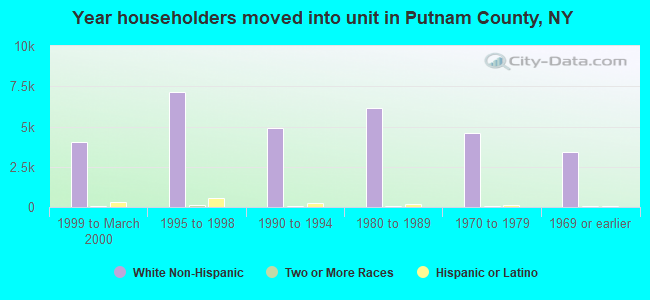
- Year house built in Putnam County, New York
- 552020 or later
- 1,1762010 to 2019
- 2,4042000 to 2009
- 2,8001990 to 1999
- 6,1391980 to 1989
- 5,6631970 to 1979
- 5,4011960 to 1969
- 5,2411950 to 1959
- 2,2001940 to 1949
- 7,3261939 or earlier
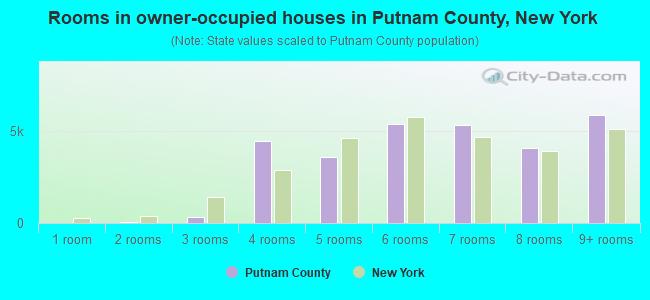
- Rooms in owner-occupied houses in Putnam County, New York
- 251 room
- 1302 rooms
- 1,0543 rooms
- 3,1964 rooms
- 6,0195 rooms
- 5,7056 rooms
- 5,3567 rooms
- 3,9928 rooms
- 5,8819+ rooms
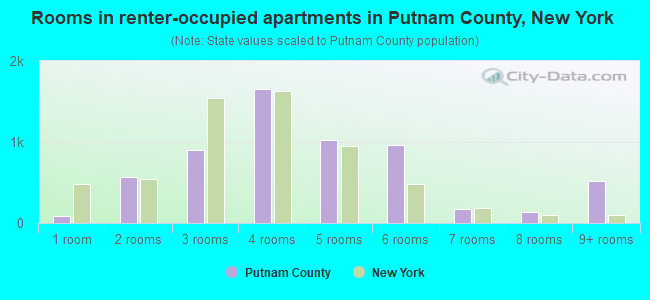
- Rooms in renter-occupied apartments in Putnam County, New York
- 01 room
- 7222 rooms
- 6423 rooms
- 8904 rooms
- 1,1315 rooms
- 6786 rooms
- 3627 rooms
- 1278 rooms
- 1949+ rooms
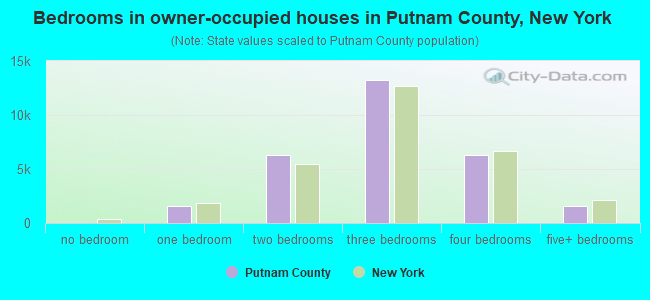
- Bedrooms in owner-occupied houses in Putnam County, New York
- 155no bedroom
- 1,4851 bedroom
- 7,2932 bedrooms
- 13,2913 bedrooms
- 8,0384 bedrooms
- 1,0965+ bedrooms
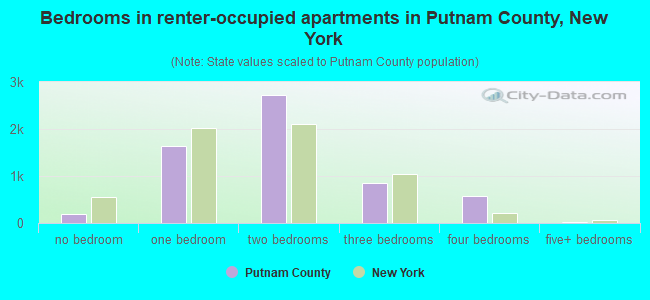
- Bedrooms in renter-occupied apartments in Putnam County, New York
- 62no bedroom
- 1,4511 bedroom
- 1,7352 bedrooms
- 1,2233 bedrooms
- 834 bedrooms
- 1925+ bedrooms
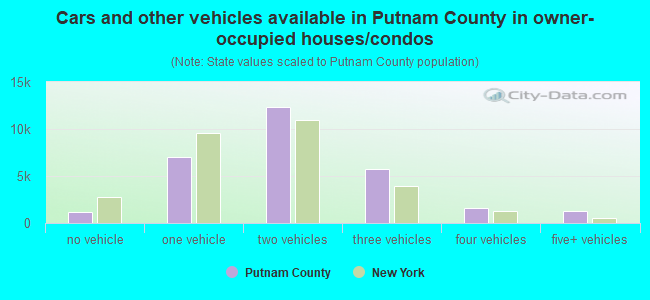
- Cars and other vehicles available in Putnam County in owner-occupied houses/condos
- 1,009no vehicle
- 7,9321 vehicle
- 13,9432 vehicles
- 4,2153 vehicles
- 2,5314 vehicles
- 1,7285+ vehicles
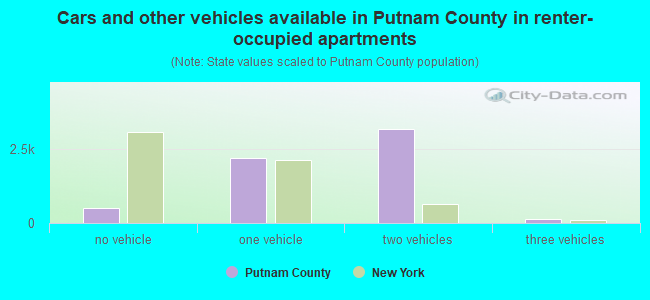
- Cars and other vehicles available in Putnam County in renter-occupied apartments
- 590no vehicle
- 1,7121 vehicle
- 2,1532 vehicles
- 1993 vehicles
- 274 vehicles
- 655+ vehicles
92.3% of Putnam County residents lived in the same house 1 years ago.
Out of people who lived in different houses, 21% lived in this county.
Out of people who lived in different counties, 77% lived in New York.
| Putnam County: | 92.3% |
| State average: | 89.6% |
Place of birth for U.S.-born residents:
- This state: 69,249
- Other state: 14,724
- Northeast: 7,189
- Midwest: 1,696
- South: 3,656
- West: 2,183
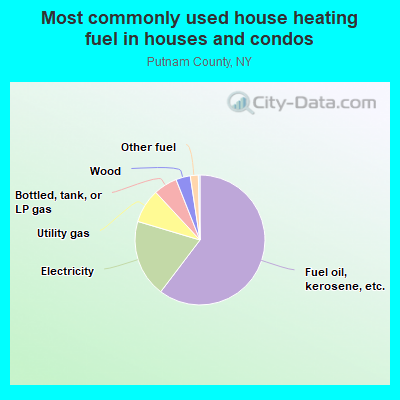
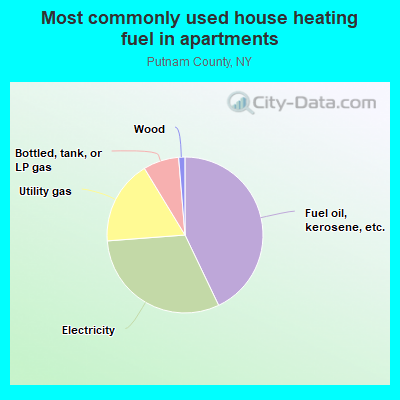
- 62.0%Fuel oil, kerosene, etc.
- 21.8%Electricity
- 8.5%Utility gas
- 5.1%Bottled, tank, or LP gas
- 1.7%Wood
- 0.9%Other fuel
- 43.2%Fuel oil, kerosene, etc.
- 38.5%Electricity
- 10.7%Utility gas
- 5.5%Bottled, tank, or LP gas
- 1.6%Wood
- 0.6%Other fuel
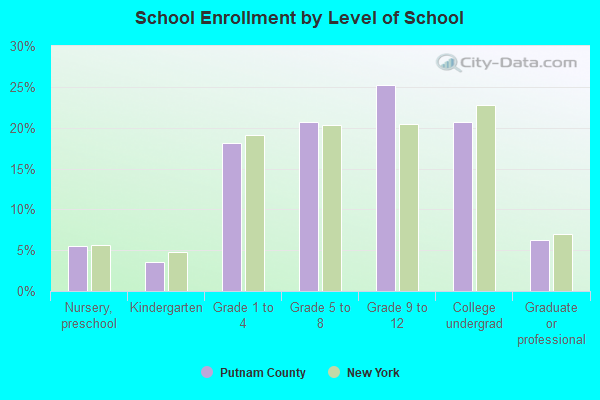
Private vs. public school enrollment:
| Here: | 9.4% |
| New York: | 15.6% |
| Here: | 4.7% |
| New York: | 15.0% |
| Here: | 43.6% |
| New York: | 39.2% |
Putnam County government finances - Expenditure in 2018:
- Assistance and Subsidies - Public Welfare, Federal Categorical Assistance Programs: $1,474,000
Public Welfare, Federal Categorical Assistance Programs: $1,396,000
Public Welfare, Cash Assistance Programs - Other: $677,000
Public Welfare, Cash Assistance Programs - Other: $475,000
- Bond Funds - Cash and Securities: $6,685,000
Cash and Securities: $4,560,000
- Charges - Other: $6,178,000
Other: $6,125,000
Parks and Recreation: $3,253,000
Parks and Recreation: $2,599,000
Solid Waste Management: $25,000
Solid Waste Management: $25,000
- Construction - Regular Highways: $4,821,000
Regular Highways: $4,424,000
General - Other: $2,488,000
General - Other: $1,677,000
Local Fire Protection: $1,495,000
Corrections - Other: $910,000
Parks and Recreation: $542,000
Parks and Recreation: $389,000
Local Fire Protection: $265,000
Corrections - Other: $26,000
- Current Operations - General - Other: $23,867,000
General - Other: $23,730,000
Health - Other: $20,459,000
Health - Other: $20,102,000
Police Protection: $19,986,000
Police Protection: $19,280,000
Public Welfare - Other: $14,745,000
Public Welfare - Other: $13,798,000
Correctional Institutions: $10,472,000
Correctional Institutions: $10,070,000
Regular Highways: $7,491,000
Regular Highways: $7,076,000
Central Staff Services: $6,587,000
Central Staff Services: $6,349,000
Parks and Recreation: $5,621,000
Judicial and Legal Services: $5,480,000
Judicial and Legal Services: $5,141,000
Parks and Recreation: $4,323,000
Financial Administration: $4,100,000
Financial Administration: $3,300,000
General Public Buildings: $2,628,000
General Public Buildings: $2,623,000
Corrections - Other: $2,525,000
Corrections - Other: $2,384,000
Transit Utilities: $1,373,000
Transit Utilities: $1,347,000
Natural Resources - Other: $503,000
Natural Resources - Other: $495,000
Libraries: $436,000
Libraries: $436,000
Solid Waste Management: $180,000
Solid Waste Management: $134,000
Public Welfare, Vendor Payments for Other Purposes: $81,000
Public Welfare, Vendor Payments for Other Purposes: $42,000
Public Welfare, Vendor Payments for Medical Care: $26,000
- Federal Intergovernmental - Highways: $3,730,000
Highways: $668,000
Other: $311,000
Other: $234,000
Health and Hospitals: $219,000
Health and Hospitals: $188,000
- General - Interest on Debt: $3,824,000
Interest on Debt: $3,736,000
- Intergovernmental to Local - Other - Other Higher Education: $3,046,000
Other - Other Higher Education: $2,947,000
Other - Financial Administration: $169,000
Other - Financial Administration: $162,000
- Intergovernmental to State - Public Welfare - Categorical Assistance Programs: $9,438,000
Public Welfare - Categorical Assistance Programs: $9,263,000
Transit Utilities: $2,419,000
Transit Utilities: $2,246,000
Corrections: $117,000
Corrections: $15,000
- Local Intergovernmental - Other: $2,089,000
Other: $1,998,000
Highways: $1,687,000
Highways: $1,125,000
Public Welfare: $907,000
Public Welfare: $787,000
Health and Hospitals: $330,000
Health and Hospitals: $278,000
- Long Term Debt - Beginning Outstanding - Unspecified Public Purpose: $60,590,000
Outstanding Unspecified Public Purpose: $60,513,000
Beginning Outstanding - Unspecified Public Purpose: $57,936,000
Outstanding Unspecified Public Purpose: $52,783,000
Beginning Outstanding - Public Debt for Private Purpose: $20,220,000
Outstanding Nonguaranteed - Industrial Revenue: $18,945,000
Beginning Outstanding - Public Debt for Private Purpose: $17,670,000
Outstanding Nonguaranteed - Industrial Revenue: $16,395,000
Retired Unspecified Public Purpose: $8,468,000
Retired Unspecified Public Purpose: $4,210,000
Issue, Unspecified Public Purpose: $4,133,000
Issue, Unspecified Public Purpose: $3,315,000
Retired Nonguaranteed - Public Debt for Private Purpose: $1,275,000
Retired Nonguaranteed - Public Debt for Private Purpose: $1,275,000
- Miscellaneous - General Revenue - Other: $2,911,000
General Revenue - Other: $2,497,000
Interest Earnings: $950,000
Interest Earnings: $430,000
Fines and Forfeits: $213,000
Fines and Forfeits: $202,000
Donations From Private Sources: $61,000
Sale of Property: $58,000
Sale of Property: $56,000
Donations From Private Sources: $40,000
- Other Capital Outlay - Police Protection: $669,000
General - Other: $647,000
General - Other: $534,000
Police Protection: $501,000
Parks and Recreation: $136,000
Correctional Institutions: $125,000
Correctional Institutions: $88,000
Health - Other: $83,000
Health - Other: $69,000
Central Staff Services: $38,000
Judicial and Legal Services: $38,000
Central Staff Services: $36,000
Public Welfare - Other: $36,000
Parks and Recreation: $24,000
Corrections - Other: $18,000
Regular Highways: $15,000
General Public Building: $9,000
General Public Building: $9,000
Regular Highways: $8,000
Judicial and Legal Services: $5,000
Public Welfare - Other: $4,000
Financial Administration: $3,000
Financial Administration: $2,000
Corrections - Other: $1,000
- Other Funds - Cash and Securities: $41,166,000
Cash and Securities: $28,680,000
- Revenue - Transit Utilities: $113,000
- Sinking Funds - Cash and Securities: $18,945,000
Cash and Securities: $16,395,000
- State Intergovernmental - Public Welfare: $11,107,000
Public Welfare: $10,798,000
Health and Hospitals: $10,422,000
Health and Hospitals: $9,891,000
Other: $7,639,000
Other: $6,189,000
Highways: $1,409,000
Highways: $1,394,000
Education: $10,000
- Tax - General Sales and Gross Receipts: $66,525,000
General Sales and Gross Receipts: $58,888,000
Property: $46,958,000
Property: $46,738,000
Motor Vehicle License: $2,145,000
Other License: $864,000
Other License: $806,000
Other Selective Sales: $701,000
Other Selective Sales: $686,000
- Total Salaries and Wages: $51,202,000
: $49,284,000
Putnam County government finances - Revenue in 2018:
- Assistance and Subsidies - Public Welfare, Federal Categorical Assistance Programs: $1,474,000
Public Welfare, Federal Categorical Assistance Programs: $1,396,000
Public Welfare, Cash Assistance Programs - Other: $677,000
Public Welfare, Cash Assistance Programs - Other: $475,000
- Bond Funds - Cash and Securities: $6,685,000
Cash and Securities: $4,560,000
- Charges - Other: $6,178,000
Other: $6,125,000
Parks and Recreation: $3,253,000
Parks and Recreation: $2,599,000
Solid Waste Management: $25,000
Solid Waste Management: $25,000
- Construction - Regular Highways: $4,821,000
Regular Highways: $4,424,000
General - Other: $2,488,000
General - Other: $1,677,000
Local Fire Protection: $1,495,000
Corrections - Other: $910,000
Parks and Recreation: $542,000
Parks and Recreation: $389,000
Local Fire Protection: $265,000
Corrections - Other: $26,000
- Current Operations - General - Other: $23,867,000
General - Other: $23,730,000
Health - Other: $20,459,000
Health - Other: $20,102,000
Police Protection: $19,986,000
Police Protection: $19,280,000
Public Welfare - Other: $14,745,000
Public Welfare - Other: $13,798,000
Correctional Institutions: $10,472,000
Correctional Institutions: $10,070,000
Regular Highways: $7,491,000
Regular Highways: $7,076,000
Central Staff Services: $6,587,000
Central Staff Services: $6,349,000
Parks and Recreation: $5,621,000
Judicial and Legal Services: $5,480,000
Judicial and Legal Services: $5,141,000
Parks and Recreation: $4,323,000
Financial Administration: $4,100,000
Financial Administration: $3,300,000
General Public Buildings: $2,628,000
General Public Buildings: $2,623,000
Corrections - Other: $2,525,000
Corrections - Other: $2,384,000
Transit Utilities: $1,373,000
Transit Utilities: $1,347,000
Natural Resources - Other: $503,000
Natural Resources - Other: $495,000
Libraries: $436,000
Libraries: $436,000
Solid Waste Management: $180,000
Solid Waste Management: $134,000
Public Welfare, Vendor Payments for Other Purposes: $81,000
Public Welfare, Vendor Payments for Other Purposes: $42,000
Public Welfare, Vendor Payments for Medical Care: $26,000
- Federal Intergovernmental - Highways: $3,730,000
Highways: $668,000
Other: $311,000
Other: $234,000
Health and Hospitals: $219,000
Health and Hospitals: $188,000
- General - Interest on Debt: $3,824,000
Interest on Debt: $3,736,000
- Intergovernmental to Local - Other - Other Higher Education: $3,046,000
Other - Other Higher Education: $2,947,000
Other - Financial Administration: $169,000
Other - Financial Administration: $162,000
- Intergovernmental to State - Public Welfare - Categorical Assistance Programs: $9,438,000
Public Welfare - Categorical Assistance Programs: $9,263,000
Transit Utilities: $2,419,000
Transit Utilities: $2,246,000
Corrections: $117,000
Corrections: $15,000
- Local Intergovernmental - Other: $2,089,000
Other: $1,998,000
Highways: $1,687,000
Highways: $1,125,000
Public Welfare: $907,000
Public Welfare: $787,000
Health and Hospitals: $330,000
Health and Hospitals: $278,000
- Long Term Debt - Beginning Outstanding - Unspecified Public Purpose: $60,590,000
Outstanding Unspecified Public Purpose: $60,513,000
Beginning Outstanding - Unspecified Public Purpose: $57,936,000
Outstanding Unspecified Public Purpose: $52,783,000
Beginning Outstanding - Public Debt for Private Purpose: $20,220,000
Outstanding Nonguaranteed - Industrial Revenue: $18,945,000
Beginning Outstanding - Public Debt for Private Purpose: $17,670,000
Outstanding Nonguaranteed - Industrial Revenue: $16,395,000
Retired Unspecified Public Purpose: $8,468,000
Retired Unspecified Public Purpose: $4,210,000
Issue, Unspecified Public Purpose: $4,133,000
Issue, Unspecified Public Purpose: $3,315,000
Retired Nonguaranteed - Public Debt for Private Purpose: $1,275,000
Retired Nonguaranteed - Public Debt for Private Purpose: $1,275,000
- Miscellaneous - General Revenue - Other: $2,911,000
General Revenue - Other: $2,497,000
Interest Earnings: $950,000
Interest Earnings: $430,000
Fines and Forfeits: $213,000
Fines and Forfeits: $202,000
Donations From Private Sources: $61,000
Sale of Property: $58,000
Sale of Property: $56,000
Donations From Private Sources: $40,000
- Other Capital Outlay - Police Protection: $669,000
General - Other: $647,000
General - Other: $534,000
Police Protection: $501,000
Parks and Recreation: $136,000
Correctional Institutions: $125,000
Correctional Institutions: $88,000
Health - Other: $83,000
Health - Other: $69,000
Central Staff Services: $38,000
Judicial and Legal Services: $38,000
Central Staff Services: $36,000
Public Welfare - Other: $36,000
Parks and Recreation: $24,000
Corrections - Other: $18,000
Regular Highways: $15,000
General Public Building: $9,000
General Public Building: $9,000
Regular Highways: $8,000
Judicial and Legal Services: $5,000
Public Welfare - Other: $4,000
Financial Administration: $3,000
Financial Administration: $2,000
Corrections - Other: $1,000
- Other Funds - Cash and Securities: $41,166,000
Cash and Securities: $28,680,000
- Revenue - Transit Utilities: $113,000
- Sinking Funds - Cash and Securities: $18,945,000
Cash and Securities: $16,395,000
- State Intergovernmental - Public Welfare: $11,107,000
Public Welfare: $10,798,000
Health and Hospitals: $10,422,000
Health and Hospitals: $9,891,000
Other: $7,639,000
Other: $6,189,000
Highways: $1,409,000
Highways: $1,394,000
Education: $10,000
- Tax - General Sales and Gross Receipts: $66,525,000
General Sales and Gross Receipts: $58,888,000
Property: $46,958,000
Property: $46,738,000
Motor Vehicle License: $2,145,000
Other License: $864,000
Other License: $806,000
Other Selective Sales: $701,000
Other Selective Sales: $686,000
- Total Salaries and Wages: $51,202,000
: $49,284,000
Putnam County government finances - Debt in 2018:
- Assistance and Subsidies - Public Welfare, Federal Categorical Assistance Programs: $1,474,000
Public Welfare, Federal Categorical Assistance Programs: $1,396,000
Public Welfare, Cash Assistance Programs - Other: $677,000
Public Welfare, Cash Assistance Programs - Other: $475,000
- Bond Funds - Cash and Securities: $6,685,000
Cash and Securities: $4,560,000
- Charges - Other: $6,178,000
Other: $6,125,000
Parks and Recreation: $3,253,000
Parks and Recreation: $2,599,000
Solid Waste Management: $25,000
Solid Waste Management: $25,000
- Construction - Regular Highways: $4,821,000
Regular Highways: $4,424,000
General - Other: $2,488,000
General - Other: $1,677,000
Local Fire Protection: $1,495,000
Corrections - Other: $910,000
Parks and Recreation: $542,000
Parks and Recreation: $389,000
Local Fire Protection: $265,000
Corrections - Other: $26,000
- Current Operations - General - Other: $23,867,000
General - Other: $23,730,000
Health - Other: $20,459,000
Health - Other: $20,102,000
Police Protection: $19,986,000
Police Protection: $19,280,000
Public Welfare - Other: $14,745,000
Public Welfare - Other: $13,798,000
Correctional Institutions: $10,472,000
Correctional Institutions: $10,070,000
Regular Highways: $7,491,000
Regular Highways: $7,076,000
Central Staff Services: $6,587,000
Central Staff Services: $6,349,000
Parks and Recreation: $5,621,000
Judicial and Legal Services: $5,480,000
Judicial and Legal Services: $5,141,000
Parks and Recreation: $4,323,000
Financial Administration: $4,100,000
Financial Administration: $3,300,000
General Public Buildings: $2,628,000
General Public Buildings: $2,623,000
Corrections - Other: $2,525,000
Corrections - Other: $2,384,000
Transit Utilities: $1,373,000
Transit Utilities: $1,347,000
Natural Resources - Other: $503,000
Natural Resources - Other: $495,000
Libraries: $436,000
Libraries: $436,000
Solid Waste Management: $180,000
Solid Waste Management: $134,000
Public Welfare, Vendor Payments for Other Purposes: $81,000
Public Welfare, Vendor Payments for Other Purposes: $42,000
Public Welfare, Vendor Payments for Medical Care: $26,000
- Federal Intergovernmental - Highways: $3,730,000
Highways: $668,000
Other: $311,000
Other: $234,000
Health and Hospitals: $219,000
Health and Hospitals: $188,000
- General - Interest on Debt: $3,824,000
Interest on Debt: $3,736,000
- Intergovernmental to Local - Other - Other Higher Education: $3,046,000
Other - Other Higher Education: $2,947,000
Other - Financial Administration: $169,000
Other - Financial Administration: $162,000
- Intergovernmental to State - Public Welfare - Categorical Assistance Programs: $9,438,000
Public Welfare - Categorical Assistance Programs: $9,263,000
Transit Utilities: $2,419,000
Transit Utilities: $2,246,000
Corrections: $117,000
Corrections: $15,000
- Local Intergovernmental - Other: $2,089,000
Other: $1,998,000
Highways: $1,687,000
Highways: $1,125,000
Public Welfare: $907,000
Public Welfare: $787,000
Health and Hospitals: $330,000
Health and Hospitals: $278,000
- Long Term Debt - Beginning Outstanding - Unspecified Public Purpose: $60,590,000
Outstanding Unspecified Public Purpose: $60,513,000
Beginning Outstanding - Unspecified Public Purpose: $57,936,000
Outstanding Unspecified Public Purpose: $52,783,000
Beginning Outstanding - Public Debt for Private Purpose: $20,220,000
Outstanding Nonguaranteed - Industrial Revenue: $18,945,000
Beginning Outstanding - Public Debt for Private Purpose: $17,670,000
Outstanding Nonguaranteed - Industrial Revenue: $16,395,000
Retired Unspecified Public Purpose: $8,468,000
Retired Unspecified Public Purpose: $4,210,000
Issue, Unspecified Public Purpose: $4,133,000
Issue, Unspecified Public Purpose: $3,315,000
Retired Nonguaranteed - Public Debt for Private Purpose: $1,275,000
Retired Nonguaranteed - Public Debt for Private Purpose: $1,275,000
- Miscellaneous - General Revenue - Other: $2,911,000
General Revenue - Other: $2,497,000
Interest Earnings: $950,000
Interest Earnings: $430,000
Fines and Forfeits: $213,000
Fines and Forfeits: $202,000
Donations From Private Sources: $61,000
Sale of Property: $58,000
Sale of Property: $56,000
Donations From Private Sources: $40,000
- Other Capital Outlay - Police Protection: $669,000
General - Other: $647,000
General - Other: $534,000
Police Protection: $501,000
Parks and Recreation: $136,000
Correctional Institutions: $125,000
Correctional Institutions: $88,000
Health - Other: $83,000
Health - Other: $69,000
Central Staff Services: $38,000
Judicial and Legal Services: $38,000
Central Staff Services: $36,000
Public Welfare - Other: $36,000
Parks and Recreation: $24,000
Corrections - Other: $18,000
Regular Highways: $15,000
General Public Building: $9,000
General Public Building: $9,000
Regular Highways: $8,000
Judicial and Legal Services: $5,000
Public Welfare - Other: $4,000
Financial Administration: $3,000
Financial Administration: $2,000
Corrections - Other: $1,000
- Other Funds - Cash and Securities: $41,166,000
Cash and Securities: $28,680,000
- Revenue - Transit Utilities: $113,000
- Sinking Funds - Cash and Securities: $18,945,000
Cash and Securities: $16,395,000
- State Intergovernmental - Public Welfare: $11,107,000
Public Welfare: $10,798,000
Health and Hospitals: $10,422,000
Health and Hospitals: $9,891,000
Other: $7,639,000
Other: $6,189,000
Highways: $1,409,000
Highways: $1,394,000
Education: $10,000
- Tax - General Sales and Gross Receipts: $66,525,000
General Sales and Gross Receipts: $58,888,000
Property: $46,958,000
Property: $46,738,000
Motor Vehicle License: $2,145,000
Other License: $864,000
Other License: $806,000
Other Selective Sales: $701,000
Other Selective Sales: $686,000
- Total Salaries and Wages: $51,202,000
: $49,284,000
Putnam County government finances - Cash and Securities in 2018:
- Assistance and Subsidies - Public Welfare, Federal Categorical Assistance Programs: $1,474,000
Public Welfare, Federal Categorical Assistance Programs: $1,396,000
Public Welfare, Cash Assistance Programs - Other: $677,000
Public Welfare, Cash Assistance Programs - Other: $475,000
- Bond Funds - Cash and Securities: $6,685,000
Cash and Securities: $4,560,000
- Charges - Other: $6,178,000
Other: $6,125,000
Parks and Recreation: $3,253,000
Parks and Recreation: $2,599,000
Solid Waste Management: $25,000
Solid Waste Management: $25,000
- Construction - Regular Highways: $4,821,000
Regular Highways: $4,424,000
General - Other: $2,488,000
General - Other: $1,677,000
Local Fire Protection: $1,495,000
Corrections - Other: $910,000
Parks and Recreation: $542,000
Parks and Recreation: $389,000
Local Fire Protection: $265,000
Corrections - Other: $26,000
- Current Operations - General - Other: $23,867,000
General - Other: $23,730,000
Health - Other: $20,459,000
Health - Other: $20,102,000
Police Protection: $19,986,000
Police Protection: $19,280,000
Public Welfare - Other: $14,745,000
Public Welfare - Other: $13,798,000
Correctional Institutions: $10,472,000
Correctional Institutions: $10,070,000
Regular Highways: $7,491,000
Regular Highways: $7,076,000
Central Staff Services: $6,587,000
Central Staff Services: $6,349,000
Parks and Recreation: $5,621,000
Judicial and Legal Services: $5,480,000
Judicial and Legal Services: $5,141,000
Parks and Recreation: $4,323,000
Financial Administration: $4,100,000
Financial Administration: $3,300,000
General Public Buildings: $2,628,000
General Public Buildings: $2,623,000
Corrections - Other: $2,525,000
Corrections - Other: $2,384,000
Transit Utilities: $1,373,000
Transit Utilities: $1,347,000
Natural Resources - Other: $503,000
Natural Resources - Other: $495,000
Libraries: $436,000
Libraries: $436,000
Solid Waste Management: $180,000
Solid Waste Management: $134,000
Public Welfare, Vendor Payments for Other Purposes: $81,000
Public Welfare, Vendor Payments for Other Purposes: $42,000
Public Welfare, Vendor Payments for Medical Care: $26,000
- Federal Intergovernmental - Highways: $3,730,000
Highways: $668,000
Other: $311,000
Other: $234,000
Health and Hospitals: $219,000
Health and Hospitals: $188,000
- General - Interest on Debt: $3,824,000
Interest on Debt: $3,736,000
- Intergovernmental to Local - Other - Other Higher Education: $3,046,000
Other - Other Higher Education: $2,947,000
Other - Financial Administration: $169,000
Other - Financial Administration: $162,000
- Intergovernmental to State - Public Welfare - Categorical Assistance Programs: $9,438,000
Public Welfare - Categorical Assistance Programs: $9,263,000
Transit Utilities: $2,419,000
Transit Utilities: $2,246,000
Corrections: $117,000
Corrections: $15,000
- Local Intergovernmental - Other: $2,089,000
Other: $1,998,000
Highways: $1,687,000
Highways: $1,125,000
Public Welfare: $907,000
Public Welfare: $787,000
Health and Hospitals: $330,000
Health and Hospitals: $278,000
- Long Term Debt - Beginning Outstanding - Unspecified Public Purpose: $60,590,000
Outstanding Unspecified Public Purpose: $60,513,000
Beginning Outstanding - Unspecified Public Purpose: $57,936,000
Outstanding Unspecified Public Purpose: $52,783,000
Beginning Outstanding - Public Debt for Private Purpose: $20,220,000
Outstanding Nonguaranteed - Industrial Revenue: $18,945,000
Beginning Outstanding - Public Debt for Private Purpose: $17,670,000
Outstanding Nonguaranteed - Industrial Revenue: $16,395,000
Retired Unspecified Public Purpose: $8,468,000
Retired Unspecified Public Purpose: $4,210,000
Issue, Unspecified Public Purpose: $4,133,000
Issue, Unspecified Public Purpose: $3,315,000
Retired Nonguaranteed - Public Debt for Private Purpose: $1,275,000
Retired Nonguaranteed - Public Debt for Private Purpose: $1,275,000
- Miscellaneous - General Revenue - Other: $2,911,000
General Revenue - Other: $2,497,000
Interest Earnings: $950,000
Interest Earnings: $430,000
Fines and Forfeits: $213,000
Fines and Forfeits: $202,000
Donations From Private Sources: $61,000
Sale of Property: $58,000
Sale of Property: $56,000
Donations From Private Sources: $40,000
- Other Capital Outlay - Police Protection: $669,000
General - Other: $647,000
General - Other: $534,000
Police Protection: $501,000
Parks and Recreation: $136,000
Correctional Institutions: $125,000
Correctional Institutions: $88,000
Health - Other: $83,000
Health - Other: $69,000
Central Staff Services: $38,000
Judicial and Legal Services: $38,000
Central Staff Services: $36,000
Public Welfare - Other: $36,000
Parks and Recreation: $24,000
Corrections - Other: $18,000
Regular Highways: $15,000
General Public Building: $9,000
General Public Building: $9,000
Regular Highways: $8,000
Judicial and Legal Services: $5,000
Public Welfare - Other: $4,000
Financial Administration: $3,000
Financial Administration: $2,000
Corrections - Other: $1,000
- Other Funds - Cash and Securities: $41,166,000
Cash and Securities: $28,680,000
- Revenue - Transit Utilities: $113,000
- Sinking Funds - Cash and Securities: $18,945,000
Cash and Securities: $16,395,000
- State Intergovernmental - Public Welfare: $11,107,000
Public Welfare: $10,798,000
Health and Hospitals: $10,422,000
Health and Hospitals: $9,891,000
Other: $7,639,000
Other: $6,189,000
Highways: $1,409,000
Highways: $1,394,000
Education: $10,000
- Tax - General Sales and Gross Receipts: $66,525,000
General Sales and Gross Receipts: $58,888,000
Property: $46,958,000
Property: $46,738,000
Motor Vehicle License: $2,145,000
Other License: $864,000
Other License: $806,000
Other Selective Sales: $701,000
Other Selective Sales: $686,000
- Total Salaries and Wages: $51,202,000
: $49,284,000
Supplemental Security Income (SSI) in 2006:
- Total number of recipients: 806
- Number of aged recipients: 126
- Number of blind and disabled recipients: 680
- Number of recipients under 18: 54
- Number of recipients between 18 and 64: 545
- Number of recipients older than 64: 207
- Number of recipients also receiving OASDI: 372
- Amount of payments (thousands of dollars): 366
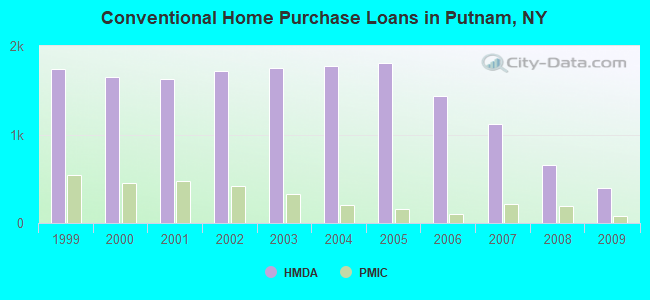
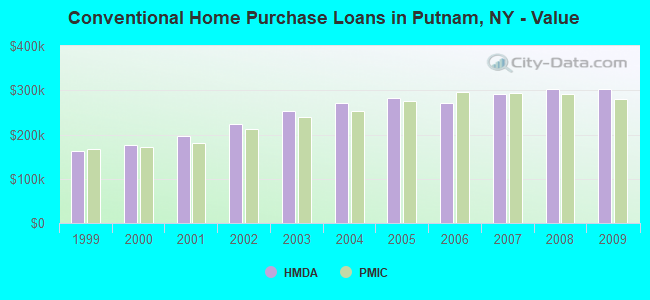
| Home Mortgage Disclosure Act Aggregated Statistics For Year 2009 (Based on 19 full tracts) | ||||||||||||||
| A) FHA, FSA/RHS & VA Home Purchase Loans | B) Conventional Home Purchase Loans | C) Refinancings | D) Home Improvement Loans | E) Loans on Dwellings For 5+ Families | F) Non-occupant Loans on < 5 Family Dwellings (A B C & D) | G) Loans On Manufactured Home Dwelling (A B C & D) | ||||||||
|---|---|---|---|---|---|---|---|---|---|---|---|---|---|---|
| Number | Average Value | Number | Average Value | Number | Average Value | Number | Average Value | Number | Average Value | Number | Average Value | Number | Average Value | |
| LOANS ORIGINATED | 204 | $284,627 | 392 | $302,214 | 1,238 | $264,342 | 64 | $171,266 | 3 | $443,333 | 49 | $289,980 | 1 | $5,000 |
| APPLICATIONS APPROVED, NOT ACCEPTED | 27 | $253,704 | 59 | $269,915 | 175 | $284,994 | 9 | $156,000 | 0 | $0 | 6 | $307,333 | 0 | $0 |
| APPLICATIONS DENIED | 54 | $265,944 | 99 | $281,899 | 836 | $312,402 | 81 | $87,358 | 0 | $0 | 39 | $316,051 | 2 | $125,000 |
| APPLICATIONS WITHDRAWN | 41 | $273,780 | 68 | $260,809 | 468 | $293,588 | 22 | $214,682 | 1 | $450,000 | 17 | $291,118 | 1 | $45,000 |
| FILES CLOSED FOR INCOMPLETENESS | 12 | $283,167 | 15 | $313,933 | 128 | $281,359 | 12 | $301,583 | 0 | $0 | 4 | $416,000 | 0 | $0 |
| Private Mortgage Insurance Companies Aggregated Statistics For Year 2009 (Based on 19 full tracts) | ||||
| A) Conventional Home Purchase Loans | B) Refinancings | |||
|---|---|---|---|---|
| Number | Average Value | Number | Average Value | |
| LOANS ORIGINATED | 80 | $279,638 | 20 | $359,750 |
| APPLICATIONS APPROVED, NOT ACCEPTED | 31 | $291,710 | 15 | $320,667 |
| APPLICATIONS DENIED | 17 | $263,824 | 15 | $279,467 |
| APPLICATIONS WITHDRAWN | 9 | $269,333 | 4 | $294,750 |
| FILES CLOSED FOR INCOMPLETENESS | 3 | $298,333 | 1 | $350,000 |
| Most common first names in Putnam County, NY among deceased individuals | ||
| Name | Count | Lived (average) |
|---|---|---|
| John | 586 | 73.7 years |
| Mary | 495 | 79.6 years |
| William | 411 | 74.3 years |
| Joseph | 387 | 74.7 years |
| James | 266 | 72.5 years |
| Robert | 255 | 69.8 years |
| Anna | 254 | 81.5 years |
| Frank | 252 | 74.1 years |
| Margaret | 239 | 78.9 years |
| Helen | 233 | 79.9 years |
| Most common last names in Putnam County, NY among deceased individuals | ||
| Last name | Count | Lived (average) |
|---|---|---|
| Smith | 107 | 75.5 years |
| Williams | 58 | 75.3 years |
| Miller | 48 | 74.4 years |
| Brown | 43 | 75.8 years |
| Johnson | 42 | 76.7 years |
| Adams | 41 | 77.9 years |
| Anderson | 40 | 72.4 years |
| Murphy | 39 | 73.4 years |
| Jones | 34 | 75.8 years |
| Barrett | 34 | 75.4 years |
| Businesses in Putnam County, NY | ||||
| Name | Count | Name | Count | |
|---|---|---|---|---|
| A&P | 3 | Honda | 1 | |
| AT&T | 1 | KFC | 1 | |
| Advance Auto Parts | 2 | Kmart | 1 | |
| Applebee's | 1 | Kohl's | 1 | |
| Baskin-Robbins | 2 | Marshalls | 1 | |
| Blockbuster | 2 | MasterBrand Cabinets | 3 | |
| Budget Car Rental | 1 | McDonald's | 3 | |
| Burger King | 1 | Quiznos | 1 | |
| CVS | 2 | RadioShack | 1 | |
| Chevrolet | 1 | Rite Aid | 4 | |
| Curves | 1 | Sears | 1 | |
| DHL | 1 | Sprint Nextel | 2 | |
| Decora Cabinetry | 2 | Starbucks | 1 | |
| Domino's Pizza | 1 | Subaru | 1 | |
| DressBarn | 1 | Subway | 4 | |
| Dressbarn | 1 | T-Mobile | 1 | |
| Dunkin Donuts | 7 | The Athlete's Foot | 1 | |
| FedEx | 12 | True Value | 1 | |
| Ford | 2 | U-Haul | 3 | |
| GNC | 4 | UPS | 15 | |
| GameStop | 1 | Wendy's | 1 | |
| H&R Block | 2 | World Gym | 1 | |
| Home Depot | 1 | YMCA | 1 | |
Putnam County on our top lists:
- #49 on the list of "Top 101 counties with the highest surface withdrawal of fresh water for public supply (pop. 50,000+)"
- #50 on the list of "Top 101 counties with the highest surface withdrawal of fresh water for public supply"
- #51 on the list of "Top 101 counties with the lowest Ozone (1-hour) air pollution readings in 2012 (ppm)"
- #71 on the list of "Top 101 counties with the highest total withdrawal of fresh water for public supply (pop. 50,000+)"
- #72 on the list of "Top 101 counties with the highest total withdrawal of fresh water for public supply"
- #89 on the list of "Top 101 counties with the lowest Sulfur Oxides Annual air pollution readings in 2012 (µg/m3)"