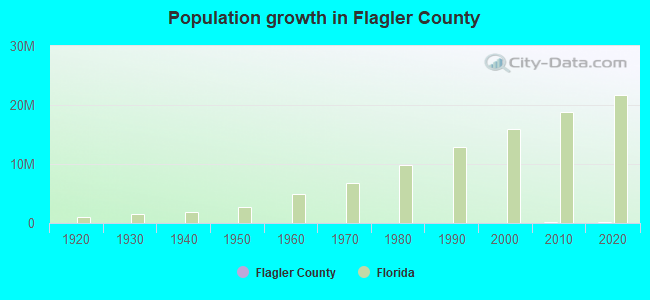
Flagler County, Florida (FL)
County owner-occupied free and clear houses and condos in 2010: 9,747
County owner-occupied houses and condos in 2000: 17,900
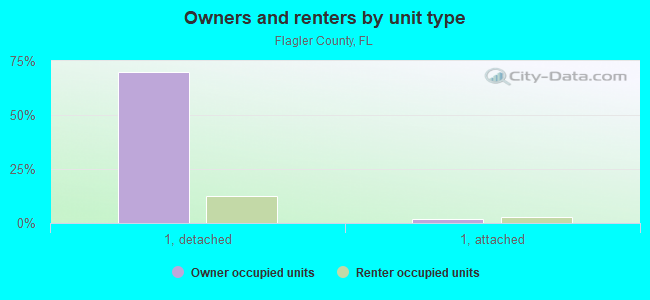
Renter-occupied apartments: 9,166 (it was 3,394 in 2000)
| % of renters here: | 16% |
| State: | 33% |
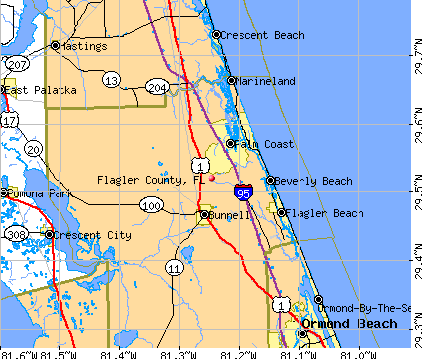
Land area: 485 sq. mi.
Water area: 85.8 sq. mi.
Population density: 261 people per square mile (high).
Industries providing employment: Educational, health and social services (21.0%), Professional, scientific, management, administrative, and waste management services (14.3%), Retail trade (13.3%).
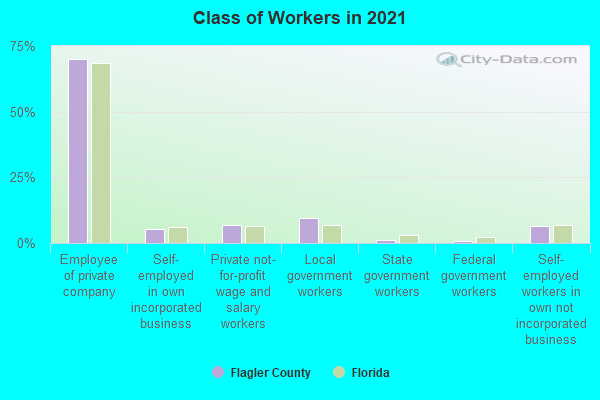
Type of workers:
- Private wage or salary: 80%
- Government: 13%
- Self-employed, not incorporated: 7%
- Unpaid family work: 0%
- OSM Map
- General Map
- Google Map
- MSN Map

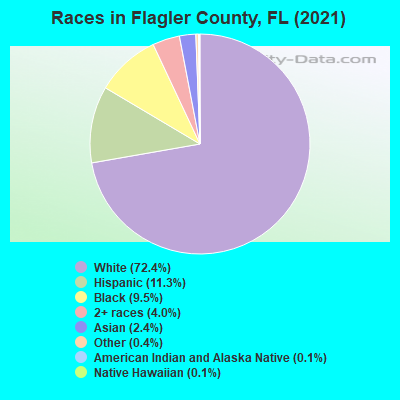
- 92,18472.8%White Non-Hispanic Alone
- 14,93311.8%Hispanic or Latino
- 9,3447.4%Black Non-Hispanic Alone
- 6,5395.2%Two or more races
- 2,7452.2%Asian alone
- 8890.7%Some other race alone
- 710.06%Native Hawaiian and Other
Pacific Islander alone
| Median resident age: | 53.4 years |
| Florida median age: | 42.7 years |
| Males: 61,758 | |
| Females: 64,947 |

 | Flagler County vs St Johns County for gated communities ? (1 reply) |
| What is currently going on with the real estate market in Brevard? (333 replies) |
| Florida is more expensive than NYC (62 replies) |
| Flagler County - Working from home (19 replies) |
| Anyone having second thoughts? (38 replies) |
| Is Orlando southern in culture? (85 replies) |
| Flagler County: | 2.0 people |
| Florida: | 2 people |
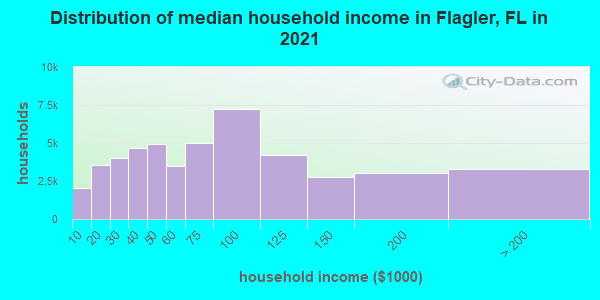
Estimated median household income in 2022: $71,211 ($40,214 in 1999)
| This county: | $71,211 |
| Florida: | $69,303 |
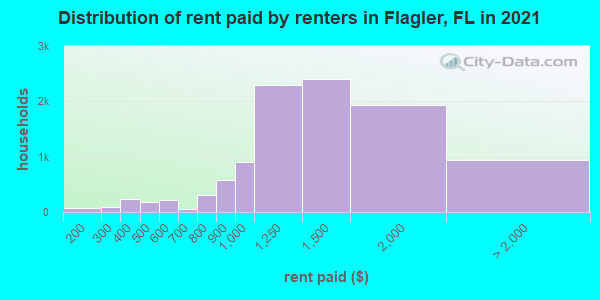
Median contract rent in 2022 for apartments: $1,380 (lower quartile is $1,118, upper quartile is $1,813)
| This county: | $1380 |
| State: | $1367 |
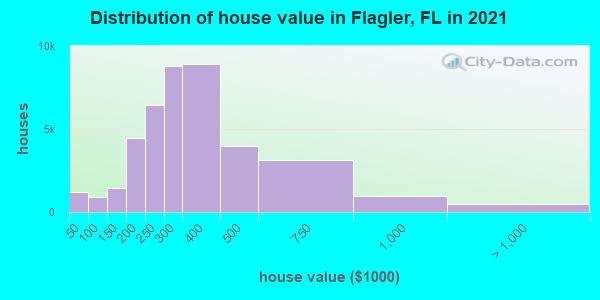
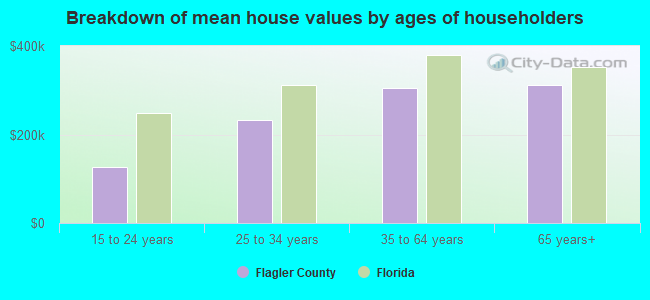
Estimated median house or condo value in 2022: $360,100 (it was $109,400 in 2000)
| Flagler: | $360,100 |
| Florida: | $354,100 |
Mean price in 2022:
Median monthly housing costs for homes and condos with a mortgage: $1,581Detached houses: $347,784
Here: $347,784 State: $500,941 Townhouses or other attached units: $498,390
Here: $498,390 State: $370,869 In 3-to-4-unit structures: $125,945
Here: $125,945 State: $309,944 In 5-or-more-unit structures: $375,414
Here: $375,414 State: $447,145 Mobile homes: $72,966
Here: $72,966 State: $113,202
Median monthly housing costs for units without a mortgage: $550
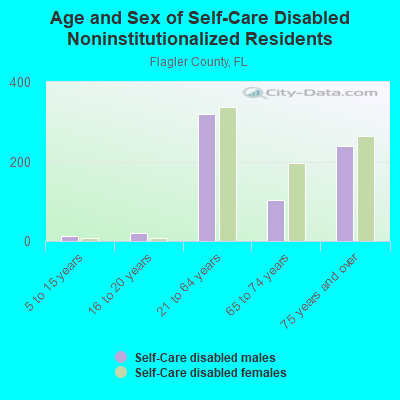
Institutionalized population: 562
Crime in 2020 (reported by the sheriff's office or county police, not the county total):
- Murders: 0
- Rapes: 27
- Robberies: 6
- Assaults: 183
- Burglaries: 83
- Thefts: 628
- Auto thefts: 47
Crime in 2019 (reported by the sheriff's office or county police, not the county total):
- Murders: 3
- Rapes: 36
- Robberies: 8
- Assaults: 125
- Burglaries: 150
- Thefts: 803
- Auto thefts: 69
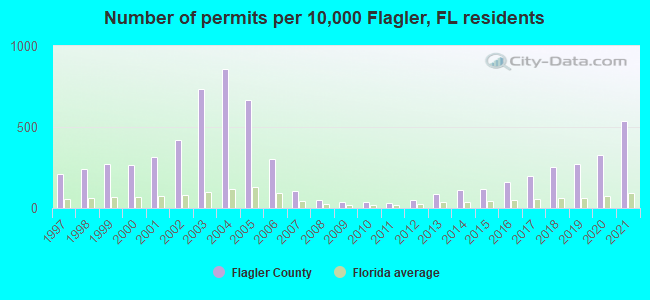
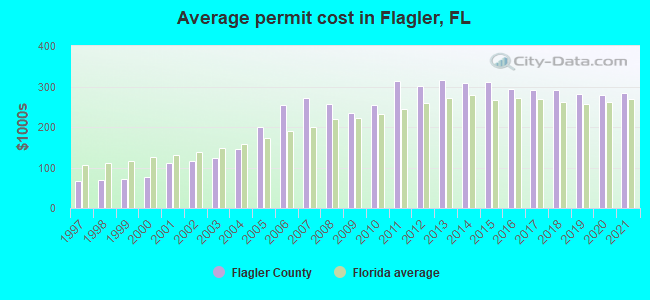
Single-family new house construction building permits:
- 2022: 2562 buildings, average cost: $326,600
- 2021: 2676 buildings, average cost: $283,100
- 2020: 1626 buildings, average cost: $278,000
- 2019: 1345 buildings, average cost: $280,600
- 2018: 1254 buildings, average cost: $291,000
- 2017: 985 buildings, average cost: $291,700
- 2016: 786 buildings, average cost: $295,000
- 2015: 587 buildings, average cost: $311,600
- 2014: 548 buildings, average cost: $308,400
- 2013: 439 buildings, average cost: $316,000
- 2012: 243 buildings, average cost: $300,500
- 2011: 152 buildings, average cost: $313,100
- 2010: 172 buildings, average cost: $254,800
- 2009: 168 buildings, average cost: $233,800
- 2008: 255 buildings, average cost: $258,100
- 2007: 517 buildings, average cost: $271,600
- 2006: 1499 buildings, average cost: $254,600
- 2005: 3335 buildings, average cost: $201,400
- 2004: 4275 buildings, average cost: $145,200
- 2003: 3669 buildings, average cost: $124,300
- 2002: 2100 buildings, average cost: $116,600
- 2001: 1572 buildings, average cost: $111,400
- 2000: 1335 buildings, average cost: $75,800
- 1999: 1342 buildings, average cost: $71,300
- 1998: 1185 buildings, average cost: $68,900
- 1997: 1054 buildings, average cost: $66,500
Median real estate property taxes paid for housing units with mortgages in 2022: $2,566 (0.7%)
Median real estate property taxes paid for housing units with no mortgage in 2022: $2,636 (0.7%)
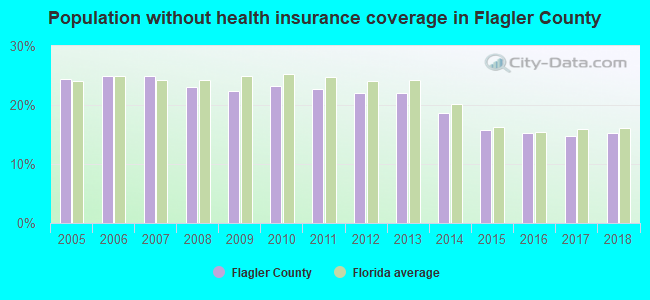
| Flagler County: | 9.2% |
| Florida: | 12.7% |
Median age of residents in 2022: 53.4 years old
(Males: 51.9 years old, Females: 54.2 years old)
(Median age for: White residents: 56.9 years old, Black residents: 54.5 years old, Asian residents: 43.6 years old, Hispanic or Latino residents: 42.1 years old, Other race residents: 27.2 years old)
Fair market rent in 2006 for a 1-bedroom apartment in Flagler County is $588 a month.
Fair market rent for a 2-bedroom apartment is $739 a month.
Fair market rent for a 3-bedroom apartment is $1035 a month.
Cities in this county include: Palm Coast, Flagler Beach, Bunnell, Beverly Beach, Marineland.
| Zip Code | City | Certified Residential Database | Mandatory Residential Database | Mandatory Non-Residential Database | |||
|---|---|---|---|---|---|---|---|
| Buildings Measured | Above 4 pCi/L (%) | Buildings Measured | Above 4 pCi/L (%) | Buildings Measured | Above 4 pCi/L (%) | ||
| 32110 | Bunnell | 2 | 0 | 2 | 0 | 2 | 0 |
| 32136 | Flagler Beach | 4 | 0 | - | - | - | - |
| 32137 | Palm Coast | 7 | 0 | 1 | 0 | 1 | 0 |
| 32142 | Palm Coast | 1 | 0 | - | - | - | - |
| 32164 | Palm Coast | 5 | 0 | - | - | - | - |
2023 air pollution in Flagler County:
Ozone (1-hour): 0.029 ppm (standard limit: 0.12 ppm). Below U.S. average.
Neighboring counties: Fayette County, Texas  .
.
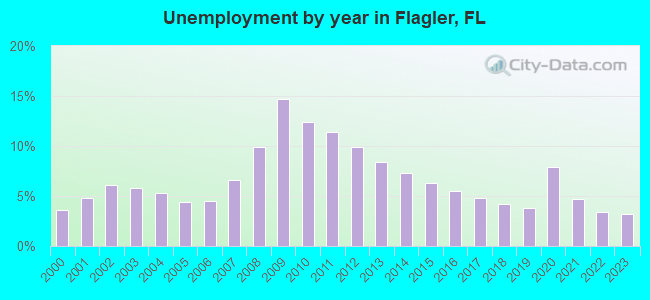
| Here: | 3.7% |
| Florida: | 2.9% |
Current college students: 1,784
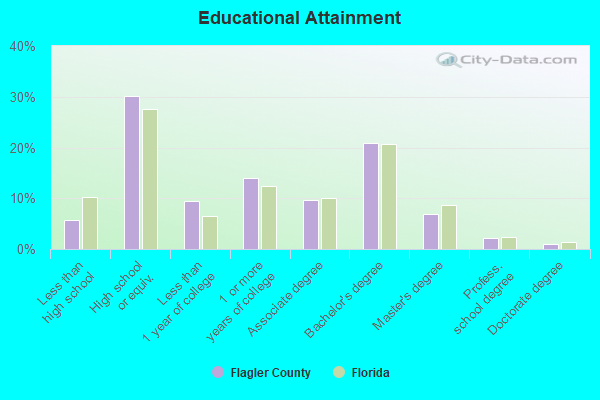
People 25 years of age or older with a high school degree or higher: 93.7%
People 25 years of age or older with a bachelor's degree or higher: 31.7%
Number of foreign born residents: 17,302 (68.9% naturalized citizens)
| Flagler County: | 13.7% |
| Whole state: | 21.7% |
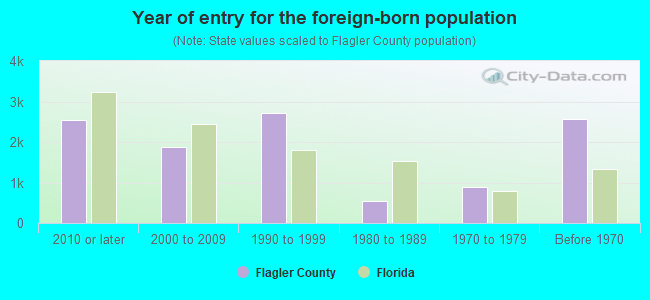
- Year of entry for the foreign-born population
- 3,1522010 or later
- 2,2292000 to 2009
- 2,7211990 to 1999
- 5371980 to 1989
- 8851970 to 1979
- 2,572Before 1970
Mean travel time to work (commute): minutes
Percentage of county residents living and working in this county: 98.0%
Housing units in structures:
- One, detached: 47,545
- One, attached: 2,751
- Two: 1,232
- 3 or 4: 1,535
- 5 to 9: 768
- 10 to 19: 1,360
- 20 to 49: 1,406
- 50 or more: 2,235
- Mobile homes: 1,928
Housing units in Flagler County with a mortgage: 24,486 (1,809 second mortgage, 0 home equity loan, 1,508 both second mortgage and home equity loan)
Houses without a mortgage: 459
| Here: | 5.0% with mortgage |
| State: | 97.6% with mortgage |
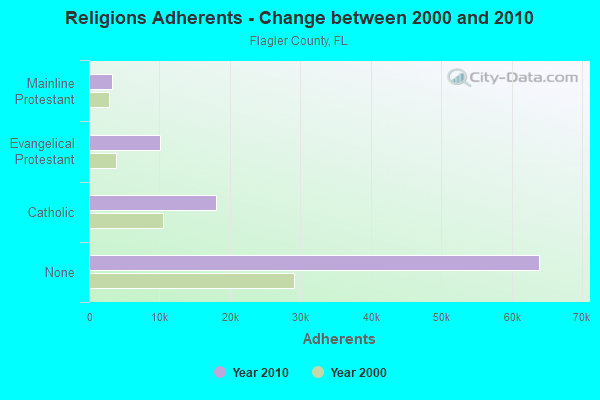
Religion statistics for Flagler County
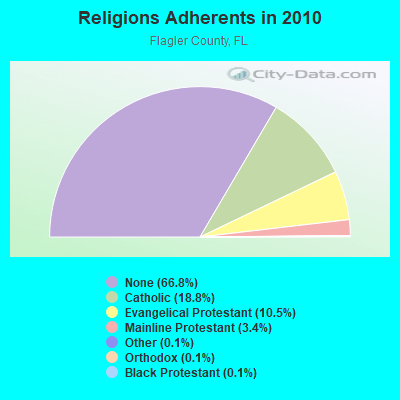
| Religion | Adherents | Congregations |
|---|---|---|
| Catholic | 18,033 | 4 |
| Evangelical Protestant | 10,014 | 52 |
| Mainline Protestant | 3,299 | 6 |
| Other | 142 | 4 |
| Orthodox | 140 | 3 |
| Black Protestant | 118 | 1 |
| None | 63,950 | - |
Source: Clifford Grammich, Kirk Hadaway, Richard Houseal, Dale E.Jones, Alexei Krindatch, Richie Stanley and Richard H.Taylor. 2012. 2010 U.S.Religion Census: Religious Congregations & Membership Study. Association of Statisticians of American Religious Bodies. Jones, Dale E., et al. 2002. Congregations and Membership in the United States 2000. Nashville, TN: Glenmary Research Center.
Food Environment Statistics:
| Flagler County: | 1.36 / 10,000 pop. |
| State: | 2.04 / 10,000 pop. |
| Here: | 0.11 / 10,000 pop. |
| Florida: | 0.11 / 10,000 pop. |
| This county: | 0.45 / 10,000 pop. |
| Florida: | 1.28 / 10,000 pop. |
| Flagler County: | 2.27 / 10,000 pop. |
| Florida: | 3.04 / 10,000 pop. |
| This county: | 7.48 / 10,000 pop. |
| State: | 7.45 / 10,000 pop. |
| Flagler County: | 9.9% |
| Florida: | 9.2% |
| Flagler County: | 22.7% |
| State: | 23.7% |
| Here: | 11.4% |
| State: | 14.0% |
Agriculture in Flagler County:
Average size of farms: 684 acresAverage value of agricultural products sold per farm: $237,894
Average value of crops sold per acre for harvested cropland: $4218.79
The value of livestock, poultry, and their products as a percentage of the total market value of agricultural products sold: 6.15%
Average total farm production expenses per farm: $167,725
Harvested cropland as a percentage of land in farms: 7.74%
Irrigated harvested cropland as a percentage of land in farms: 82.54%
Average market value of all machinery and equipment per farm: $57,382
The percentage of farms operated by a family or individual: 81.00%
Average age of principal farm operators: 55 years
Average number of cattle and calves per 100 acres of all land in farms: 8.75
Vegetables: 1,603 harvested acres
Land in orchards: 9 acres
Earthquake activity:
Flagler County-area historical earthquake activity is significantly above Florida state average. It is 86% smaller than the overall U.S. average.On 9/10/2006 at 14:56:08, a magnitude 5.9 (5.9 MB, 5.5 MS, 5.8 MW, Class: Moderate, Intensity: VI - VII) earthquake occurred 399.2 miles away from Flagler County center
On 11/22/1974 at 05:25:55, a magnitude 4.7 (4.7 MB, Class: Light, Intensity: IV - V) earthquake occurred 242.8 miles away from the county center
On 8/2/1974 at 08:52:09, a magnitude 4.9 (4.3 MB, 4.9 LG) earthquake occurred 309.8 miles away from the county center
On 9/4/2016 at 18:29:29, a magnitude 3.8 (3.8 ML, Class: Light, Intensity: II - III) earthquake occurred 109.8 miles away from the county center
On 9/21/2016 at 16:30:52, a magnitude 3.8 (3.8 ML) earthquake occurred 111.4 miles away from Flagler County center
On 6/23/2016 at 17:20:29, a magnitude 3.8 (3.8 ML) earthquake occurred 112.9 miles away from the county center
Magnitude types: regional Lg-wave magnitude (LG), body-wave magnitude (MB), local magnitude (ML), surface-wave magnitude (MS), moment magnitude (MW)
Most recent natural disasters:
- Florida Covid-19 Pandemic, Incident Period: January 20, 2020, FEMA Id: 4486, Natural disaster type: Other
- Florida Hurricane Dorian, Incident Period: August 28, 2019 - September 9, 2019, FEMA Id: 4468, Natural disaster type: Hurricane
- Florida Hurricane Irma, Incident Period: September 4, 2017 - October 18, 2017, FEMA Id: 4337, Natural disaster type: Hurricane
- Florida Hurricane Matthew, Incident Period: October 03, 2016 to October 19, 2016, Emergency Declared EM-3377: October 06, 2016, FEMA Id: 3377, Natural disaster type: Hurricane
- Florida Hurricane Matthew, Incident Period: October 03, 2016 to October 19, 2016, Major Disaster (Presidential) Declared DR-4283: October 08, 2016, FEMA Id: 4283, Natural disaster type: Hurricane
- Florida Severe Storms, Flooding, Tornadoes, and Straight-line Winds, Incident Period: May 17, 2009 to May 28, 2009, Major Disaster (Presidential) Declared DR-1840: May 27, 2009, FEMA Id: 1840, Natural disaster type: Storm, Tornado, Flood, Wind
- Florida Tropical Storm Fay, Incident Period: August 18, 2008 to September 12, 2008, Major Disaster (Presidential) Declared DR-1785: August 24, 2008, FEMA Id: 1785, Natural disaster type: Tropical Storm
- Florida Tropical Storm Fay, Incident Period: August 18, 2008 to September 12, 2008, Emergency Declared EM-3288: August 21, 2008, FEMA Id: 3288, Natural disaster type: Tropical Storm
- Florida Deland Fire Complex, Incident Period: May 01, 2007 to December 31, 1969, Fire Management Assistance Declared: May 02, 2007, FEMA Id: 2687, Natural disaster type: Fire
- Florida Hurricane Katrina Evacuation, Incident Period: August 29, 2005 to October 01, 2005, Emergency Declared EM-3220: September 05, 2005, FEMA Id: 3220, Natural disaster type: Hurricane
- 12 other natural disasters have been reported since 1953.
The number of natural disasters in Flagler County (22) is greater than the US average (15).
Major Disasters (Presidential) Declared: 12
Emergencies Declared: 5
Causes of natural disasters: Hurricanes: 13, Tropical Storms: 4, Fires: 3, Tornadoes: 2, Flood: 1, Storm: 1, Wind: 1, Other: 1 (Note: some incidents may be assigned to more than one category).
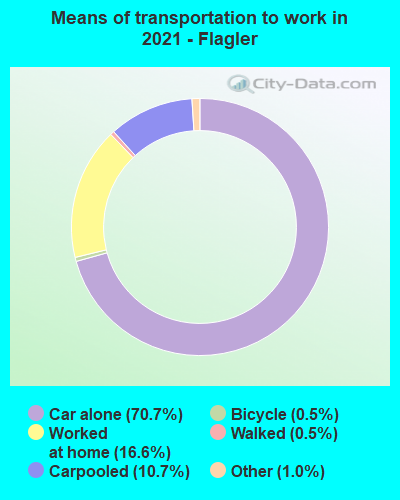
Means of transportation to work:
- Drove a car alone: 22,031 (61.7%)
- Carpooled: 4,567 (12.8%)
- Bus: 11 (0.0%)
- Subway or elevated rail: 5 (0.0%)
- Taxicab, motorcycle, or other means: 358 (1.0%)
- Bicycle: 128 (0.4%)
- Walked: 216 (0.6%)
- Worked at home: 9,570 (26.8%)
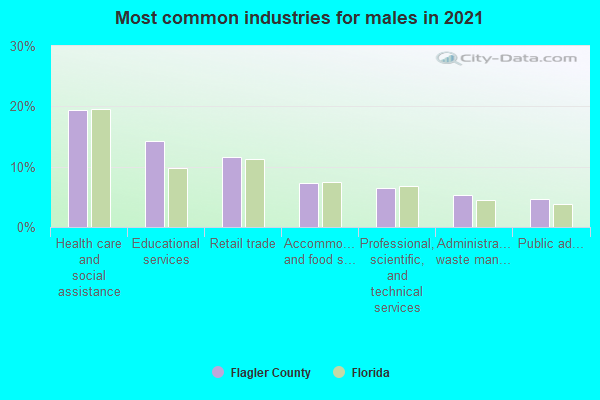
- Health care and social assistance (15%)
- Educational services (15%)
- Retail trade (11%)
- Accommodation and food services (8%)
- Professional, scientific, and technical services (8%)
- Finance and insurance (8%)
- Other services, except public administration (7%)
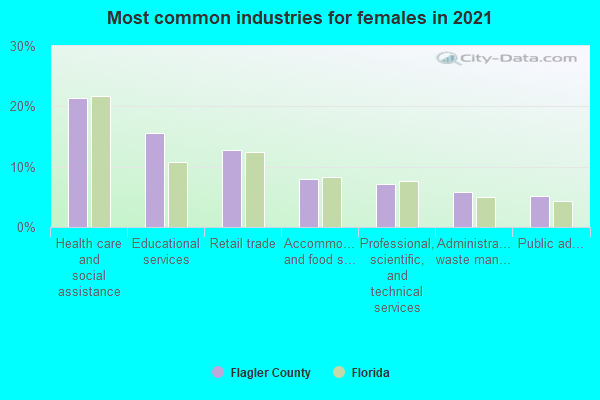
- Health care and social assistance (16%)
- Educational services (15%)
- Retail trade (11%)
- Accommodation and food services (8%)
- Professional, scientific, and technical services (8%)
- Finance and insurance (8%)
- Other services, except public administration (7%)
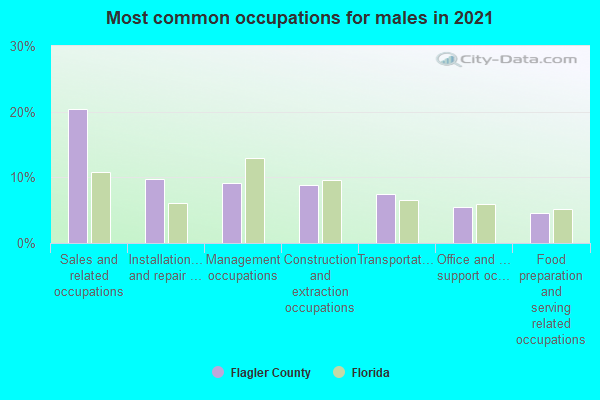
- Sales and related occupations (15%)
- Management occupations (13%)
- Construction and extraction occupations (8%)
- Installation, maintenance, and repair occupations (7%)
- Transportation occupations (7%)
- Office and administrative support occupations (6%)
- Production occupations (5%)
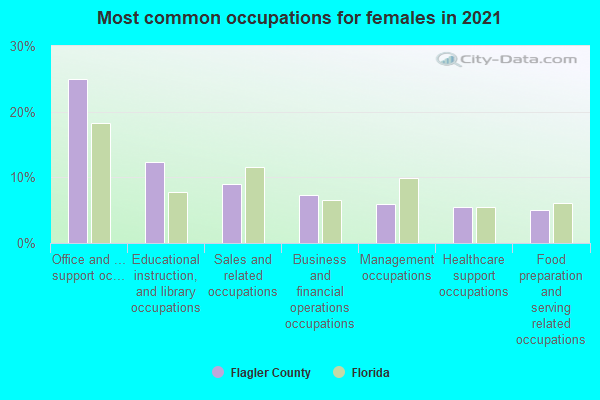
- Office and administrative support occupations (16%)
- Sales and related occupations (14%)
- Management occupations (12%)
- Educational instruction, and library occupations (12%)
- Business and financial operations occupations (8%)
- Food preparation and serving related occupations (7%)
- Production occupations (5%)
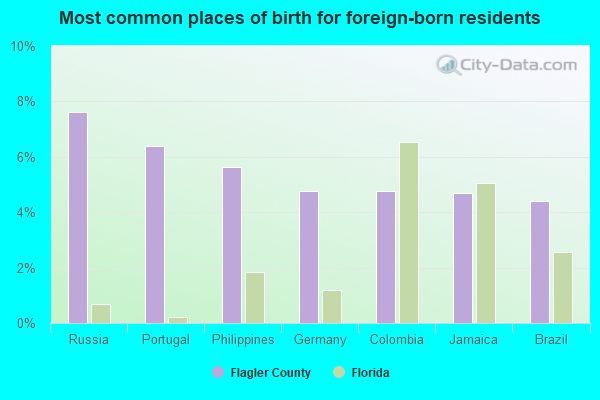
- Portugal (7%)
- Colombia (6%)
- Philippines (6%)
- Brazil (5%)
- Russia (5%)
- Germany (4%)
- Ukraine (4%)
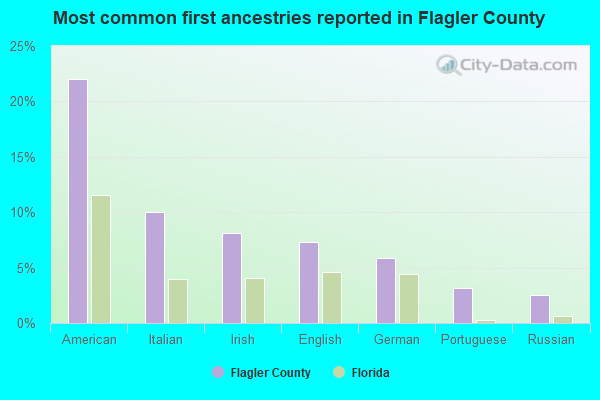
- American (17%)
- Italian (11%)
- English (8%)
- Irish (8%)
- German (6%)
- Portuguese (3%)
- Polish (2%)
People in group quarters in Flagler County, Florida in 2010:
- 260 people in nursing facilities/skilled-nursing facilities
- 164 people in local jails and other municipal confinement facilities
- 138 people in state prisons
- 53 people in workers' group living quarters and job corps centers
- 35 people in group homes intended for adults
- 21 people in emergency and transitional shelters (with sleeping facilities) for people experiencing homelessness
- 9 people in other noninstitutional facilities
- 4 people in residential treatment centers for adults
People in group quarters in Flagler County, Florida in 2000:
- 342 people in nursing homes
- 55 people in local jails and other confinement facilities (including police lockups)
- 29 people in other noninstitutional group quarters
- 26 people in hospitals/wards and hospices for chronically ill
- 26 people in hospices or homes for chronically ill
- 5 people in wards in general hospitals for patients who have no usual home elsewhere
- 5 people in homes for the physically handicapped
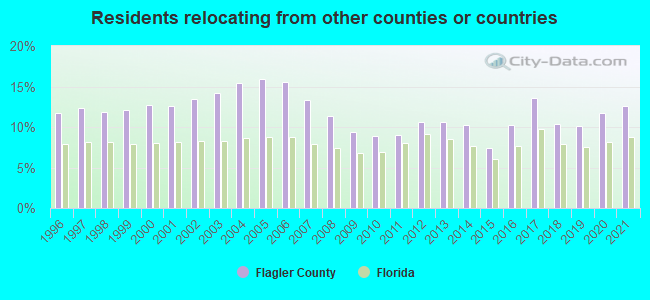
12.61% of this county's 2021 resident taxpayers lived in other counties in 2020 ($93,197 average adjusted gross income)
| Here: | 12.61% |
| Florida average: | 8.80% |
10 or fewer of this county's residents moved from foreign countries.
5.63% relocated from other counties in Florida ($33,973 average AGI)
6.98% relocated from other states ($59,223 average AGI)
Flagler County: 6.98% Florida average: 4.38%
Top counties from which taxpayers relocated into this county between 2020 and 2021:
| from Volusia County, FL | |
| from St. Johns County, FL | |
| from Duval County, FL | |
| from Broward County, FL | |
| from Orange County, FL | |
| from Palm Beach County, FL | |
| from Seminole County, FL |
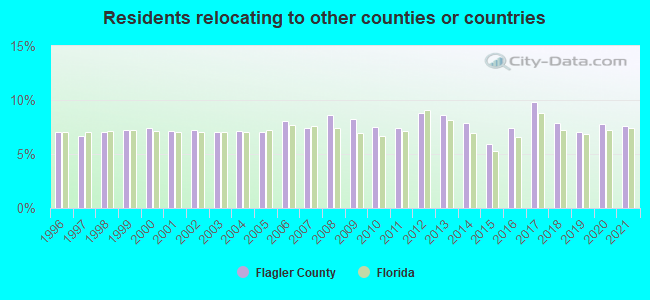
7.58% of this county's 2020 resident taxpayers moved to other counties in 2021 ($60,958 average adjusted gross income)
| Here: | 7.58% |
| Florida average: | 7.45% |
10 or fewer of this county's residents moved to foreign countries.
4.39% relocated to other counties in Florida ($33,575 average AGI)
3.19% relocated to other states ($27,383 average AGI)
Flagler County: 3.19% Florida average: 2.97%
Top counties to which taxpayers relocated from this county between 2020 and 2021:
| to Volusia County, FL | |
| to St. Johns County, FL | |
| to Duval County, FL | |
| to Orange County, FL | |
| to Putnam County, FL | |
| to Clay County, FL | |
| to Marion County, FL |
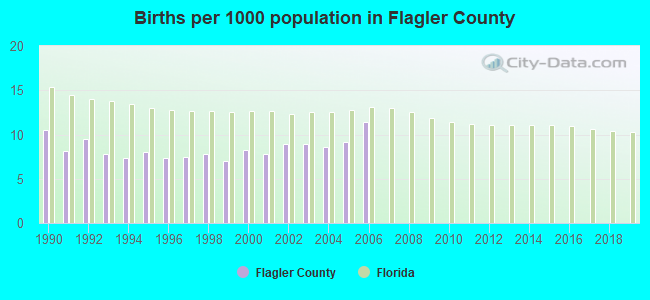
Births per 1000 population from 1990 to 1999: 8.1
Births per 1000 population from 2000 to 2006: 9.0
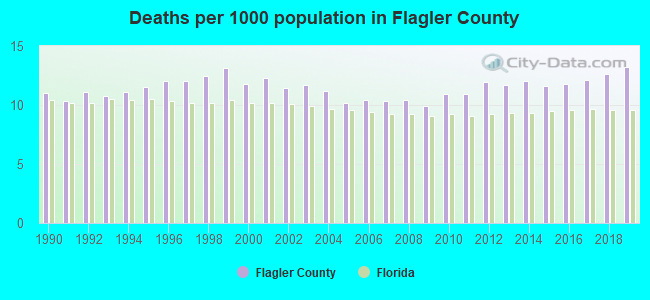
Deaths per 1000 population from 1990 to 1999: 11.5
Deaths per 1000 population from 2000 to 2009: 11.0
Deaths per 1000 population from 2010 to 2020: 12.1
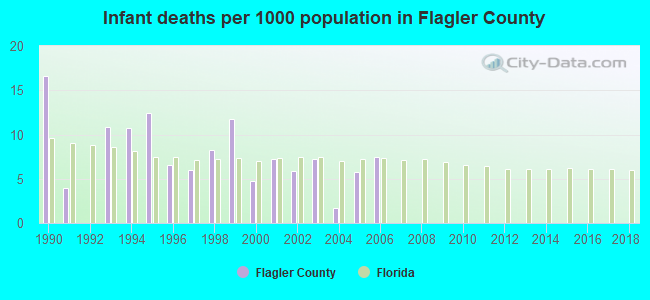
Infant deaths per 1000 live births from 1990 to 1999: 8.7
Infant deaths per 1000 live births from 2000 to 2006: 5.7
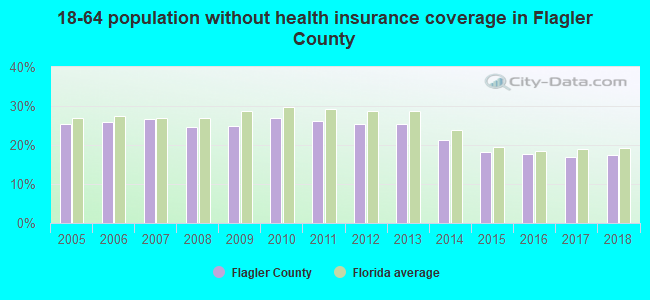
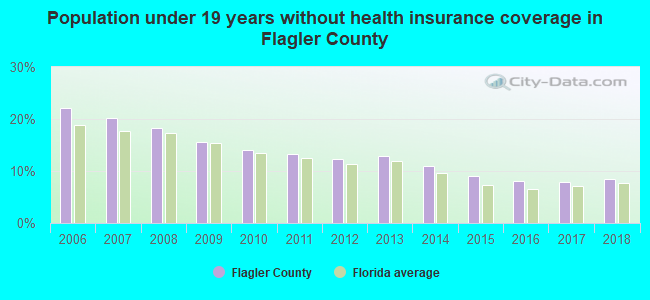
Persons under 19 years old without health insurance coverage in 2018: 8.5%
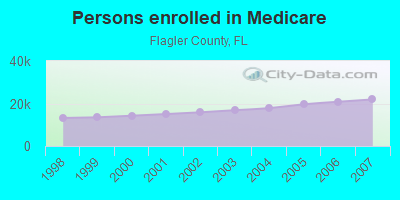
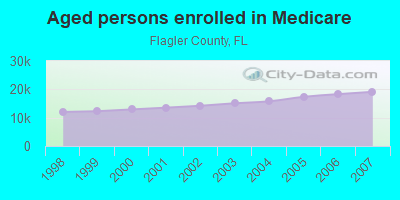
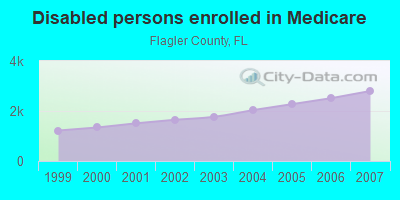
Persons enrolled in hospital insurance and/or supplemental medical insurance (Medicare) in July 1, 2007: 21,922 (19,121 aged, 2,801 disabled)
Children under 18 without health insurance coverage in 2007: 3,390 (19%)
Most common underlying causes of death in Flagler County, Florida in 1999 - 2019:
- Bronchus or lung, unspecified - Malignant neoplasms (1,579)
- Atherosclerotic heart disease (1,512)
- Chronic obstructive pulmonary disease, unspecified (950)
- Acute myocardial infarction, unspecified (821)
- Unspecified dementia (783)
- Stroke, not specified as haemorrhage or infarction (508)
- Alzheimer disease, unspecified (492)
- Colon, unspecified - Malignant neoplasms (386)
- Pancreas, unspecified - Malignant neoplasms (349)
- Breast, unspecified - Malignant neoplasms (344)
Population without health insurance coverage in 2000: 13%
Children under 18 without health insurance coverage in 2000: 12%
Short term general hospital admissions per 100,000 population in 2004: 7,482
Short term general hospital beds per 100,000 population in 2004: 117
Emergency room visits per 100,000 population in 2004: 39,180
General practice office based MDs per 100,000 population in 2005: 915
Medical specialist MDs per 100,000 population in 2005: 1,005
Dentists per 100,000 population in 1998: 5
Total births per 100,000 population, July 2005 - July 2006 : 25
Total deaths per 100,000 population, July 2005 - July 2006: 35
Limited-service eating places per 100,000 population in 2005 : 7
Suicides per 1,000,000 population from 2000 to 2006: 133.6. This is less than state average.
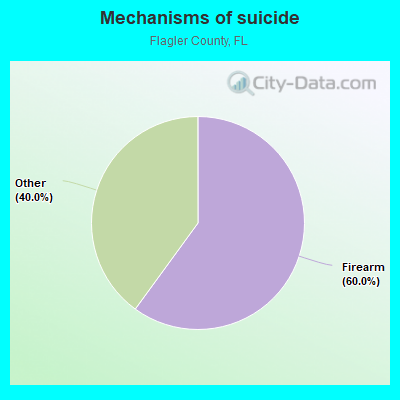
- Firearm - 80.2
- Other - 53.4
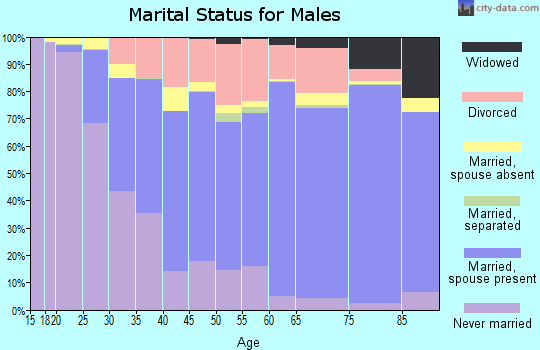
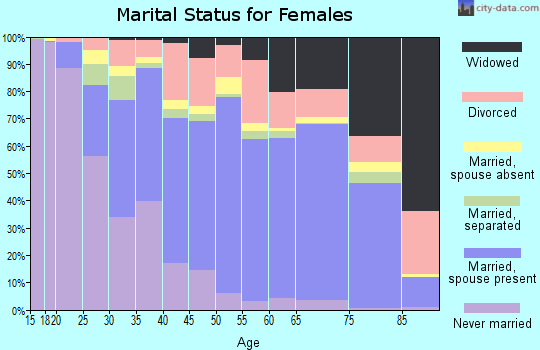
Household type by relationship:
Households: 126,705- Male householders: 27,532 (4,116 living alone), Female householders: 26,832 (7,575 living alone)
31,194 spouses (30,603 opposite-sex spouses), 4,256 unmarried partners, (4,034 opposite-sex unmarried partners), 26,114 children (24,728 natural, 443 adopted, 943 stepchildren), 2,579 grandchildren, 1,413 brothers or sisters, 2,074 parents, 0 foster children, 2,250 other relatives, 1,616 non-relatives
- In group quarters: 845
Size of family households: 23,556 2-persons, 7,500 3-persons, 5,826 4-persons, 1,647 5-persons, 877 6-persons, 328 7-or-more-persons.
Size of nonfamily households: 11,691 1-person, 2,910 2-persons, 29 3-persons.
11,262 married couples with children.
5,463 single-parent households (1,651 men, 3,812 women).
84.7% of residents of Flagler speak English at home.
7.1% of residents speak Spanish at home (62% speak English very well, 24% speak English well, 10% speak English not well, 4% don't speak English at all).
6.5% of residents speak other Indo-European language at home (44% speak English very well, 37% speak English well, 17% speak English not well, 2% don't speak English at all).
1.6% of residents speak Asian or Pacific Island language at home (50% speak English very well, 33% speak English well, 14% speak English not well, 3% don't speak English at all).
0.3% of residents speak other language at home (42% speak English very well, 58% speak English well).
In fiscal year 2004:
Federal Government expenditure: $386,264,000 ($5,598 per capita)
Department of Defense expenditure: $22,114,000
Federal direct payments to individuals for retirement and disability: $289,752,000
Federal other direct payments to individuals: $66,959,000
Federal direct payments not to individuals: $1,239,000
Federal grants: $13,598,000
Federal procurement contracts: $5,802,000 ($11,000 Department of Defense)
Federal salaries and wages: $8,915,000 ($0,000 Department of Defense)
Federal Government direct loans: $562,000
Federal guaranteed/insured loans: $40,048,000
Federal Government insurance: $1,355,984,000
Population change from April 1, 2000 to July 1, 2005:
Births: 2,652| Here: | 35 per 1000 residents |
| State: | 63 per 1000 residents |
Deaths: 3,628
| Here: | 47 per 1000 residents |
| State: | 49 per 1000 residents |
Net international migration: +398
| Here: | +5 per 1000 residents |
| State: | +30 per 1000 residents |
Net internal migration: +27,482
| Here: | +360 per 1000 residents |
| State: | +59 per 1000 residents |
Total withdrawal of fresh water for public supply: 6.22 millions of gallons per day (all from ground)
| Here: | 6.1 |
| State: | 5.9 |
| Here: | 5.2 |
| State: | 4.2 |
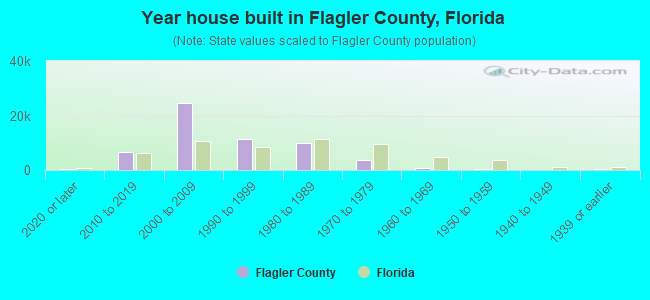
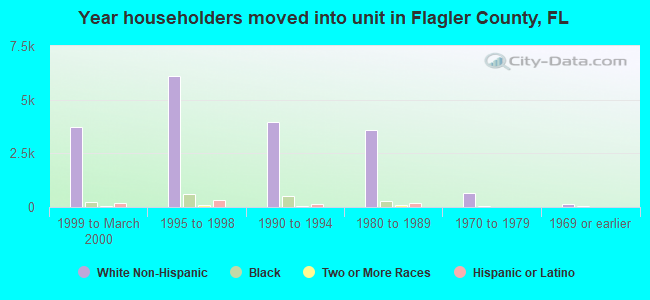
- Year house built in Flagler County, Florida
- 3,2292020 or later
- 10,4912010 to 2019
- 23,3892000 to 2009
- 9,8301990 to 1999
- 9,8981980 to 1989
- 3,2021970 to 1979
- 5291960 to 1969
- 1921950 to 1959
- 01940 to 1949
- 01939 or earlier
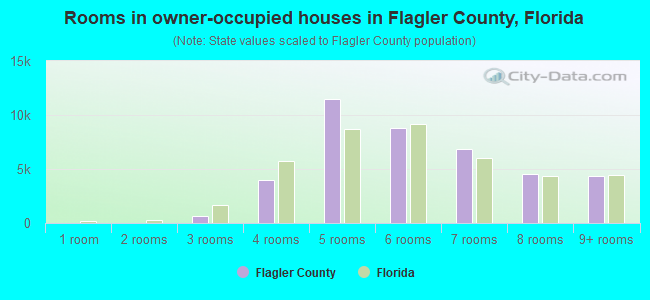
- Rooms in owner-occupied houses in Flagler County, Florida
- 01 room
- 02 rooms
- 4903 rooms
- 5,9284 rooms
- 8,5025 rooms
- 12,8086 rooms
- 8,1277 rooms
- 5,0478 rooms
- 4,1859+ rooms
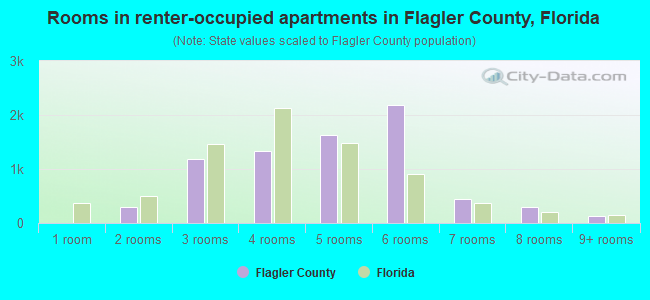
- Rooms in renter-occupied apartments in Flagler County, Florida
- 2401 room
- 02 rooms
- 6013 rooms
- 1,9554 rooms
- 2,5225 rooms
- 1,1266 rooms
- 1,0087 rooms
- 1,5858 rooms
- 2409+ rooms
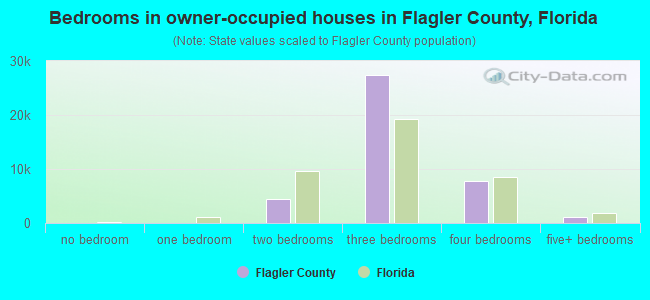
- Bedrooms in owner-occupied houses in Flagler County, Florida
- 53no bedroom
- 01 bedroom
- 6,0122 bedrooms
- 28,2443 bedrooms
- 9,8734 bedrooms
- 9055+ bedrooms
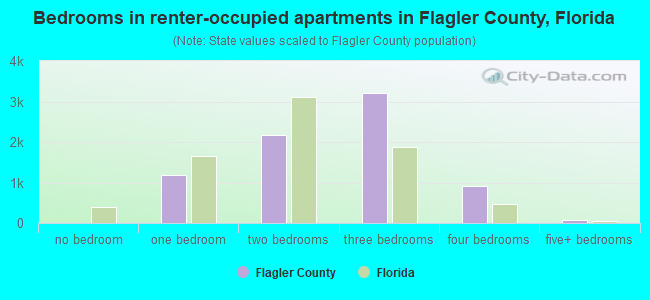
- Bedrooms in renter-occupied apartments in Flagler County, Florida
- 240no bedroom
- 4621 bedroom
- 1,9482 bedrooms
- 4,8473 bedrooms
- 1,7804 bedrooms
- 05+ bedrooms
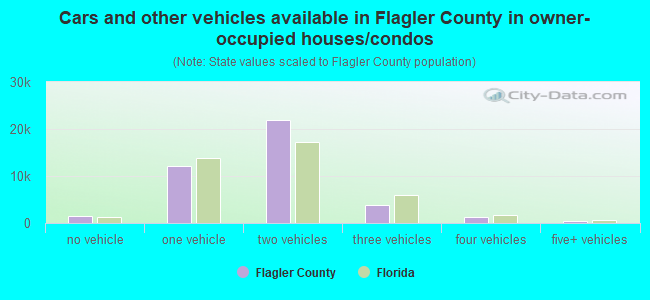
- Cars and other vehicles available in Flagler County in owner-occupied houses/condos
- 1,657no vehicle
- 14,9341 vehicle
- 19,3062 vehicles
- 7,4683 vehicles
- 1,4244 vehicles
- 2985+ vehicles
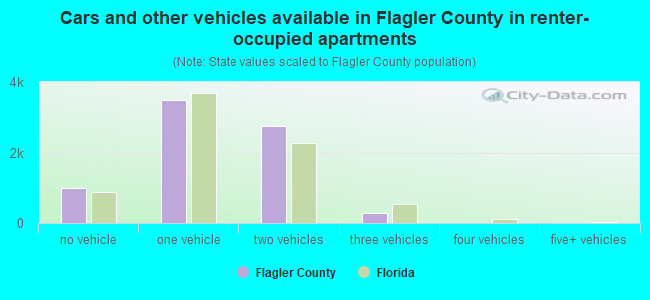
- Cars and other vehicles available in Flagler County in renter-occupied apartments
- 582no vehicle
- 4,1771 vehicle
- 3,4722 vehicles
- 6733 vehicles
- 3334 vehicles
- 405+ vehicles
83.0% of Flagler County residents lived in the same house 1 years ago.
Out of people who lived in different houses, 26% lived in this county.
Out of people who lived in different counties, 38% lived in Florida.
| Flagler County: | 83.0% |
| State average: | 86.3% |
Place of birth for U.S.-born residents:
- This state: 27,388
- Other state: 79,174
- Northeast: 41,568
- Midwest: 13,802
- South: 17,014
- West: 6,790
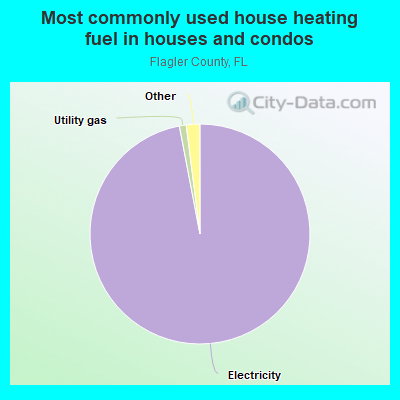
- 96.4%Electricity
- 1.2%Utility gas
- 0.9%No fuel used
- 0.8%Bottled, tank, or LP gas
- 0.4%Solar energy
- 0.2%Other fuel
- 0.1%Wood
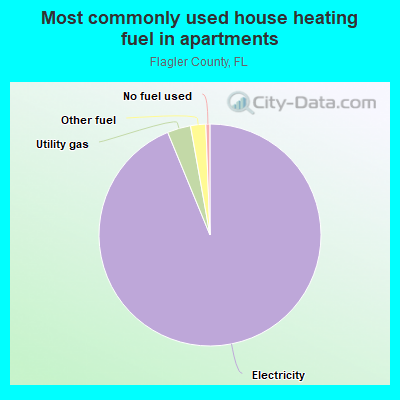
- 92.9%Electricity
- 3.5%Utility gas
- 2.4%Other fuel
- 0.9%No fuel used
- 0.3%Bottled, tank, or LP gas
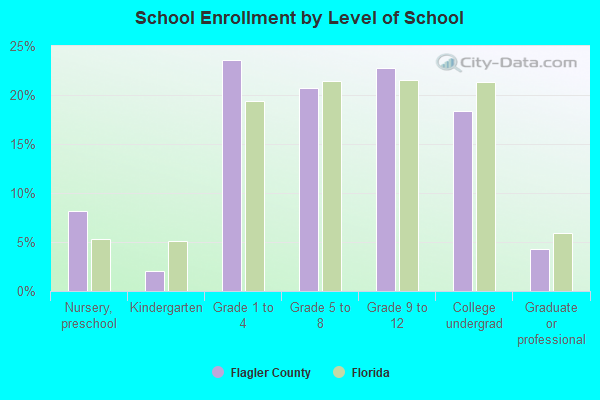
Private vs. public school enrollment:
| Here: | 16.9% |
| Florida: | 15.8% |
| Here: | 15.6% |
| Florida: | 12.9% |
| Here: | 19.1% |
| Florida: | 23.6% |
Flagler County government finances - Expenditure in 2020:
- Bond Funds - Cash and Securities: $7,989,000
Cash and Securities: $4,814,000
- Charges - Other: $11,949,000
Other: $9,156,000
Air Transportation: $2,319,000
Air Transportation: $2,006,000
Solid Waste Management: $1,655,000
Sewerage: $1,601,000
Solid Waste Management: $1,420,000
Sewerage: $1,337,000
Regular Highways: $775,000
Parks and Recreation: $168,000
Parks and Recreation: $121,000
- Construction - General - Other: $11,693,000
Regular Highways: $9,482,000
Regular Highways: $6,868,000
- Current Operations - Police Protection: $23,721,000
General - Other: $18,190,000
Police Protection: $17,138,000
General - Other: $15,592,000
Local Fire Protection: $10,643,000
Local Fire Protection: $9,236,000
Financial Administration: $7,339,000
Correctional Institutions: $7,214,000
Financial Administration: $7,212,000
Correctional Institutions: $6,374,000
Natural Resources - Other: $6,012,000
Regular Highways: $4,248,000
Regular Highways: $3,682,000
Judicial and Legal Services: $3,429,000
Judicial and Legal Services: $3,242,000
Air Transportation: $3,071,000
Air Transportation: $2,726,000
Parks and Recreation: $2,675,000
Health - Other: $2,452,000
Central Staff Services: $2,380,000
Parks and Recreation: $2,341,000
Central Staff Services: $2,168,000
Solid Waste Management: $1,990,000
Solid Waste Management: $1,797,000
Water Utilities: $1,581,000
Water Utilities: $1,580,000
Transit Utilities: $1,525,000
Transit Utilities: $1,506,000
Hospitals: $1,269,000
Hospitals: $1,205,000
Libraries: $1,144,000
Libraries: $1,128,000
General Public Buildings: $1,075,000
General Public Buildings: $1,056,000
Sewerage: $919,000
Protective Inspection and Regulation - Other: $895,000
Sewerage: $861,000
Health - Other: $732,000
Protective Inspection and Regulation - Other: $704,000
Public Welfare - Other: $696,000
Public Welfare - Other: $657,000
Natural Resources - Other: $613,000
- Federal Intergovernmental - Air Transportation: $8,585,000
Other: $2,420,000
Other: $1,730,000
Highways: $688,000
Transit Utilities: $536,000
Transit Utilities: $525,000
Public Welfare: $395,000
Public Welfare: $385,000
Sewerage: $295,000
Air Transportation: $259,000
Sewerage: $122,000
- General - Interest on Debt: $4,293,000
Interest on Debt: $3,750,000
- Intergovernmental to State - Health - Other: $1,800,000
Health - Other: $1,800,000
- Local Intergovernmental - Other: $2,775,000
Other: $839,000
Public Welfare: $12,000
Public Welfare: $10,000
- Long Term Debt - Outstanding Unspecified Public Purpose: $116,036,000
Beginning Outstanding - Unspecified Public Purpose: $115,107,000
Beginning Outstanding - Unspecified Public Purpose: $107,435,000
Outstanding Unspecified Public Purpose: $96,569,000
Retired Unspecified Public Purpose: $11,071,000
Retired Unspecified Public Purpose: $10,474,000
Issue, Unspecified Public Purpose: $2,200,000
Issue, Unspecified Public Purpose: $1,581,000
- Miscellaneous - Interest Earnings: $2,111,000
Special Assessments: $1,741,000
Donations From Private Sources: $1,093,000
General Revenue - Other: $1,003,000
Fines and Forfeits: $1,002,000
Special Assessments: $993,000
Fines and Forfeits: $861,000
General Revenue - Other: $766,000
Interest Earnings: $489,000
Rents: $189,000
Rents: $153,000
Donations From Private Sources: $126,000
Sale of Property: $100,000
Sale of Property: $48,000
- Other Capital Outlay - Natural Resources - Other: $2,206,000
General - Other: $1,980,000
Parks and Recreation: $1,978,000
Police Protection: $1,697,000
Local Fire Protection: $1,427,000
Local Fire Protection: $1,092,000
Parks and Recreation: $482,000
Police Protection: $477,000
Financial Administration: $351,000
Transit Utilities: $334,000
Transit Utilities: $328,000
Protective Inspection and Regulation - Other: $321,000
Natural Resources - Other: $212,000
Correctional Institutions: $155,000
Judicial and Legal Services: $152,000
Financial Administration: $100,000
Correctional Institutions: $47,000
Protective Inspection and Regulation - Other: $45,000
Central Staff Services: $21,000
Judicial and Legal Services: $13,000
Libraries: $9,000
Health - Other: $7,000
Libraries: $6,000
Health - Other: $3,000
Central Staff Services: $2,000
General Public Building: $2,000
- Other Funds - Cash and Securities: $73,810,000
Cash and Securities: $52,748,000
- Revenue - Water Utilities: $1,608,000
Water Utilities: $1,430,000
Transit Utilities: $177,000
Transit Utilities: $155,000
- Sinking Funds - Cash and Securities: $4,950,000
Cash and Securities: $3,949,000
- State Intergovernmental - Highways: $9,910,000
Highways: $9,230,000
Other: $6,496,000
General Local Government Support: $4,477,000
Other: $4,167,000
General Local Government Support: $4,046,000
Health and Hospitals: $357,000
Health and Hospitals: $350,000
Public Welfare: $207,000
Public Welfare: $167,000
- Tax - Property: $71,491,000
Property: $61,692,000
General Sales and Gross Receipts: $2,892,000
Other Selective Sales: $2,745,000
General Sales and Gross Receipts: $2,588,000
Other Selective Sales: $2,214,000
Other License: $1,090,000
Motor Fuels Sales: $1,027,000
Motor Fuels Sales: $984,000
Documentary and Stock Transfer: $968,000
Documentary and Stock Transfer: $916,000
Other License: $900,000
Public Utilities Sales: $190,000
Public Utilities Sales: $185,000
Occupation and Business License - Other: $164,000
Occupation and Business License - Other: $140,000
Flagler County government finances - Revenue in 2020:
- Bond Funds - Cash and Securities: $7,989,000
Cash and Securities: $4,814,000
- Charges - Other: $11,949,000
Other: $9,156,000
Air Transportation: $2,319,000
Air Transportation: $2,006,000
Solid Waste Management: $1,655,000
Sewerage: $1,601,000
Solid Waste Management: $1,420,000
Sewerage: $1,337,000
Regular Highways: $775,000
Parks and Recreation: $168,000
Parks and Recreation: $121,000
- Construction - General - Other: $11,693,000
Regular Highways: $9,482,000
Regular Highways: $6,868,000
- Current Operations - Police Protection: $23,721,000
General - Other: $18,190,000
Police Protection: $17,138,000
General - Other: $15,592,000
Local Fire Protection: $10,643,000
Local Fire Protection: $9,236,000
Financial Administration: $7,339,000
Correctional Institutions: $7,214,000
Financial Administration: $7,212,000
Correctional Institutions: $6,374,000
Natural Resources - Other: $6,012,000
Regular Highways: $4,248,000
Regular Highways: $3,682,000
Judicial and Legal Services: $3,429,000
Judicial and Legal Services: $3,242,000
Air Transportation: $3,071,000
Air Transportation: $2,726,000
Parks and Recreation: $2,675,000
Health - Other: $2,452,000
Central Staff Services: $2,380,000
Parks and Recreation: $2,341,000
Central Staff Services: $2,168,000
Solid Waste Management: $1,990,000
Solid Waste Management: $1,797,000
Water Utilities: $1,581,000
Water Utilities: $1,580,000
Transit Utilities: $1,525,000
Transit Utilities: $1,506,000
Hospitals: $1,269,000
Hospitals: $1,205,000
Libraries: $1,144,000
Libraries: $1,128,000
General Public Buildings: $1,075,000
General Public Buildings: $1,056,000
Sewerage: $919,000
Protective Inspection and Regulation - Other: $895,000
Sewerage: $861,000
Health - Other: $732,000
Protective Inspection and Regulation - Other: $704,000
Public Welfare - Other: $696,000
Public Welfare - Other: $657,000
Natural Resources - Other: $613,000
- Federal Intergovernmental - Air Transportation: $8,585,000
Other: $2,420,000
Other: $1,730,000
Highways: $688,000
Transit Utilities: $536,000
Transit Utilities: $525,000
Public Welfare: $395,000
Public Welfare: $385,000
Sewerage: $295,000
Air Transportation: $259,000
Sewerage: $122,000
- General - Interest on Debt: $4,293,000
Interest on Debt: $3,750,000
- Intergovernmental to State - Health - Other: $1,800,000
Health - Other: $1,800,000
- Local Intergovernmental - Other: $2,775,000
Other: $839,000
Public Welfare: $12,000
Public Welfare: $10,000
- Long Term Debt - Outstanding Unspecified Public Purpose: $116,036,000
Beginning Outstanding - Unspecified Public Purpose: $115,107,000
Beginning Outstanding - Unspecified Public Purpose: $107,435,000
Outstanding Unspecified Public Purpose: $96,569,000
Retired Unspecified Public Purpose: $11,071,000
Retired Unspecified Public Purpose: $10,474,000
Issue, Unspecified Public Purpose: $2,200,000
Issue, Unspecified Public Purpose: $1,581,000
- Miscellaneous - Interest Earnings: $2,111,000
Special Assessments: $1,741,000
Donations From Private Sources: $1,093,000
General Revenue - Other: $1,003,000
Fines and Forfeits: $1,002,000
Special Assessments: $993,000
Fines and Forfeits: $861,000
General Revenue - Other: $766,000
Interest Earnings: $489,000
Rents: $189,000
Rents: $153,000
Donations From Private Sources: $126,000
Sale of Property: $100,000
Sale of Property: $48,000
- Other Capital Outlay - Natural Resources - Other: $2,206,000
General - Other: $1,980,000
Parks and Recreation: $1,978,000
Police Protection: $1,697,000
Local Fire Protection: $1,427,000
Local Fire Protection: $1,092,000
Parks and Recreation: $482,000
Police Protection: $477,000
Financial Administration: $351,000
Transit Utilities: $334,000
Transit Utilities: $328,000
Protective Inspection and Regulation - Other: $321,000
Natural Resources - Other: $212,000
Correctional Institutions: $155,000
Judicial and Legal Services: $152,000
Financial Administration: $100,000
Correctional Institutions: $47,000
Protective Inspection and Regulation - Other: $45,000
Central Staff Services: $21,000
Judicial and Legal Services: $13,000
Libraries: $9,000
Health - Other: $7,000
Libraries: $6,000
Health - Other: $3,000
Central Staff Services: $2,000
General Public Building: $2,000
- Other Funds - Cash and Securities: $73,810,000
Cash and Securities: $52,748,000
- Revenue - Water Utilities: $1,608,000
Water Utilities: $1,430,000
Transit Utilities: $177,000
Transit Utilities: $155,000
- Sinking Funds - Cash and Securities: $4,950,000
Cash and Securities: $3,949,000
- State Intergovernmental - Highways: $9,910,000
Highways: $9,230,000
Other: $6,496,000
General Local Government Support: $4,477,000
Other: $4,167,000
General Local Government Support: $4,046,000
Health and Hospitals: $357,000
Health and Hospitals: $350,000
Public Welfare: $207,000
Public Welfare: $167,000
- Tax - Property: $71,491,000
Property: $61,692,000
General Sales and Gross Receipts: $2,892,000
Other Selective Sales: $2,745,000
General Sales and Gross Receipts: $2,588,000
Other Selective Sales: $2,214,000
Other License: $1,090,000
Motor Fuels Sales: $1,027,000
Motor Fuels Sales: $984,000
Documentary and Stock Transfer: $968,000
Documentary and Stock Transfer: $916,000
Other License: $900,000
Public Utilities Sales: $190,000
Public Utilities Sales: $185,000
Occupation and Business License - Other: $164,000
Occupation and Business License - Other: $140,000
Flagler County government finances - Debt in 2020:
- Bond Funds - Cash and Securities: $7,989,000
Cash and Securities: $4,814,000
- Charges - Other: $11,949,000
Other: $9,156,000
Air Transportation: $2,319,000
Air Transportation: $2,006,000
Solid Waste Management: $1,655,000
Sewerage: $1,601,000
Solid Waste Management: $1,420,000
Sewerage: $1,337,000
Regular Highways: $775,000
Parks and Recreation: $168,000
Parks and Recreation: $121,000
- Construction - General - Other: $11,693,000
Regular Highways: $9,482,000
Regular Highways: $6,868,000
- Current Operations - Police Protection: $23,721,000
General - Other: $18,190,000
Police Protection: $17,138,000
General - Other: $15,592,000
Local Fire Protection: $10,643,000
Local Fire Protection: $9,236,000
Financial Administration: $7,339,000
Correctional Institutions: $7,214,000
Financial Administration: $7,212,000
Correctional Institutions: $6,374,000
Natural Resources - Other: $6,012,000
Regular Highways: $4,248,000
Regular Highways: $3,682,000
Judicial and Legal Services: $3,429,000
Judicial and Legal Services: $3,242,000
Air Transportation: $3,071,000
Air Transportation: $2,726,000
Parks and Recreation: $2,675,000
Health - Other: $2,452,000
Central Staff Services: $2,380,000
Parks and Recreation: $2,341,000
Central Staff Services: $2,168,000
Solid Waste Management: $1,990,000
Solid Waste Management: $1,797,000
Water Utilities: $1,581,000
Water Utilities: $1,580,000
Transit Utilities: $1,525,000
Transit Utilities: $1,506,000
Hospitals: $1,269,000
Hospitals: $1,205,000
Libraries: $1,144,000
Libraries: $1,128,000
General Public Buildings: $1,075,000
General Public Buildings: $1,056,000
Sewerage: $919,000
Protective Inspection and Regulation - Other: $895,000
Sewerage: $861,000
Health - Other: $732,000
Protective Inspection and Regulation - Other: $704,000
Public Welfare - Other: $696,000
Public Welfare - Other: $657,000
Natural Resources - Other: $613,000
- Federal Intergovernmental - Air Transportation: $8,585,000
Other: $2,420,000
Other: $1,730,000
Highways: $688,000
Transit Utilities: $536,000
Transit Utilities: $525,000
Public Welfare: $395,000
Public Welfare: $385,000
Sewerage: $295,000
Air Transportation: $259,000
Sewerage: $122,000
- General - Interest on Debt: $4,293,000
Interest on Debt: $3,750,000
- Intergovernmental to State - Health - Other: $1,800,000
Health - Other: $1,800,000
- Local Intergovernmental - Other: $2,775,000
Other: $839,000
Public Welfare: $12,000
Public Welfare: $10,000
- Long Term Debt - Outstanding Unspecified Public Purpose: $116,036,000
Beginning Outstanding - Unspecified Public Purpose: $115,107,000
Beginning Outstanding - Unspecified Public Purpose: $107,435,000
Outstanding Unspecified Public Purpose: $96,569,000
Retired Unspecified Public Purpose: $11,071,000
Retired Unspecified Public Purpose: $10,474,000
Issue, Unspecified Public Purpose: $2,200,000
Issue, Unspecified Public Purpose: $1,581,000
- Miscellaneous - Interest Earnings: $2,111,000
Special Assessments: $1,741,000
Donations From Private Sources: $1,093,000
General Revenue - Other: $1,003,000
Fines and Forfeits: $1,002,000
Special Assessments: $993,000
Fines and Forfeits: $861,000
General Revenue - Other: $766,000
Interest Earnings: $489,000
Rents: $189,000
Rents: $153,000
Donations From Private Sources: $126,000
Sale of Property: $100,000
Sale of Property: $48,000
- Other Capital Outlay - Natural Resources - Other: $2,206,000
General - Other: $1,980,000
Parks and Recreation: $1,978,000
Police Protection: $1,697,000
Local Fire Protection: $1,427,000
Local Fire Protection: $1,092,000
Parks and Recreation: $482,000
Police Protection: $477,000
Financial Administration: $351,000
Transit Utilities: $334,000
Transit Utilities: $328,000
Protective Inspection and Regulation - Other: $321,000
Natural Resources - Other: $212,000
Correctional Institutions: $155,000
Judicial and Legal Services: $152,000
Financial Administration: $100,000
Correctional Institutions: $47,000
Protective Inspection and Regulation - Other: $45,000
Central Staff Services: $21,000
Judicial and Legal Services: $13,000
Libraries: $9,000
Health - Other: $7,000
Libraries: $6,000
Health - Other: $3,000
Central Staff Services: $2,000
General Public Building: $2,000
- Other Funds - Cash and Securities: $73,810,000
Cash and Securities: $52,748,000
- Revenue - Water Utilities: $1,608,000
Water Utilities: $1,430,000
Transit Utilities: $177,000
Transit Utilities: $155,000
- Sinking Funds - Cash and Securities: $4,950,000
Cash and Securities: $3,949,000
- State Intergovernmental - Highways: $9,910,000
Highways: $9,230,000
Other: $6,496,000
General Local Government Support: $4,477,000
Other: $4,167,000
General Local Government Support: $4,046,000
Health and Hospitals: $357,000
Health and Hospitals: $350,000
Public Welfare: $207,000
Public Welfare: $167,000
- Tax - Property: $71,491,000
Property: $61,692,000
General Sales and Gross Receipts: $2,892,000
Other Selective Sales: $2,745,000
General Sales and Gross Receipts: $2,588,000
Other Selective Sales: $2,214,000
Other License: $1,090,000
Motor Fuels Sales: $1,027,000
Motor Fuels Sales: $984,000
Documentary and Stock Transfer: $968,000
Documentary and Stock Transfer: $916,000
Other License: $900,000
Public Utilities Sales: $190,000
Public Utilities Sales: $185,000
Occupation and Business License - Other: $164,000
Occupation and Business License - Other: $140,000
Flagler County government finances - Cash and Securities in 2020:
- Bond Funds - Cash and Securities: $7,989,000
Cash and Securities: $4,814,000
- Charges - Other: $11,949,000
Other: $9,156,000
Air Transportation: $2,319,000
Air Transportation: $2,006,000
Solid Waste Management: $1,655,000
Sewerage: $1,601,000
Solid Waste Management: $1,420,000
Sewerage: $1,337,000
Regular Highways: $775,000
Parks and Recreation: $168,000
Parks and Recreation: $121,000
- Construction - General - Other: $11,693,000
Regular Highways: $9,482,000
Regular Highways: $6,868,000
- Current Operations - Police Protection: $23,721,000
General - Other: $18,190,000
Police Protection: $17,138,000
General - Other: $15,592,000
Local Fire Protection: $10,643,000
Local Fire Protection: $9,236,000
Financial Administration: $7,339,000
Correctional Institutions: $7,214,000
Financial Administration: $7,212,000
Correctional Institutions: $6,374,000
Natural Resources - Other: $6,012,000
Regular Highways: $4,248,000
Regular Highways: $3,682,000
Judicial and Legal Services: $3,429,000
Judicial and Legal Services: $3,242,000
Air Transportation: $3,071,000
Air Transportation: $2,726,000
Parks and Recreation: $2,675,000
Health - Other: $2,452,000
Central Staff Services: $2,380,000
Parks and Recreation: $2,341,000
Central Staff Services: $2,168,000
Solid Waste Management: $1,990,000
Solid Waste Management: $1,797,000
Water Utilities: $1,581,000
Water Utilities: $1,580,000
Transit Utilities: $1,525,000
Transit Utilities: $1,506,000
Hospitals: $1,269,000
Hospitals: $1,205,000
Libraries: $1,144,000
Libraries: $1,128,000
General Public Buildings: $1,075,000
General Public Buildings: $1,056,000
Sewerage: $919,000
Protective Inspection and Regulation - Other: $895,000
Sewerage: $861,000
Health - Other: $732,000
Protective Inspection and Regulation - Other: $704,000
Public Welfare - Other: $696,000
Public Welfare - Other: $657,000
Natural Resources - Other: $613,000
- Federal Intergovernmental - Air Transportation: $8,585,000
Other: $2,420,000
Other: $1,730,000
Highways: $688,000
Transit Utilities: $536,000
Transit Utilities: $525,000
Public Welfare: $395,000
Public Welfare: $385,000
Sewerage: $295,000
Air Transportation: $259,000
Sewerage: $122,000
- General - Interest on Debt: $4,293,000
Interest on Debt: $3,750,000
- Intergovernmental to State - Health - Other: $1,800,000
Health - Other: $1,800,000
- Local Intergovernmental - Other: $2,775,000
Other: $839,000
Public Welfare: $12,000
Public Welfare: $10,000
- Long Term Debt - Outstanding Unspecified Public Purpose: $116,036,000
Beginning Outstanding - Unspecified Public Purpose: $115,107,000
Beginning Outstanding - Unspecified Public Purpose: $107,435,000
Outstanding Unspecified Public Purpose: $96,569,000
Retired Unspecified Public Purpose: $11,071,000
Retired Unspecified Public Purpose: $10,474,000
Issue, Unspecified Public Purpose: $2,200,000
Issue, Unspecified Public Purpose: $1,581,000
- Miscellaneous - Interest Earnings: $2,111,000
Special Assessments: $1,741,000
Donations From Private Sources: $1,093,000
General Revenue - Other: $1,003,000
Fines and Forfeits: $1,002,000
Special Assessments: $993,000
Fines and Forfeits: $861,000
General Revenue - Other: $766,000
Interest Earnings: $489,000
Rents: $189,000
Rents: $153,000
Donations From Private Sources: $126,000
Sale of Property: $100,000
Sale of Property: $48,000
- Other Capital Outlay - Natural Resources - Other: $2,206,000
General - Other: $1,980,000
Parks and Recreation: $1,978,000
Police Protection: $1,697,000
Local Fire Protection: $1,427,000
Local Fire Protection: $1,092,000
Parks and Recreation: $482,000
Police Protection: $477,000
Financial Administration: $351,000
Transit Utilities: $334,000
Transit Utilities: $328,000
Protective Inspection and Regulation - Other: $321,000
Natural Resources - Other: $212,000
Correctional Institutions: $155,000
Judicial and Legal Services: $152,000
Financial Administration: $100,000
Correctional Institutions: $47,000
Protective Inspection and Regulation - Other: $45,000
Central Staff Services: $21,000
Judicial and Legal Services: $13,000
Libraries: $9,000
Health - Other: $7,000
Libraries: $6,000
Health - Other: $3,000
Central Staff Services: $2,000
General Public Building: $2,000
- Other Funds - Cash and Securities: $73,810,000
Cash and Securities: $52,748,000
- Revenue - Water Utilities: $1,608,000
Water Utilities: $1,430,000
Transit Utilities: $177,000
Transit Utilities: $155,000
- Sinking Funds - Cash and Securities: $4,950,000
Cash and Securities: $3,949,000
- State Intergovernmental - Highways: $9,910,000
Highways: $9,230,000
Other: $6,496,000
General Local Government Support: $4,477,000
Other: $4,167,000
General Local Government Support: $4,046,000
Health and Hospitals: $357,000
Health and Hospitals: $350,000
Public Welfare: $207,000
Public Welfare: $167,000
- Tax - Property: $71,491,000
Property: $61,692,000
General Sales and Gross Receipts: $2,892,000
Other Selective Sales: $2,745,000
General Sales and Gross Receipts: $2,588,000
Other Selective Sales: $2,214,000
Other License: $1,090,000
Motor Fuels Sales: $1,027,000
Motor Fuels Sales: $984,000
Documentary and Stock Transfer: $968,000
Documentary and Stock Transfer: $916,000
Other License: $900,000
Public Utilities Sales: $190,000
Public Utilities Sales: $185,000
Occupation and Business License - Other: $164,000
Occupation and Business License - Other: $140,000
Supplemental Security Income (SSI) in 2006:
- Total number of recipients: 1,152
- Number of aged recipients: 177
- Number of blind and disabled recipients: 975
- Number of recipients under 18: 252
- Number of recipients between 18 and 64: 622
- Number of recipients older than 64: 278
- Number of recipients also receiving OASDI: 339
- Amount of payments (thousands of dollars): 529
| Home Mortgage Disclosure Act Aggregated Statistics For Year 2009 (Based on 6 full tracts) | ||||||||||||
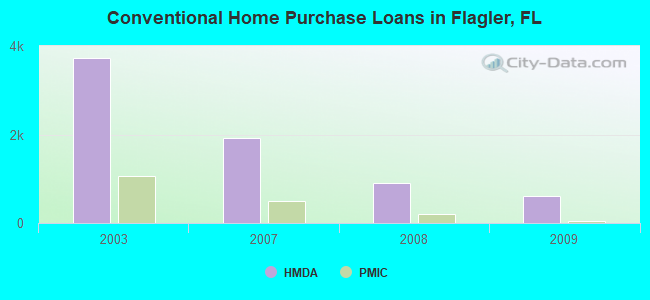
| A) FHA, FSA/RHS & VA Home Purchase Loans | B) Conventional Home Purchase Loans | C) Refinancings | D) Home Improvement Loans | F) Non-occupant Loans on < 5 Family Dwellings (A B C & D) | G) Loans On Manufactured Home Dwelling (A B C & D) | |||||||
|---|---|---|---|---|---|---|---|---|---|---|---|---|
| Number | Average Value | Number | Average Value | Number | Average Value | Number | Average Value | Number | Average Value | Number | Average Value | |
| LOANS ORIGINATED | 336 | $138,202 | 619 | $175,128 | 1,250 | $175,896 | 38 | $95,211 | 496 | $190,385 | 23 | $72,565 |
| APPLICATIONS APPROVED, NOT ACCEPTED | 32 | $139,281 | 65 | $162,662 | 167 | $159,952 | 8 | $21,250 | 54 | $151,296 | 13 | $54,615 |
| APPLICATIONS DENIED | 109 | $134,202 | 156 | $201,949 | 834 | $213,731 | 67 | $47,552 | 215 | $224,353 | 31 | $63,290 |
| APPLICATIONS WITHDRAWN | 40 | $132,575 | 106 | $207,642 | 427 | $188,328 | 8 | $127,250 | 103 | $197,592 | 6 | $119,167 |
| FILES CLOSED FOR INCOMPLETENESS | 22 | $153,682 | 37 | $210,865 | 135 | $181,615 | 9 | $119,444 | 49 | $160,347 | 3 | $78,667 |
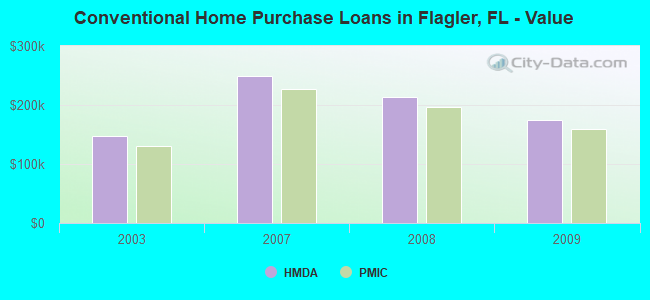
| Private Mortgage Insurance Companies Aggregated Statistics For Year 2009 (Based on 6 full tracts) | ||||||
| A) Conventional Home Purchase Loans | B) Refinancings | C) Non-occupant Loans on < 5 Family Dwellings (A & B) | ||||
|---|---|---|---|---|---|---|
| Number | Average Value | Number | Average Value | Number | Average Value | |
| LOANS ORIGINATED | 42 | $159,238 | 9 | $194,333 | 6 | $222,000 |
| APPLICATIONS APPROVED, NOT ACCEPTED | 29 | $231,103 | 9 | $215,222 | 10 | $204,200 |
| APPLICATIONS DENIED | 9 | $292,667 | 3 | $181,667 | 3 | $524,667 |
| APPLICATIONS WITHDRAWN | 0 | $0 | 0 | $0 | 0 | $0 |
| FILES CLOSED FOR INCOMPLETENESS | 2 | $223,000 | 1 | $196,000 | 0 | $0 |
| Most common first names in Flagler County, FL among deceased individuals | ||
| Name | Count | Lived (average) |
|---|---|---|
| John | 354 | 76.3 years |
| Robert | 257 | 74.2 years |
| William | 235 | 75.9 years |
| Mary | 218 | 82.1 years |
| James | 209 | 73.7 years |
| Joseph | 180 | 76.4 years |
| Charles | 135 | 77.2 years |
| George | 120 | 76.9 years |
| Margaret | 120 | 82.8 years |
| Dorothy | 113 | 81.7 years |
| Most common last names in Flagler County, FL among deceased individuals | ||
| Last name | Count | Lived (average) |
|---|---|---|
| Smith | 88 | 74.1 years |
| Brown | 53 | 73.7 years |
| Johnson | 51 | 78.2 years |
| Williams | 38 | 78.4 years |
| Davis | 35 | 75.0 years |
| Jones | 35 | 76.9 years |
| Wilson | 34 | 79.6 years |
| Miller | 33 | 77.0 years |
| Martin | 31 | 78.3 years |
| Hall | 26 | 76.4 years |
| Businesses in Flagler County, FL | ||||
| Name | Count | Name | Count | |
|---|---|---|---|---|
| 7-Eleven | 4 | KFC | 1 | |
| AT&T | 3 | La-Z-Boy | 1 | |
| Ace Hardware | 3 | Lane Furniture | 2 | |
| Advance Auto Parts | 2 | Lowe's | 2 | |
| Ann Taylor | 1 | MasterBrand Cabinets | 16 | |
| Applebee's | 1 | McDonald's | 5 | |
| Arby's | 2 | Nike | 4 | |
| AutoZone | 1 | Office Depot | 1 | |
| Baskin-Robbins | 1 | Olive Garden | 1 | |
| Blockbuster | 1 | Panda Express | 1 | |
| Burger King | 3 | Panera Bread | 1 | |
| CVS | 2 | Papa John's Pizza | 1 | |
| Chevrolet | 1 | Payless | 1 | |
| Chick-Fil-A | 1 | PetSmart | 1 | |
| Chico's | 1 | Pizza Hut | 2 | |
| Coldwater Creek | 1 | Publix Super Markets | 5 | |
| Comfort Suites | 1 | Quiznos | 2 | |
| Cracker Barrel | 1 | RadioShack | 1 | |
| Curves | 3 | Red Lobster | 1 | |
| DHL | 3 | Sleep Inn | 1 | |
| Dairy Queen | 2 | Sprint Nextel | 1 | |
| Days Inn | 1 | Starbucks | 2 | |
| Decora Cabinetry | 4 | Steak 'n Shake | 2 | |
| Dennys | 1 | Subway | 1 | |
| Discount Tire | 1 | Super 8 | 1 | |
| Domino's Pizza | 1 | T-Mobile | 3 | |
| Dunkin Donuts | 2 | T.J.Maxx | 1 | |
| Ethan Allen | 1 | Taco Bell | 2 | |
| Famous Footwear | 1 | Talbots | 1 | |
| FedEx | 13 | Target | 1 | |
| GNC | 1 | Tire Kingdom | 1 | |
| GameStop | 2 | U-Haul | 9 | |
| Goodwill | 2 | UPS | 15 | |
| H&R Block | 3 | Waffle House | 1 | |
| Hilton | 2 | Walgreens | 3 | |
| Jimmy John's | 3 | Walmart | 2 | |
| JoS. A. Bank | 1 | YMCA | 2 | |
| Jones New York | 2 | |||