Hampton County, South Carolina (SC)
County owner-occupied free and clear houses and condos in 2010: 2,994
County owner-occupied houses and condos in 2000: 5,817
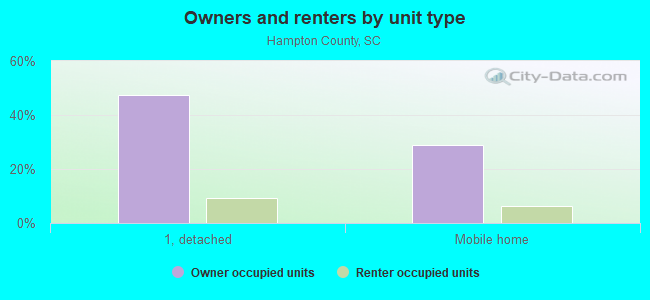
Renter-occupied apartments: 1,998 (it was 1,627 in 2000)
| % of renters here: | 22% |
| State: | 31% |
Land area: 560 sq. mi.
Water area: 2.8 sq. mi.
Population density: 35 people per square mile (low).
Industries providing employment: Educational, health and social services (19.7%), Retail trade (13.0%), Professional, scientific, management, administrative, and waste management services (12.4%), Manufacturing (12.2%).
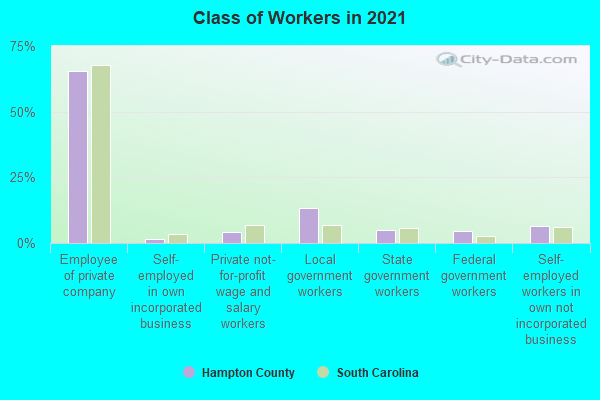
Type of workers:
- Private wage or salary: 70%
- Government: 22%
- Self-employed, not incorporated: 7%
- Unpaid family work: 1%
- OSM Map
- General Map
- Google Map
- MSN Map

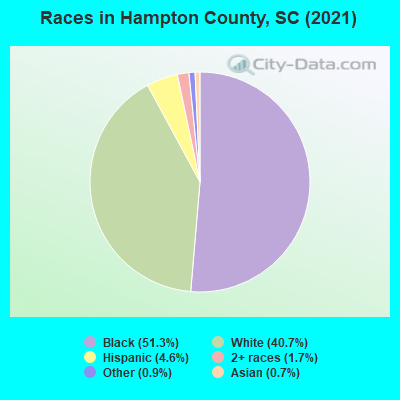
- 9,92751.7%Black Non-Hispanic Alone
- 7,66439.9%White Non-Hispanic Alone
- 1,0015.2%Hispanic or Latino
- 3261.7%Two or more races
- 1540.8%Asian alone
- 1240.6%Some other race alone
- 40.02%American Indian and Alaska Native alone
| Median resident age: | 40.7 years |
| South Carolina median age: | 40.5 years |
| Males: 10,422 | |
| Females: 8,981 |

 | 2020 SC Census Number (360 replies) |
| Columbiana Mall Shooting (43 replies) |
| Hampton County Schools (3 replies) |
| Tornado in Western SC (2 replies) |
| Cookout in Five Points??? (32 replies) |
| Teacher Looking to Move down to SC (40 replies) |
| Hampton County: | 2.0 people |
| South Carolina: | 2 people |
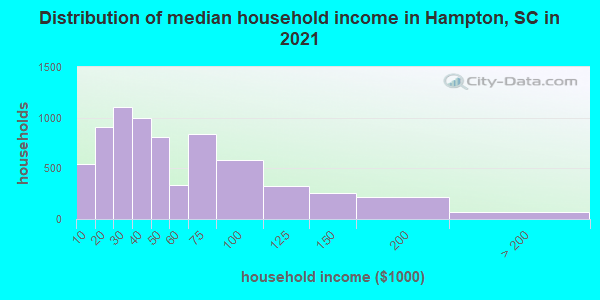
Estimated median household income in 2022: $40,467 ($28,771 in 1999)
| This county: | $40,467 |
| South Carolina: | $64,115 |
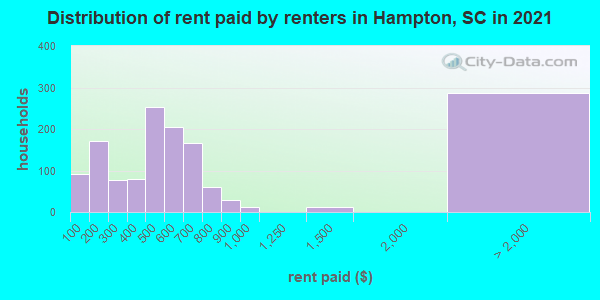
Median contract rent in 2022 for apartments: $548 (lower quartile is $371, upper quartile is $689)
| This county: | $548 |
| State: | $893 |
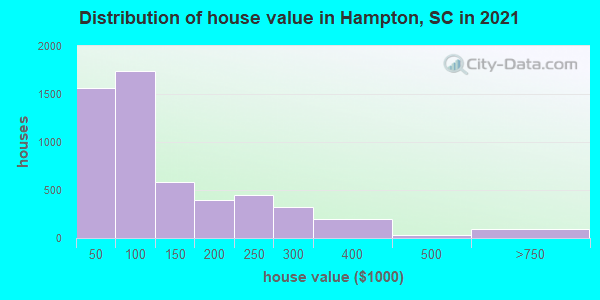
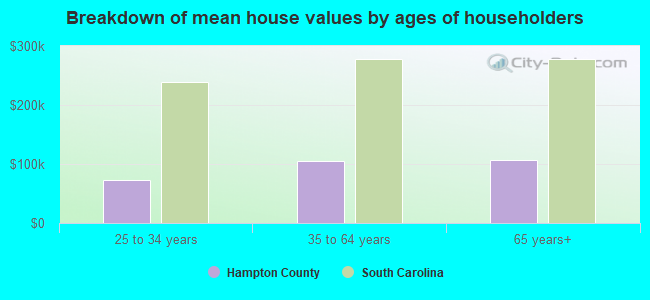
Estimated median house or condo value in 2022: $110,578 (it was $51,400 in 2000)
| Hampton: | $110,578 |
| South Carolina: | $254,600 |
Median monthly housing costs for homes and condos with a mortgage: $1,092
Median monthly housing costs for units without a mortgage: $359
Institutionalized population: 1,488
Crime in 2021 (reported by the sheriff's office or county police, not the county total):
- Murders: 0
- Rapes: 6
- Robberies: 2
- Assaults: 29
- Burglaries: 43
- Thefts: 73
- Auto thefts: 26
Crime in 2020 (reported by the sheriff's office or county police, not the county total):
- Murders: 0
- Rapes: 7
- Robberies: 1
- Assaults: 49
- Burglaries: 36
- Thefts: 79
- Auto thefts: 11
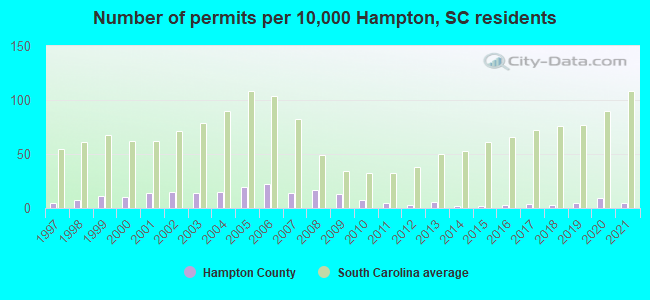
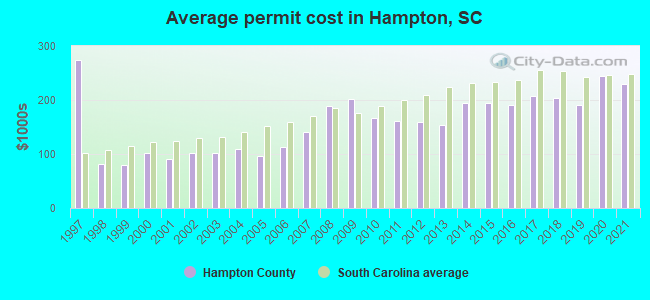
Single-family new house construction building permits:
- 2022: 8 buildings, average cost: $218,900
- 2021: 11 buildings, average cost: $229,600
- 2020: 20 buildings, average cost: $245,400
- 2019: 10 buildings, average cost: $191,000
- 2018: 6 buildings, average cost: $203,500
- 2017: 9 buildings, average cost: $207,500
- 2016: 6 buildings, average cost: $191,000
- 2015: 5 buildings, average cost: $194,500
- 2014: 5 buildings, average cost: $193,500
- 2013: 12 buildings, average cost: $153,600
- 2012: 7 buildings, average cost: $158,900
- 2011: 10 buildings, average cost: $161,700
- 2010: 14 buildings, average cost: $167,200
- 2009: 28 buildings, average cost: $201,300
- 2008: 37 buildings, average cost: $189,200
- 2007: 30 buildings, average cost: $140,700
- 2006: 48 buildings, average cost: $112,900
- 2005: 40 buildings, average cost: $97,300
- 2004: 32 buildings, average cost: $108,800
- 2003: 31 buildings, average cost: $100,600
- 2002: 33 buildings, average cost: $102,300
- 2001: 29 buildings, average cost: $90,300
- 2000: 22 buildings, average cost: $101,000
- 1999: 23 buildings, average cost: $79,400
- 1998: 14 buildings, average cost: $81,700
- 1997: 11 buildings, average cost: $273,500
Median real estate property taxes paid for housing units with mortgages in 2022: $1,197 (0.8%)
Median real estate property taxes paid for housing units with no mortgage in 2022: $606 (0.6%)
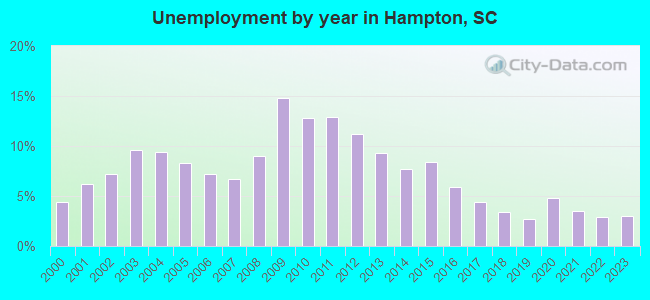
| Hampton County: | 19.4% |
| South Carolina: | 14.0% |
Median age of residents in 2022: 40.7 years old
(Males: 38.9 years old, Females: 44.3 years old)
(Median age for: White residents: 47.0 years old, Black residents: 39.6 years old, Asian residents: 20.6 years old, Hispanic or Latino residents: 30.8 years old, Other race residents: 30.1 years old)
Fair market rent in 2006 for a 1-bedroom apartment in Hampton County is $407 a month.
Fair market rent for a 2-bedroom apartment is $481 a month.
Fair market rent for a 3-bedroom apartment is $593 a month.
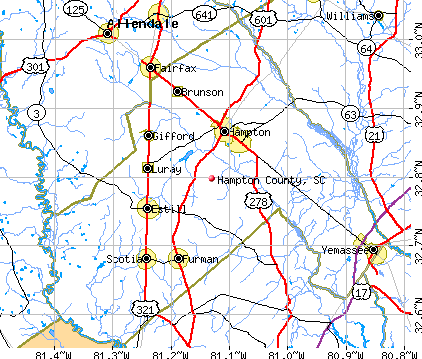
Cities in this county include: Hampton, Estill, Varnville, Yemassee, Brunson, Gifford, Furman, Scotia, Luray.
Neighboring counties: Dorchester County  , Coosa County, Alabama
  , Newton County, Mississippi , Scott County, Mississippi , Winston County, Mississippi , Hopkins County, Texas , Twiggs County, Georgia , Wood County, Texas .
| Here: | 2.9% |
| South Carolina: | 3.1% |
Current college students: 633
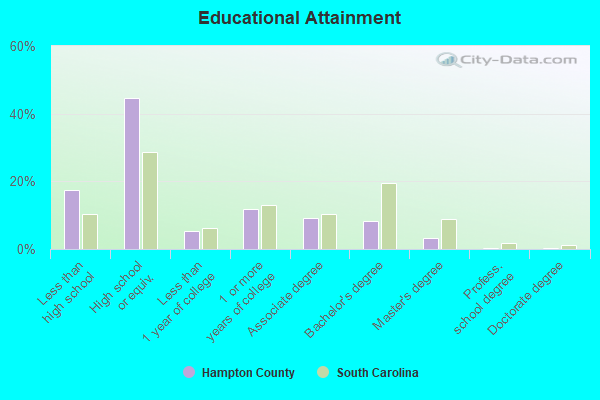
People 25 years of age or older with a high school degree or higher: 80.9%
People 25 years of age or older with a bachelor's degree or higher: 11.6%
Number of foreign born residents: 699 (17.1% naturalized citizens)
| Hampton County: | 3.6% |
| Whole state: | 5.2% |
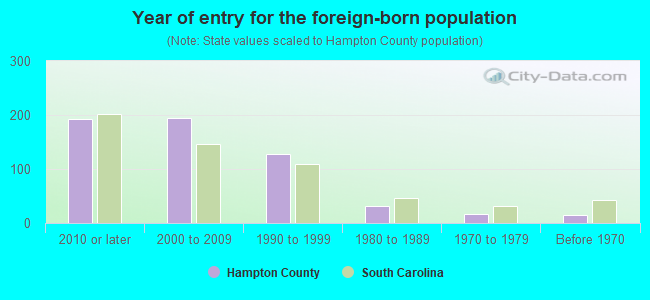
- Year of entry for the foreign-born population
- 2492010 or later
- 2592000 to 2009
- 961990 to 1999
- 311980 to 1989
- 161970 to 1979
- 15Before 1970
Mean travel time to work (commute): # minutes
Percentage of county residents living and working in this county: 97.0%
Housing units in structures:
- One, detached: 4,948
- One, attached: 134
- Two: 68
- 3 or 4: 358
- 5 to 9: 187
- 20 or more: 11
- Mobile homes: 3,084
- Boats, RVs, vans, etc.: 45
Housing units in Hampton County with a mortgage: 1,804 (62 second mortgage, 0 home equity loan, 18 both second mortgage and home equity loan)
Houses without a mortgage: 41
| Here: | 2.4% with mortgage |
| State: | 97.3% with mortgage |
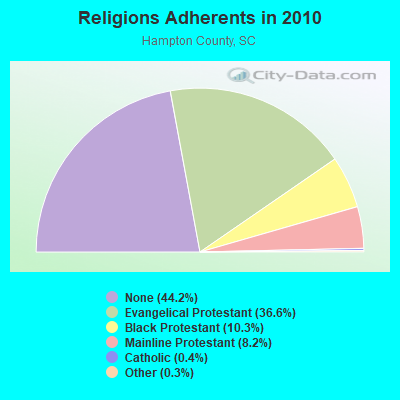
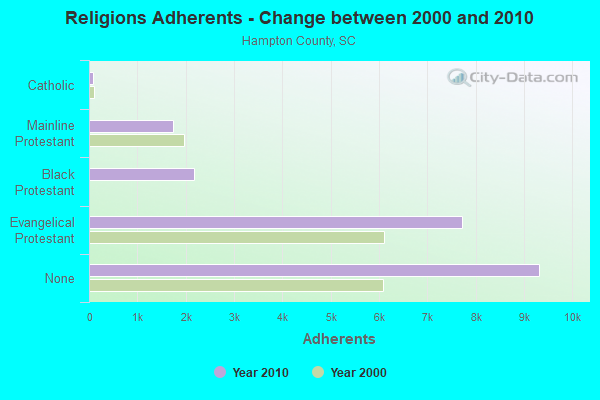
Religion statistics for Hampton County
| Religion | Adherents | Congregations |
|---|---|---|
| Evangelical Protestant | 7,716 | 42 |
| Black Protestant | 2,172 | 17 |
| Mainline Protestant | 1,737 | 18 |
| Catholic | 84 | 1 |
| Other | 58 | 1 |
| None | 9,323 | - |
Source: Clifford Grammich, Kirk Hadaway, Richard Houseal, Dale E.Jones, Alexei Krindatch, Richie Stanley and Richard H.Taylor. 2012. 2010 U.S.Religion Census: Religious Congregations & Membership Study. Association of Statisticians of American Religious Bodies. Jones, Dale E., et al. 2002. Congregations and Membership in the United States 2000. Nashville, TN: Glenmary Research Center.
Food Environment Statistics:
| Hampton County: | 3.31 / 10,000 pop. |
| State: | 1.99 / 10,000 pop. |
| This county: | 0.94 / 10,000 pop. |
| South Carolina: | 0.85 / 10,000 pop. |
| Hampton County: | 10.39 / 10,000 pop. |
| South Carolina: | 5.38 / 10,000 pop. |
| This county: | 6.61 / 10,000 pop. |
| State: | 7.75 / 10,000 pop. |
| Hampton County: | 13.7% |
| South Carolina: | 10.6% |
| Hampton County: | 35.9% |
| State: | 29.4% |
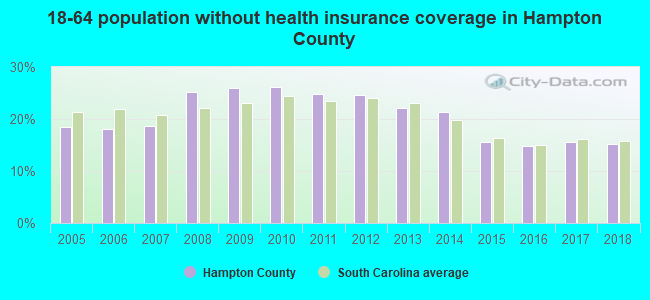
| Here: | 20.3% |
| State: | 13.4% |
Agriculture in Hampton County:
Average size of farms: 516 acresAverage value of agricultural products sold per farm: $24,906
Average value of crops sold per acre for harvested cropland: $207.74
The value of nursery, greenhouse, floriculture, and sod as a percentage of the total market value of agricultural products sold: 13.50%
The value of livestock, poultry, and their products as a percentage of the total market value of agricultural products sold: 10.71%
Average total farm production expenses per farm: $43,212
Harvested cropland as a percentage of land in farms: 20.76%
Average market value of all machinery and equipment per farm: $73,127
The percentage of farms operated by a family or individual: 90.32%
Average age of principal farm operators: 59 years
Average number of cattle and calves per 100 acres of all land in farms: 1.62
Corn for grain: 8466 harvested acres
All wheat for grain: 1662 harvested acres
Upland cotton: 7436 harvested acres
Soybeans for beans: 6023 harvested acres
Vegetables: 421 harvested acres
Land in orchards: 58 acres
Earthquake activity:
Hampton County-area historical earthquake activity is significantly above South Carolina state average. It is 39% smaller than the overall U.S. average.On 11/22/1974 at 05:25:55, a magnitude 4.7 (4.7 MB, Class: Light, Intensity: IV - V) earthquake occurred 57.8 miles away from Hampton County center
On 8/2/1974 at 08:52:09, a magnitude 4.9 (4.3 MB, 4.9 LG) earthquake occurred 108.1 miles away from the county center
On 8/21/1992 at 16:31:55, a magnitude 4.4 (4.1 MB, 4.1 LG, 4.4 LG, Depth: 6.2 mi) earthquake occurred 61.5 miles away from the county center
On 8/9/2020 at 12:07:37, a magnitude 5.1 (5.1 MW, Depth: 4.7 mi, Class: Moderate, Intensity: VI - VII) earthquake occurred 254.5 miles away from the county center
On 8/23/2011 at 17:51:04, a magnitude 5.8 (5.8 MW, Depth: 3.7 mi) earthquake occurred 396.9 miles away from Hampton County center
On 2/15/2014 at 03:23:38, a magnitude 4.1 (4.1 MW, Depth: 3.2 mi) earthquake occurred 89.8 miles away from the county center
Magnitude types: regional Lg-wave magnitude (LG), body-wave magnitude (MB), moment magnitude (MW)
Most recent natural disasters:
- South Carolina Severe Storms, Tornadoes, And Straight-line Winds, Incident Period: April 12, 2020 - April 13, 2020, FEMA Id: 4542, Natural disaster type: Storm, Tornado, Wind
- South Carolina Covid-19 Pandemic, Incident Period: January 20, 2020, FEMA Id: 4492, Natural disaster type: Other
- South Carolina Hurricane Irma, Incident Period: September 6, 2017 - September 13, 2017, FEMA Id: 4346, Natural disaster type: Hurricane
- South Carolina Hurricane Matthew, Incident Period: October 04, 2016 to October 30, 2016, Emergency Declared EM-3378: October 06, 2016, FEMA Id: 3378, Natural disaster type: Hurricane
- South Carolina Hurricane Matthew, Incident Period: October 04, 2016 to October 30, 2016, Major Disaster (Presidential) Declared DR-4286: October 11, 2016, FEMA Id: 4286, Natural disaster type: Hurricane
- South Carolina Severe Storms and Flooding, Incident Period: October 01, 2015 to October 23, 2015, Emergency Declared EM-3373: October 03, 2015, FEMA Id: 3373, Natural disaster type: Storm, Flood
- South Carolina Severe Winter Storm, Incident Period: February 10, 2014 to February 19, 2014, Emergency Declared EM-3369: February 12, 2014, FEMA Id: 3369, Natural disaster type: Winter Storm
- South Carolina Severe Winter Storm, Incident Period: February 10, 2014 to February 15, 2014, Major Disaster (Presidential) Declared DR-4166: March 12, 2014, FEMA Id: 4166, Natural disaster type: Winter Storm
- South Carolina Hurricane Katrina Evacuation, Incident Period: August 29, 2005 to October 01, 2005, Emergency Declared EM-3233: September 10, 2005, FEMA Id: 3233, Natural disaster type: Hurricane
- South Carolina Hurricane Floyd, Incident Period: September 14, 1999 to September 30, 1999, Major Disaster (Presidential) Declared DR-1299: September 21, 1999, FEMA Id: 1299, Natural disaster type: Hurricane
- 2 other natural disasters have been reported since 1953.
The number of natural disasters in Hampton County (12) is smaller than the US average (15).
Major Disasters (Presidential) Declared: 3
Emergencies Declared: 6
Causes of natural disasters: Hurricanes: 6, Storms: 2, Winter Storms: 2, Drought: 1, Flood: 1, Tornado: 1, Wind: 1, Other: 1 (Note: some incidents may be assigned to more than one category).
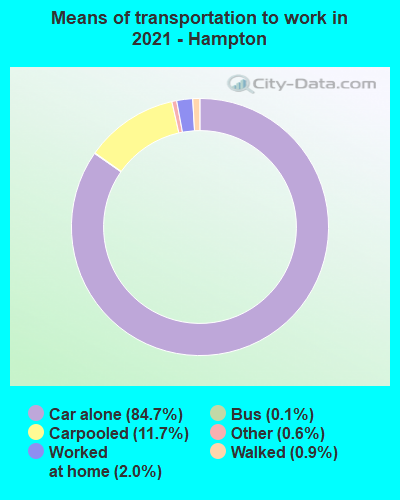
Means of transportation to work:
- Drove a car alone: 4,793 (81.2%)
- Carpooled: 720 (12.2%)
- Taxicab, motorcycle, or other means: 29 (0.5%)
- Walked: 27 (0.5%)
- Worked at home: 204 (3.5%)
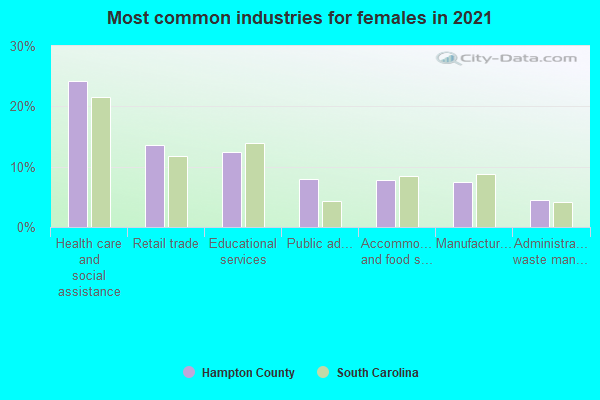
- Health care and social assistance (18%)
- Retail trade (13%)
- Educational services (13%)
- Accommodation and food services (7%)
- Public administration (7%)
- Manufacturing (5%)
- Finance and insurance (4%)
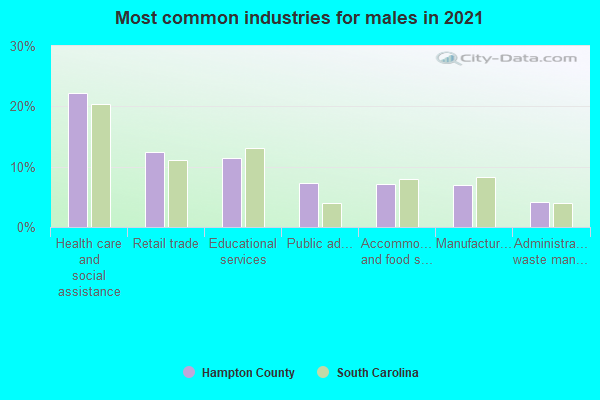
- Health care and social assistance (21%)
- Retail trade (16%)
- Educational services (15%)
- Accommodation and food services (8%)
- Public administration (8%)
- Manufacturing (6%)
- Finance and insurance (5%)
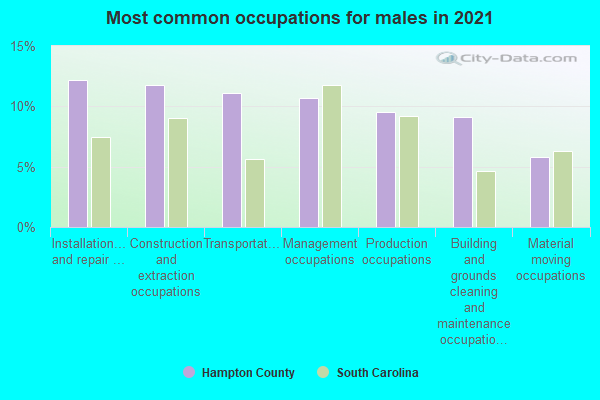
- Building and grounds cleaning and maintenance occupations (12%)
- Production occupations (11%)
- Construction and extraction occupations (11%)
- Transportation occupations (10%)
- Management occupations (10%)
- Installation, maintenance, and repair occupations (8%)
- Material moving occupations (6%)
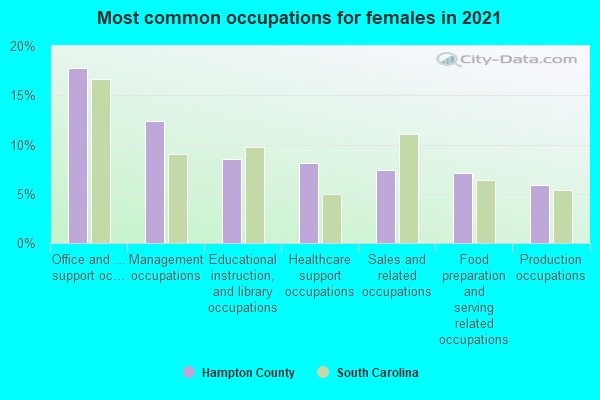
- Office and administrative support occupations (17%)
- Educational instruction, and library occupations (10%)
- Management occupations (10%)
- Healthcare support occupations (9%)
- Sales and related occupations (8%)
- Food preparation and serving related occupations (6%)
- Health technologists and technicians (6%)
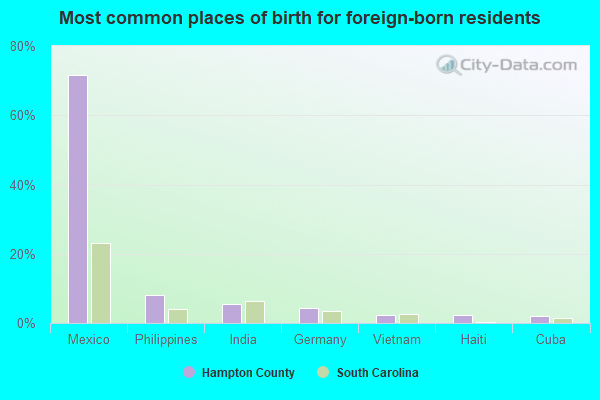
- Mexico (68%)
- Philippines (10%)
- India (5%)
- Germany (4%)
- Africa, n.e.c. (3%)
- Other Northern Africa (2%)
- Belgium (2%)
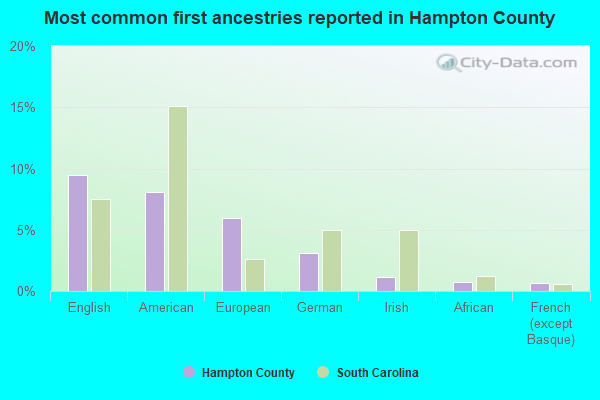
- American (8%)
- English (8%)
- European (4%)
- German (4%)
- African (1%)
- Irish (1%)
- Scottish (1%)
People in group quarters in Hampton County, South Carolina in 2010:
- 1,340 people in federal prisons
- 92 people in nursing facilities/skilled-nursing facilities
- 56 people in local jails and other municipal confinement facilities
- 43 people in group homes intended for adults
People in group quarters in Hampton County, South Carolina in 2000:
- 1,549 people in federal prisons and detention centers
- 103 people in nursing homes
- 36 people in local jails and other confinement facilities (including police lockups)
- 23 people in other group homes
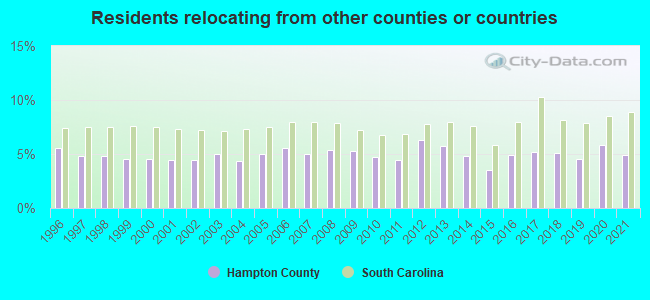
4.90% of this county's 2021 resident taxpayers lived in other counties in 2020 ($39,463 average adjusted gross income)
| Here: | 4.90% |
| South Carolina average: | 8.89% |
10 or fewer of this county's residents moved from foreign countries.
3.54% relocated from other counties in South Carolina ($29,858 average AGI)
1.36% relocated from other states ($9,608 average AGI)
Hampton County: 1.36% South Carolina average: 4.96%
Top counties from which taxpayers relocated into this county between 2020 and 2021:
| from Beaufort County, SC | |
| from Jasper County, SC | |
| from Allendale County, SC | |
| from Colleton County, SC |
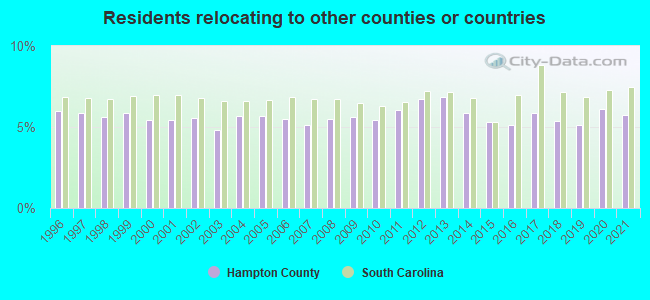
5.72% of this county's 2020 resident taxpayers moved to other counties in 2021 ($38,310 average adjusted gross income)
| Here: | 5.72% |
| South Carolina average: | 7.46% |
10 or fewer of this county's residents moved to foreign countries.
4.29% relocated to other counties in South Carolina ($29,945 average AGI)
1.43% relocated to other states ($8,365 average AGI)
Hampton County: 1.43% South Carolina average: 3.47%
Top counties to which taxpayers relocated from this county between 2020 and 2021:
| to Beaufort County, SC | |
| to Jasper County, SC | |
| to Allendale County, SC | |
| to Colleton County, SC | |
| to Richland County, SC |
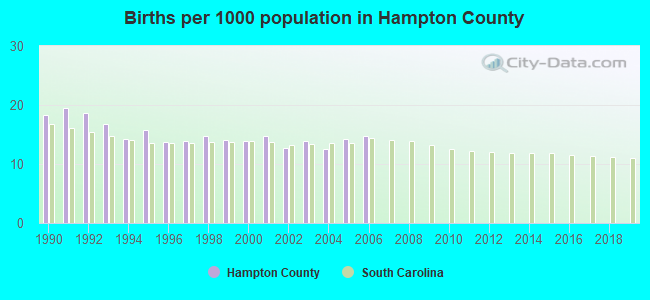
Births per 1000 population from 1990 to 1999: 16.0
Births per 1000 population from 2000 to 2006: 13.8
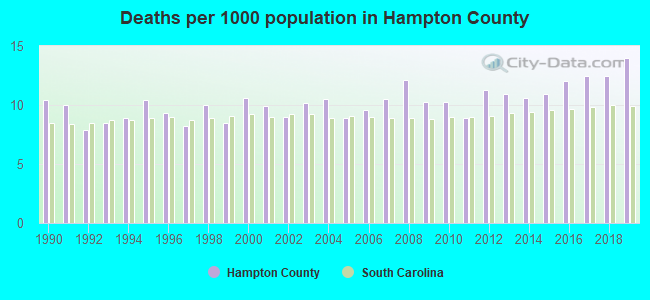
Deaths per 1000 population from 1990 to 1999: 9.2
Deaths per 1000 population from 2000 to 2009: 10.2
Deaths per 1000 population from 2010 to 2020: 11.8
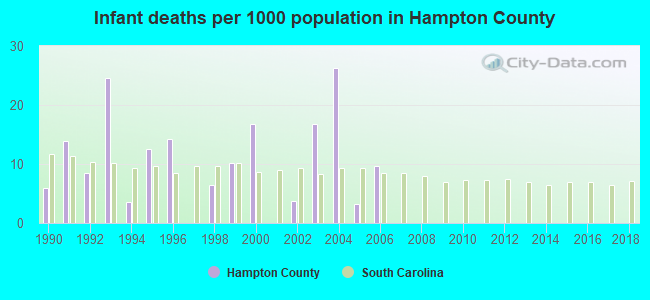
Infant deaths per 1000 live births from 1990 to 1999: 10.0
Infant deaths per 1000 live births from 2000 to 2006: 10.9
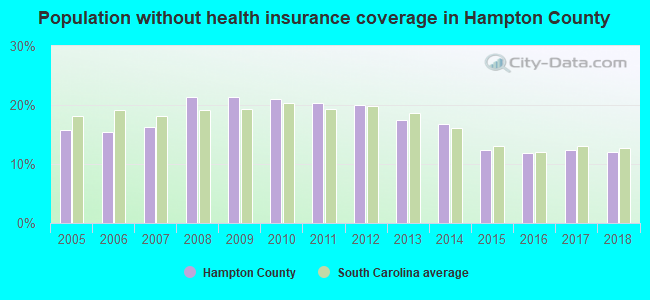
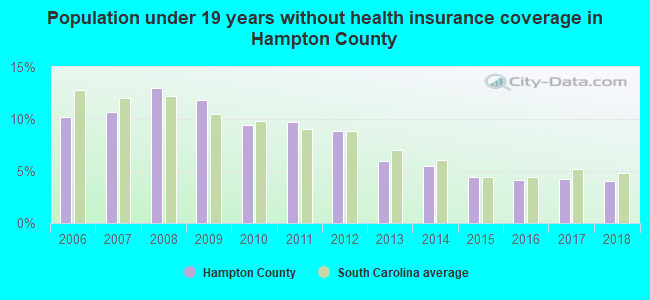
Persons under 19 years old without health insurance coverage in 2018: 4.0%
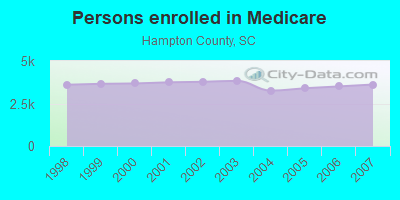
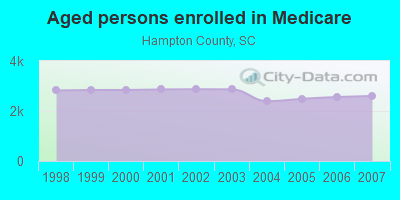
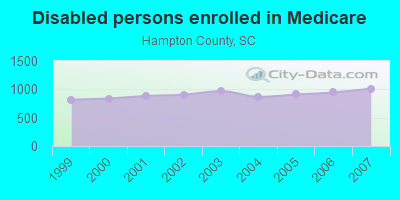
Persons enrolled in hospital insurance and/or supplemental medical insurance (Medicare) in July 1, 2007: 3,616 (2,602 aged, 1,014 disabled)
Children under 18 without health insurance coverage in 2007: 535 (10%)
Most common underlying causes of death in Hampton County, South Carolina in 1999 - 2019:
- Bronchus or lung, unspecified - Malignant neoplasms (271)
- Acute myocardial infarction, unspecified (201)
- Atherosclerotic heart disease (201)
- Stroke, not specified as haemorrhage or infarction (88)
- Alzheimer disease, unspecified (55)
- Chronic obstructive pulmonary disease, unspecified (32)
- Cardiac arrest, unspecified (19)
- Unspecified dementia (14)
- Atherosclerotic cardiovascular disease, so described (11)
- Congestive heart failure (11)
Population without health insurance coverage in 2000: 20%
Children under 18 without health insurance coverage in 2000: 17%
Short term general hospital admissions per 100,000 population in 2004: 4,746
Short term general hospital beds per 100,000 population in 2004: 117
Emergency room visits per 100,000 population in 2004: 42,543
General practice office based MDs per 100,000 population in 2005: 1,242
Medical specialist MDs per 100,000 population in 2005: 1,153
Dentists per 100,000 population in 1998: 19
Total births per 100,000 population, July 2005 - July 2006 : 26
Total deaths per 100,000 population, July 2005 - July 2006: 66
Limited-service eating places per 100,000 population in 2005 : 5
Crimes per 100,000 population in 1996: 1
Household type by relationship:
Households: 19,403- Male householders: 3,693 (1,390 living alone), Female householders: 3,782 (1,087 living alone)
3,125 spouses (3,122 opposite-sex spouses), 383 unmarried partners, (383 opposite-sex unmarried partners), 5,757 children (5,312 natural, 240 adopted, 204 stepchildren), 911 grandchildren, 140 brothers or sisters, 222 parents, 0 foster children, 120 other relatives, 344 non-relatives
- In group quarters: 839
Size of family households: 2,420 2-persons, 932 3-persons, 531 4-persons, 592 5-persons, 138 6-persons, 80 7-or-more-persons.
Size of nonfamily households: 2,474 1-person, 299 2-persons, 15 5-persons.
1,873 married couples with children.
1,304 single-parent households (178 men, 1,126 women).
94.2% of residents of Hampton speak English at home.
4.3% of residents speak Spanish at home (39% speak English very well, 24% speak English well, 28% speak English not well, 9% don't speak English at all).
0.3% of residents speak other Indo-European language at home (73% speak English very well, 19% speak English well, 8% speak English not well).
0.6% of residents speak Asian or Pacific Island language at home (65% speak English very well, 14% speak English well, 21% speak English not well).
0.2% of residents speak other language at home (100% speak English very well).
In fiscal year 2004:
Federal Government expenditure: $173,392,000 ($8,140 per capita)
Department of Defense expenditure: $9,933,000
Federal direct payments to individuals for retirement and disability: $58,460,000
Federal other direct payments to individuals: $28,242,000
Federal direct payments not to individuals: $3,536,000
Federal grants: $49,895,000
Federal procurement contracts: $7,003,000 ($224,000 Department of Defense)
Federal salaries and wages: $26,255,000 ($7,268,000 Department of Defense)
Federal Government direct loans: $278,000
Federal guaranteed/insured loans: $1,195,000
Federal Government insurance: $10,058,000
Population change from April 1, 2000 to July 1, 2005:
Births: 1,608| Here: | 75 per 1000 residents |
| State: | 69 per 1000 residents |
Deaths: 1,095
| Here: | 51 per 1000 residents |
| State: | 46 per 1000 residents |
Net international migration: +37
| Here: | +2 per 1000 residents |
| State: | +9 per 1000 residents |
Net internal migration: -576
| Here: | |
| State: |
Total withdrawal of fresh water for public supply: 11.57 millions of gallons per day (16% from ground, 84% from surface)
| Here: | 6.2 |
| State: | 6.4 |
| Here: | 4.7 |
| State: | 4.5 |
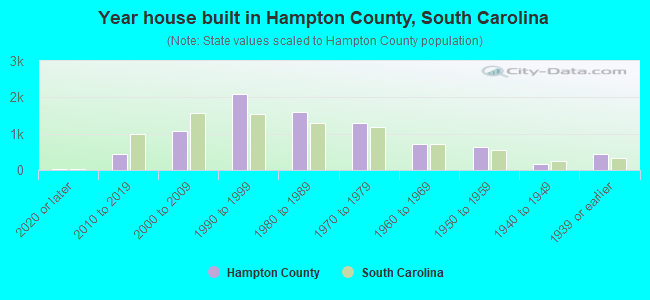
- Year house built in Hampton County, South Carolina
- 372020 or later
- 4232010 to 2019
- 1,0752000 to 2009
- 2,1951990 to 1999
- 1,5371980 to 1989
- 1,2701970 to 1979
- 6511960 to 1969
- 6501950 to 1959
- 2631940 to 1949
- 3471939 or earlier
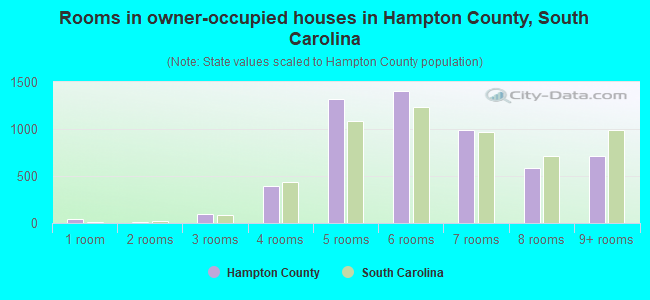
- Rooms in owner-occupied houses in Hampton County, South Carolina
- 461 room
- 32 rooms
- 1353 rooms
- 4434 rooms
- 1,3905 rooms
- 1,1806 rooms
- 1,0607 rooms
- 6708 rooms
- 7489+ rooms
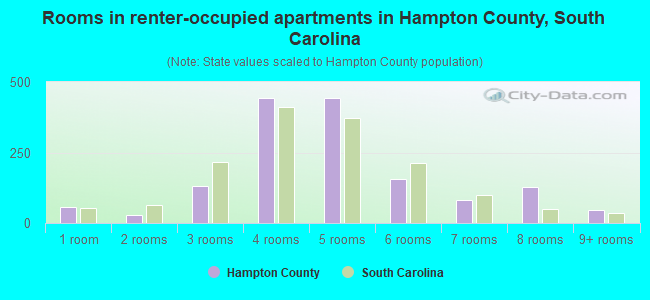
- Rooms in renter-occupied apartments in Hampton County, South Carolina
- 751 room
- 182 rooms
- 2223 rooms
- 4964 rooms
- 5145 rooms
- 2006 rooms
- 597 rooms
- 1558 rooms
- 579+ rooms
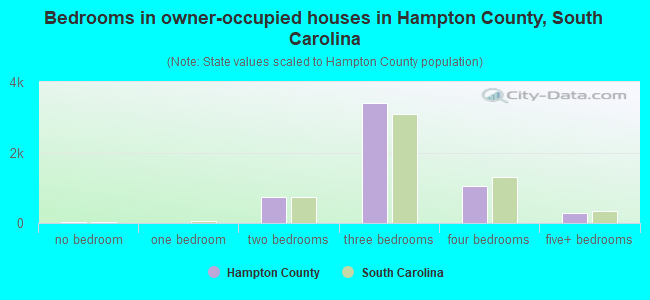
- Bedrooms in owner-occupied houses in Hampton County, South Carolina
- 44no bedroom
- 71 bedroom
- 7612 bedrooms
- 3,5253 bedrooms
- 1,1134 bedrooms
- 2225+ bedrooms
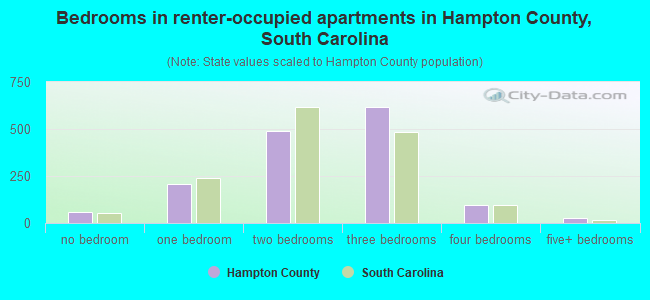
- Bedrooms in renter-occupied apartments in Hampton County, South Carolina
- 80no bedroom
- 2001 bedroom
- 5672 bedrooms
- 7853 bedrooms
- 1144 bedrooms
- 475+ bedrooms
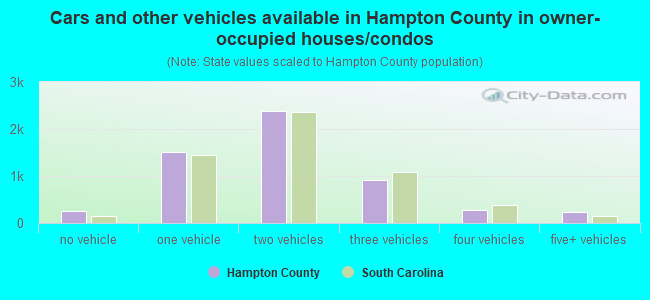
- Cars and other vehicles available in Hampton County in owner-occupied houses/condos
- 338no vehicle
- 1,6421 vehicle
- 2,3652 vehicles
- 8683 vehicles
- 2634 vehicles
- 2115+ vehicles
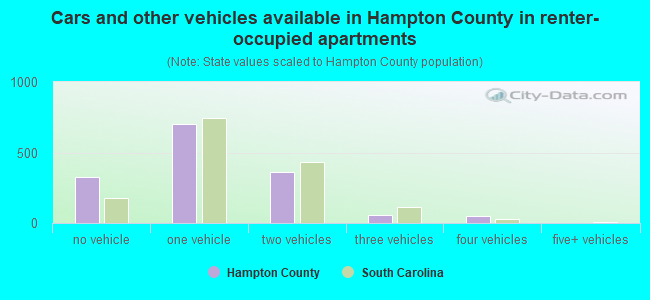
- Cars and other vehicles available in Hampton County in renter-occupied apartments
- 395no vehicle
- 8181 vehicle
- 4642 vehicles
- 753 vehicles
- 444 vehicles
- 05+ vehicles
92.4% of Hampton County residents lived in the same house 1 years ago.
Out of people who lived in different houses, 25% lived in this county.
Out of people who lived in different counties, 86% lived in South Carolina.
| Hampton County: | 92.4% |
| State average: | 86.5% |
Place of birth for U.S.-born residents:
- This state: 15,079
- Other state: 3,215
- Northeast: 991
- Midwest: 421
- South: 1,657
- West: 131
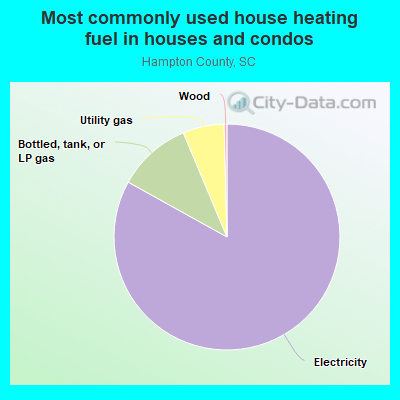
- 83.1%Electricity
- 9.9%Bottled, tank, or LP gas
- 6.1%Utility gas
- 0.8%Wood
- 0.1%Fuel oil, kerosene, etc.
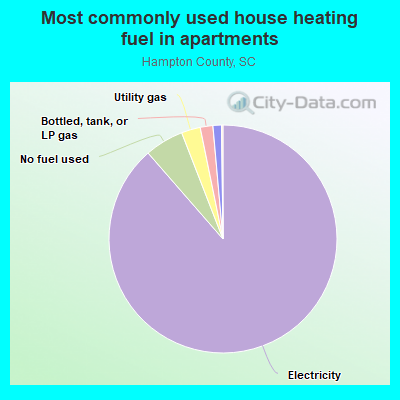
- 88.9%Electricity
- 4.2%No fuel used
- 4.0%Utility gas
- 2.0%Bottled, tank, or LP gas
- 1.0%Fuel oil, kerosene, etc.
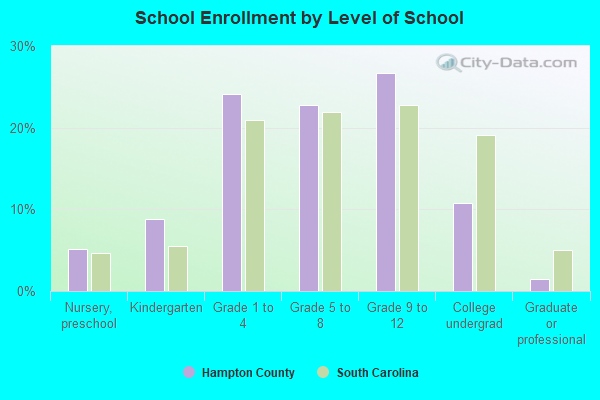
Private vs. public school enrollment:
| Here: | 17.8% |
| South Carolina: | 14.4% |
| Here: | 19.8% |
| South Carolina: | 11.1% |
| Here: | 10.3% |
| South Carolina: | 21.9% |

Hampton County government finances - Expenditure in 2020:
- Charges - Other: $1,498,000
Other: $1,049,000
Regular Highways: $414,000
Regular Highways: $397,000
Solid Waste Management: $154,000
Solid Waste Management: $148,000
Air Transportation: $119,000
Parks and Recreation: $72,000
Air Transportation: $51,000
Parks and Recreation: $45,000
Miscellaneous Commercial Activities: $3,000
Miscellaneous Commercial Activities: $3,000
- Construction - Toll Highways: $538,000
Regular Highways: $408,000
- Current Operations - Central Staff Services: $5,446,000
Police Protection: $3,523,000
Health - Other: $2,986,000
Police Protection: $2,809,000
Health - Other: $2,632,000
Correctional Institutions: $1,702,000
Correctional Institutions: $1,677,000
Solid Waste Management: $1,310,000
Financial Administration: $1,266,000
Central Staff Services: $1,225,000
Financial Administration: $1,056,000
Toll Highways: $1,051,000
Judicial and Legal Services: $979,000
Solid Waste Management: $961,000
Judicial and Legal Services: $948,000
General Public Buildings: $890,000
Public Welfare - Other: $829,000
Local Fire Protection: $778,000
General - Other: $742,000
Regular Highways: $741,000
General - Other: $624,000
Public Welfare - Other: $549,000
Libraries: $541,000
Local Fire Protection: $514,000
Housing and Community Development: $342,000
Air Transportation: $275,000
Housing and Community Development: $261,000
Air Transportation: $183,000
Libraries: $170,000
Parks and Recreation: $157,000
Protective Inspection and Regulation - Other: $130,000
Protective Inspection and Regulation - Other: $113,000
Parks and Recreation: $107,000
Natural Resources - Other: $44,000
Natural Resources - Other: $41,000
- General - Interest on Debt: $359,000
Interest on Debt: $264,000
- Long Term Debt - Beginning Outstanding - Unspecified Public Purpose: $8,970,000
Outstanding Unspecified Public Purpose: $7,501,000
Beginning Outstanding - Unspecified Public Purpose: $6,599,000
Outstanding Unspecified Public Purpose: $4,640,000
Retired Unspecified Public Purpose: $1,959,000
Retired Unspecified Public Purpose: $1,469,000
- Miscellaneous - General Revenue - Other: $2,719,000
Fines and Forfeits: $299,000
Fines and Forfeits: $269,000
Rents: $44,000
Rents: $21,000
Donations From Private Sources: $16,000
Donations From Private Sources: $13,000
Interest Earnings: $10,000
General Revenue - Other: $6,000
Interest Earnings: $1,000
- Other Capital Outlay - Regular Highways: $148,000
Solid Waste Management: $30,000
Air Transportation: $19,000
- Other Funds - Cash and Securities: $5,392,000
Cash and Securities: $3,117,000
- State Intergovernmental - General Local Government Support: $1,234,000
General Local Government Support: $1,034,000
Water Utilities: $907,000
Highways: $606,000
Housing and Community Development: $380,000
Highways: $363,000
Housing and Community Development: $342,000
Health and Hospitals: $39,000
- Tax - Property: $11,335,000
Property: $10,500,000
Documentary and Stock Transfer: $33,000
Documentary and Stock Transfer: $22,000
Motor Vehicle License: $12,000
Motor Vehicle License: $12,000
- Total Salaries and Wages: $11,438,000
: $6,950,000
Hampton County government finances - Revenue in 2020:
- Charges - Other: $1,498,000
Other: $1,049,000
Regular Highways: $414,000
Regular Highways: $397,000
Solid Waste Management: $154,000
Solid Waste Management: $148,000
Air Transportation: $119,000
Parks and Recreation: $72,000
Air Transportation: $51,000
Parks and Recreation: $45,000
Miscellaneous Commercial Activities: $3,000
Miscellaneous Commercial Activities: $3,000
- Construction - Toll Highways: $538,000
Regular Highways: $408,000
- Current Operations - Central Staff Services: $5,446,000
Police Protection: $3,523,000
Health - Other: $2,986,000
Police Protection: $2,809,000
Health - Other: $2,632,000
Correctional Institutions: $1,702,000
Correctional Institutions: $1,677,000
Solid Waste Management: $1,310,000
Financial Administration: $1,266,000
Central Staff Services: $1,225,000
Financial Administration: $1,056,000
Toll Highways: $1,051,000
Judicial and Legal Services: $979,000
Solid Waste Management: $961,000
Judicial and Legal Services: $948,000
General Public Buildings: $890,000
Public Welfare - Other: $829,000
Local Fire Protection: $778,000
General - Other: $742,000
Regular Highways: $741,000
General - Other: $624,000
Public Welfare - Other: $549,000
Libraries: $541,000
Local Fire Protection: $514,000
Housing and Community Development: $342,000
Air Transportation: $275,000
Housing and Community Development: $261,000
Air Transportation: $183,000
Libraries: $170,000
Parks and Recreation: $157,000
Protective Inspection and Regulation - Other: $130,000
Protective Inspection and Regulation - Other: $113,000
Parks and Recreation: $107,000
Natural Resources - Other: $44,000
Natural Resources - Other: $41,000
- General - Interest on Debt: $359,000
Interest on Debt: $264,000
- Long Term Debt - Beginning Outstanding - Unspecified Public Purpose: $8,970,000
Outstanding Unspecified Public Purpose: $7,501,000
Beginning Outstanding - Unspecified Public Purpose: $6,599,000
Outstanding Unspecified Public Purpose: $4,640,000
Retired Unspecified Public Purpose: $1,959,000
Retired Unspecified Public Purpose: $1,469,000
- Miscellaneous - General Revenue - Other: $2,719,000
Fines and Forfeits: $299,000
Fines and Forfeits: $269,000
Rents: $44,000
Rents: $21,000
Donations From Private Sources: $16,000
Donations From Private Sources: $13,000
Interest Earnings: $10,000
General Revenue - Other: $6,000
Interest Earnings: $1,000
- Other Capital Outlay - Regular Highways: $148,000
Solid Waste Management: $30,000
Air Transportation: $19,000
- Other Funds - Cash and Securities: $5,392,000
Cash and Securities: $3,117,000
- State Intergovernmental - General Local Government Support: $1,234,000
General Local Government Support: $1,034,000
Water Utilities: $907,000
Highways: $606,000
Housing and Community Development: $380,000
Highways: $363,000
Housing and Community Development: $342,000
Health and Hospitals: $39,000
- Tax - Property: $11,335,000
Property: $10,500,000
Documentary and Stock Transfer: $33,000
Documentary and Stock Transfer: $22,000
Motor Vehicle License: $12,000
Motor Vehicle License: $12,000
- Total Salaries and Wages: $11,438,000
: $6,950,000
Hampton County government finances - Debt in 2020:
- Charges - Other: $1,498,000
Other: $1,049,000
Regular Highways: $414,000
Regular Highways: $397,000
Solid Waste Management: $154,000
Solid Waste Management: $148,000
Air Transportation: $119,000
Parks and Recreation: $72,000
Air Transportation: $51,000
Parks and Recreation: $45,000
Miscellaneous Commercial Activities: $3,000
Miscellaneous Commercial Activities: $3,000
- Construction - Toll Highways: $538,000
Regular Highways: $408,000
- Current Operations - Central Staff Services: $5,446,000
Police Protection: $3,523,000
Health - Other: $2,986,000
Police Protection: $2,809,000
Health - Other: $2,632,000
Correctional Institutions: $1,702,000
Correctional Institutions: $1,677,000
Solid Waste Management: $1,310,000
Financial Administration: $1,266,000
Central Staff Services: $1,225,000
Financial Administration: $1,056,000
Toll Highways: $1,051,000
Judicial and Legal Services: $979,000
Solid Waste Management: $961,000
Judicial and Legal Services: $948,000
General Public Buildings: $890,000
Public Welfare - Other: $829,000
Local Fire Protection: $778,000
General - Other: $742,000
Regular Highways: $741,000
General - Other: $624,000
Public Welfare - Other: $549,000
Libraries: $541,000
Local Fire Protection: $514,000
Housing and Community Development: $342,000
Air Transportation: $275,000
Housing and Community Development: $261,000
Air Transportation: $183,000
Libraries: $170,000
Parks and Recreation: $157,000
Protective Inspection and Regulation - Other: $130,000
Protective Inspection and Regulation - Other: $113,000
Parks and Recreation: $107,000
Natural Resources - Other: $44,000
Natural Resources - Other: $41,000
- General - Interest on Debt: $359,000
Interest on Debt: $264,000
- Long Term Debt - Beginning Outstanding - Unspecified Public Purpose: $8,970,000
Outstanding Unspecified Public Purpose: $7,501,000
Beginning Outstanding - Unspecified Public Purpose: $6,599,000
Outstanding Unspecified Public Purpose: $4,640,000
Retired Unspecified Public Purpose: $1,959,000
Retired Unspecified Public Purpose: $1,469,000
- Miscellaneous - General Revenue - Other: $2,719,000
Fines and Forfeits: $299,000
Fines and Forfeits: $269,000
Rents: $44,000
Rents: $21,000
Donations From Private Sources: $16,000
Donations From Private Sources: $13,000
Interest Earnings: $10,000
General Revenue - Other: $6,000
Interest Earnings: $1,000
- Other Capital Outlay - Regular Highways: $148,000
Solid Waste Management: $30,000
Air Transportation: $19,000
- Other Funds - Cash and Securities: $5,392,000
Cash and Securities: $3,117,000
- State Intergovernmental - General Local Government Support: $1,234,000
General Local Government Support: $1,034,000
Water Utilities: $907,000
Highways: $606,000
Housing and Community Development: $380,000
Highways: $363,000
Housing and Community Development: $342,000
Health and Hospitals: $39,000
- Tax - Property: $11,335,000
Property: $10,500,000
Documentary and Stock Transfer: $33,000
Documentary and Stock Transfer: $22,000
Motor Vehicle License: $12,000
Motor Vehicle License: $12,000
- Total Salaries and Wages: $11,438,000
: $6,950,000
Hampton County government finances - Cash and Securities in 2020:
- Charges - Other: $1,498,000
Other: $1,049,000
Regular Highways: $414,000
Regular Highways: $397,000
Solid Waste Management: $154,000
Solid Waste Management: $148,000
Air Transportation: $119,000
Parks and Recreation: $72,000
Air Transportation: $51,000
Parks and Recreation: $45,000
Miscellaneous Commercial Activities: $3,000
Miscellaneous Commercial Activities: $3,000
- Construction - Toll Highways: $538,000
Regular Highways: $408,000
- Current Operations - Central Staff Services: $5,446,000
Police Protection: $3,523,000
Health - Other: $2,986,000
Police Protection: $2,809,000
Health - Other: $2,632,000
Correctional Institutions: $1,702,000
Correctional Institutions: $1,677,000
Solid Waste Management: $1,310,000
Financial Administration: $1,266,000
Central Staff Services: $1,225,000
Financial Administration: $1,056,000
Toll Highways: $1,051,000
Judicial and Legal Services: $979,000
Solid Waste Management: $961,000
Judicial and Legal Services: $948,000
General Public Buildings: $890,000
Public Welfare - Other: $829,000
Local Fire Protection: $778,000
General - Other: $742,000
Regular Highways: $741,000
General - Other: $624,000
Public Welfare - Other: $549,000
Libraries: $541,000
Local Fire Protection: $514,000
Housing and Community Development: $342,000
Air Transportation: $275,000
Housing and Community Development: $261,000
Air Transportation: $183,000
Libraries: $170,000
Parks and Recreation: $157,000
Protective Inspection and Regulation - Other: $130,000
Protective Inspection and Regulation - Other: $113,000
Parks and Recreation: $107,000
Natural Resources - Other: $44,000
Natural Resources - Other: $41,000
- General - Interest on Debt: $359,000
Interest on Debt: $264,000
- Long Term Debt - Beginning Outstanding - Unspecified Public Purpose: $8,970,000
Outstanding Unspecified Public Purpose: $7,501,000
Beginning Outstanding - Unspecified Public Purpose: $6,599,000
Outstanding Unspecified Public Purpose: $4,640,000
Retired Unspecified Public Purpose: $1,959,000
Retired Unspecified Public Purpose: $1,469,000
- Miscellaneous - General Revenue - Other: $2,719,000
Fines and Forfeits: $299,000
Fines and Forfeits: $269,000
Rents: $44,000
Rents: $21,000
Donations From Private Sources: $16,000
Donations From Private Sources: $13,000
Interest Earnings: $10,000
General Revenue - Other: $6,000
Interest Earnings: $1,000
- Other Capital Outlay - Regular Highways: $148,000
Solid Waste Management: $30,000
Air Transportation: $19,000
- Other Funds - Cash and Securities: $5,392,000
Cash and Securities: $3,117,000
- State Intergovernmental - General Local Government Support: $1,234,000
General Local Government Support: $1,034,000
Water Utilities: $907,000
Highways: $606,000
Housing and Community Development: $380,000
Highways: $363,000
Housing and Community Development: $342,000
Health and Hospitals: $39,000
- Tax - Property: $11,335,000
Property: $10,500,000
Documentary and Stock Transfer: $33,000
Documentary and Stock Transfer: $22,000
Motor Vehicle License: $12,000
Motor Vehicle License: $12,000
- Total Salaries and Wages: $11,438,000
: $6,950,000
Supplemental Security Income (SSI) in 2006:
- Total number of recipients: 983
- Number of aged recipients: 111
- Number of blind and disabled recipients: 872
- Number of recipients under 18: 144
- Number of recipients between 18 and 64: 586
- Number of recipients older than 64: 253
- Number of recipients also receiving OASDI: 400
- Amount of payments (thousands of dollars): 405
| Most common first names in Hampton County, SC among deceased individuals | ||
| Name | Count | Lived (average) |
|---|---|---|
| James | 174 | 69.8 years |
| Mary | 137 | 74.2 years |
| William | 137 | 70.6 years |
| John | 134 | 71.8 years |
| Willie | 120 | 68.2 years |
| Robert | 77 | 69.8 years |
| George | 73 | 71.8 years |
| Annie | 66 | 78.3 years |
| Henry | 57 | 71.7 years |
| Elizabeth | 52 | 76.9 years |
| Most common last names in Hampton County, SC among deceased individuals | ||
| Last name | Count | Lived (average) |
|---|---|---|
| Williams | 194 | 71.7 years |
| Brown | 127 | 70.7 years |
| Smith | 116 | 73.2 years |
| Deloach | 95 | 74.6 years |
| Green | 91 | 72.5 years |
| Davis | 76 | 70.9 years |
| Johnson | 65 | 67.4 years |
| Peeples | 62 | 76.5 years |
| Tuten | 61 | 75.1 years |
| Bowers | 58 | 75.8 years |
| Businesses in Hampton County, SC | ||||
| Name | Count | Name | Count | |
|---|---|---|---|---|
| Ace Hardware | 1 | Hardee's | 1 | |
| Advance Auto Parts | 1 | Hilton | 1 | |
| Baymont Inn | 1 | KFC | 1 | |
| Burger King | 1 | McDonald's | 2 | |
| CVS | 1 | Pizza Hut | 1 | |
| Cricket Wireless | 1 | Subway | 3 | |
| Days Inn | 1 | Super 8 | 2 | |
| Dennys | 1 | Taco Bell | 1 | |
| FedEx | 1 | U-Haul | 3 | |
| Ford | 1 | UPS | 2 | |
| H&R Block | 1 | Waffle House | 1 | |