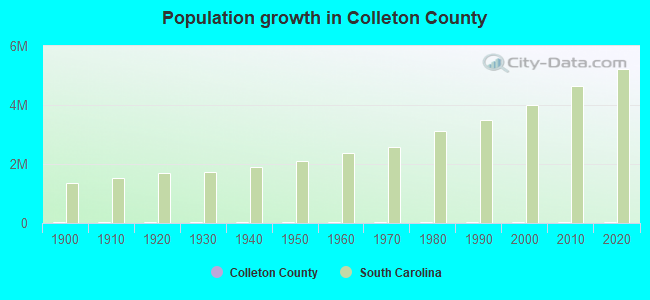
Colleton County, South Carolina (SC)
County owner-occupied free and clear houses and condos in 2010: 5,188
County owner-occupied houses and condos in 2000: 11,612
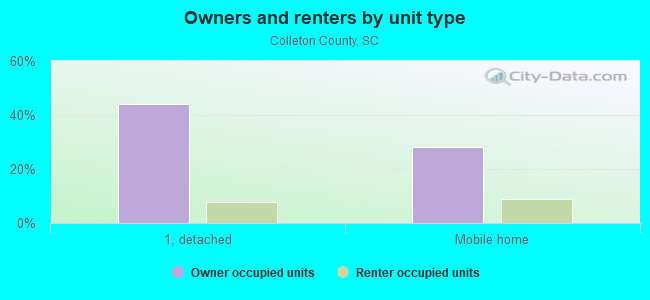
Renter-occupied apartments: 3,782 (it was 2,858 in 2000)
| % of renters here: | 20% |
| State: | 31% |
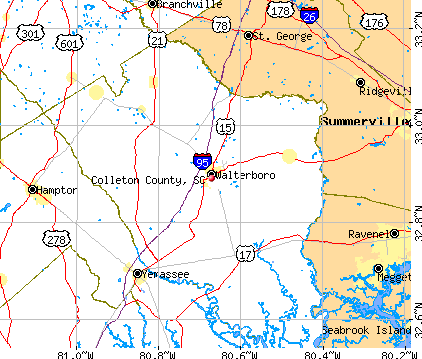
Land area: 1056 sq. mi.
Water area: 76.9 sq. mi.
Population density: 37 people per square mile (low).
Industries providing employment: Educational, health and social services (21.6%), Retail trade (13.8%), Construction (12.1%), Manufacturing (11.6%).
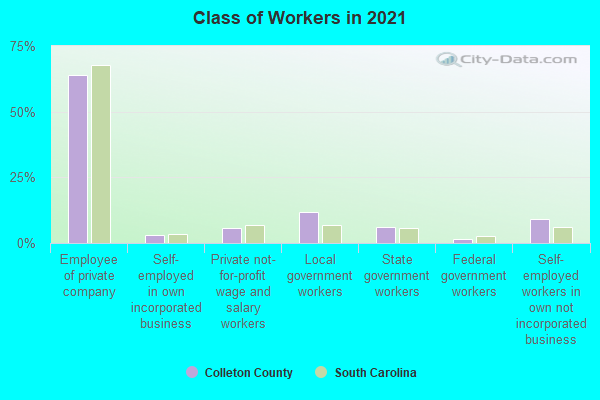
Type of workers:
- Private wage or salary: 75%
- Government: 17%
- Self-employed, not incorporated: 8%
- Unpaid family work: 0%
- OSM Map
- General Map
- Google Map
- MSN Map

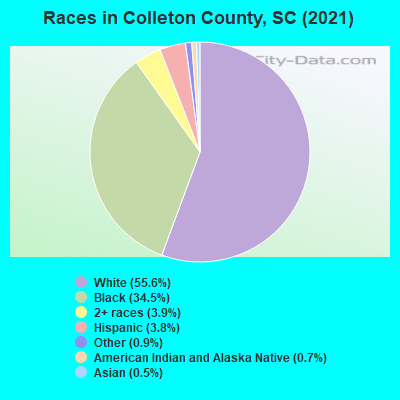
- 22,27156.4%White Non-Hispanic Alone
- 13,40333.9%Black Non-Hispanic Alone
- 1,7074.3%Two or more races
- 1,5914.0%Hispanic or Latino
- 2150.5%Asian alone
- 1900.5%American Indian and Alaska Native alone
- 1240.3%Some other race alone
| Median resident age: | 42.1 years |
| South Carolina median age: | 40.5 years |
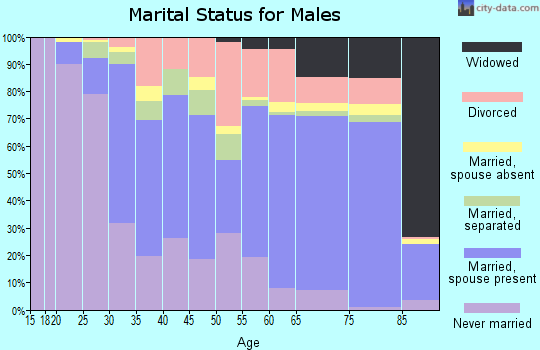
| Males: 19,120 | |
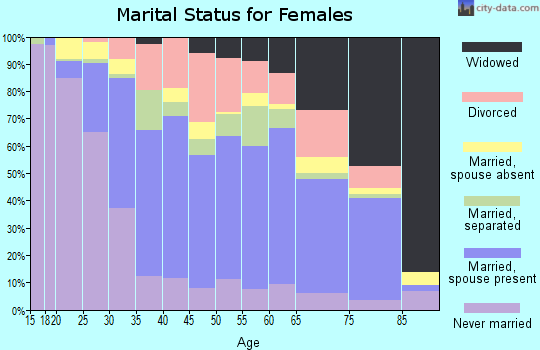
| Females: 20,489 |


| Colleton County: | 2.0 people |
| South Carolina: | 2 people |
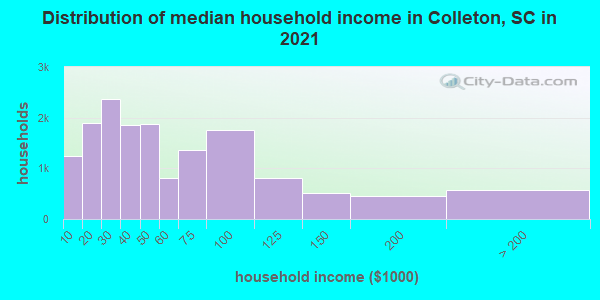
Estimated median household income in 2022: $47,156 ($29,733 in 1999)
| This county: | $47,156 |
| South Carolina: | $64,115 |
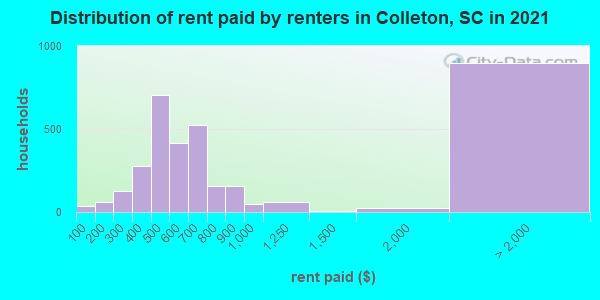
Median contract rent in 2022 for apartments: $638 (lower quartile is $496, upper quartile is $777)
| This county: | $638 |
| State: | $893 |
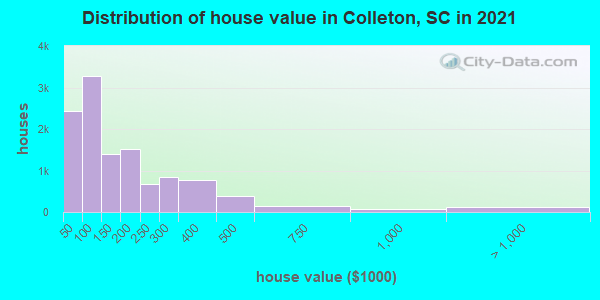
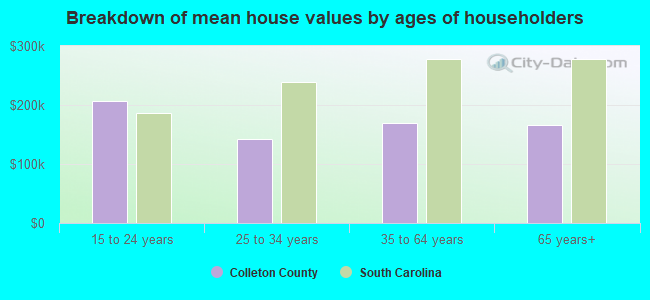
Estimated median house or condo value in 2022: $149,792 (it was $62,200 in 2000)
| Colleton: | $149,792 |
| South Carolina: | $254,600 |
Mean price in 2022:
Median monthly housing costs for homes and condos with a mortgage: $1,193Detached houses: $273,318
Here: $273,318 State: $368,255 Townhouses or other attached units: $335,749
Here: $335,749 State: $292,023 In 2-unit structures: $398,078
Here: $398,078 State: $358,283 In 3-to-4-unit structures: $208,755
Here: $208,755 State: $230,702 In 5-or-more-unit structures: $312,868
Here: $312,868 State: $326,361 Mobile homes: $97,906
Here: $97,906 State: $102,531 Occupied boats, RVs, vans, etc.: $54,193
Here: $54,193 State: $132,484
Median monthly housing costs for units without a mortgage: $398
Institutionalized population: 359
Crime in 2021 (reported by the sheriff's office or county police, not the county total):
- Murders: 10
- Rapes: 9
- Robberies: 11
- Assaults: 164
- Burglaries: 164
- Thefts: 455
- Auto thefts: 100
Crime in 2020 (reported by the sheriff's office or county police, not the county total):
- Murders: 6
- Rapes: 16
- Robberies: 10
- Assaults: 168
- Burglaries: 181
- Thefts: 503
- Auto thefts: 89
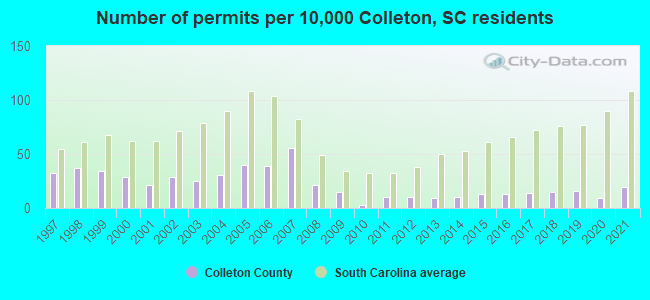
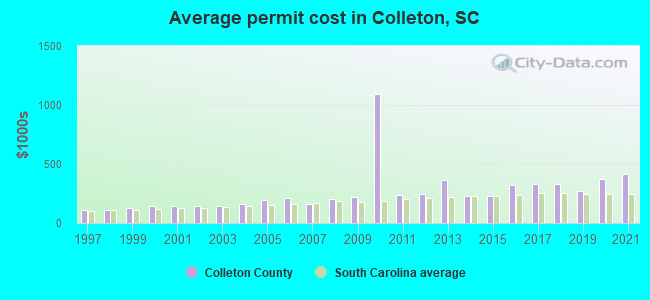
Single-family new house construction building permits:
- 2022: 71 buildings, average cost: $440,900
- 2021: 73 buildings, average cost: $415,800
- 2020: 36 buildings, average cost: $369,000
- 2019: 63 buildings, average cost: $273,200
- 2018: 56 buildings, average cost: $332,800
- 2017: 55 buildings, average cost: $330,100
- 2016: 51 buildings, average cost: $317,500
- 2015: 48 buildings, average cost: $230,200
- 2014: 37 buildings, average cost: $229,900
- 2013: 36 buildings, average cost: $365,500
- 2012: 37 buildings, average cost: $246,300
- 2011: 38 buildings, average cost: $240,400
- 2010: 11 buildings, average cost: $1,090,700
- 2009: 58 buildings, average cost: $218,600
- 2008: 79 buildings, average cost: $203,700
- 2007: 216 buildings, average cost: $160,000
- 2006: 149 buildings, average cost: $216,300
- 2005: 153 buildings, average cost: $196,600
- 2004: 119 buildings, average cost: $162,600
- 2003: 96 buildings, average cost: $142,300
- 2002: 110 buildings, average cost: $141,000
- 2001: 82 buildings, average cost: $140,500
- 2000: 112 buildings, average cost: $145,700
- 1999: 131 buildings, average cost: $126,900
- 1998: 140 buildings, average cost: $111,900
- 1997: 121 buildings, average cost: $109,400
Median real estate property taxes paid for housing units with mortgages in 2022: $1,141 (0.6%)
Median real estate property taxes paid for housing units with no mortgage in 2022: $565 (0.5%)
| Colleton County: | 16.2% |
| South Carolina: | 14.0% |
Median age of residents in 2022: 42.1 years old
(Males: 39.8 years old, Females: 43.6 years old)
(Median age for: White residents: 46.2 years old, Black residents: 40.2 years old, American Indian residents: 29.5 years old, Asian residents: 34.2 years old, Hispanic or Latino residents: 21.2 years old, Other race residents: 18.3 years old)
Fair market rent in 2006 for a 1-bedroom apartment in Colleton County is $389 a month.
Fair market rent for a 2-bedroom apartment is $481 a month.
Fair market rent for a 3-bedroom apartment is $680 a month.
Cities in this county include: Hendersonville, Walterboro, Green Pond, Cottageville, Edisto Beach, Jacksonboro, Smoaks, Williams, Lodge, Islandton.
Notable locations in this county outside city limits:
Notable locations in Colleton County: Cave (A), Erwinton Plantation (B), Stinson Bridge (C), Pointe Salkehatchie Regional Industrial Park (D), Allendale County Golf Club (E), Gill Crossroads (F), Gravel Hill Plantation (G), Grotan Plantation (H), Stillwood Plantation (I), Venison Hunt Club (J), Willingham Plantation (K), Dunbar Store (L), South Carolina Department of Motor Vehicles Fairfax Office (M), Martin Fire Department (N), Allendale Law Enforcement Center (O), Allendale County Sheriff's Office (P), Martin-Millett Community Center (Q). Display/hide their locations on the map
Churches in Colleton County include: Saint James Church (A), Saint Lukes Church (B), Saint Marks Church (C), Second Calvary Church (D), Smyrna Church (E), Springfield Church (F), Sweet Bethel Church (G), Trinity Church (H), Virgin Mary Church (I). Display/hide their locations on the map
Cemeteries: Flowers Cemetery (1), Folger Cemetery (2), Allen Chapel Cemetery (3), New Home Cemetery (4), Furse Cemetery (5), Garvin Cemetery (6), Magdalene Cemetery (7). Display/hide their locations on the map
Lakes, reservoirs, and swamps: Dead River Lake (A), Cator Hall Lake (B), Mount Lake (C), Echee Pond (D), Harters Pond (E), Terry Pond (F), Ferguson Lake (G), Billinger Pond (H). Display/hide their locations on the map
Streams, rivers, and creeks: Fiddle Pond Creek (A), Furse Creek (B), Swift Gut (C), Stony Creek (D), Boggy Gut Branch (E), Pretty Creek (F), Pipe Creek (G), Spring Run (H), Miller Creek (I). Display/hide their locations on the map
Neighboring counties: Dona Ana County, New Mexico  , Butts County, Georgia , Los Angeles County, California , Cass County, Texas , Delta County, Texas , Jones County, Georgia .
| Here: | 3.1% |
| South Carolina: | 3.1% |
Current college students: 1,129
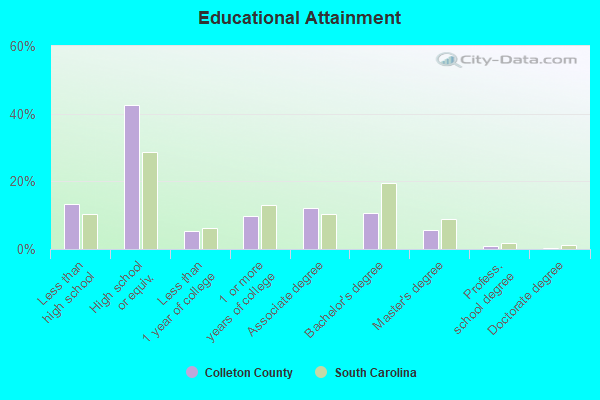
People 25 years of age or older with a high school degree or higher: 86.2%
People 25 years of age or older with a bachelor's degree or higher: 15.7%
Number of foreign born residents: 1,090 (11.0% naturalized citizens)
| Colleton County: | 2.8% |
| Whole state: | 5.2% |
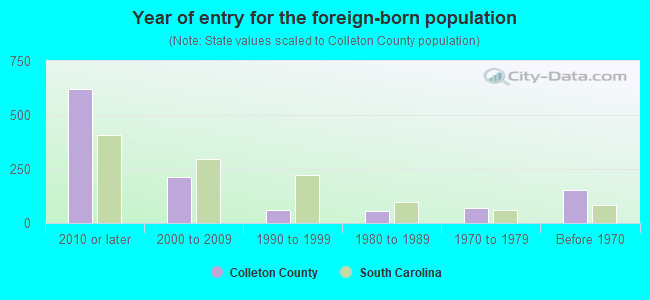
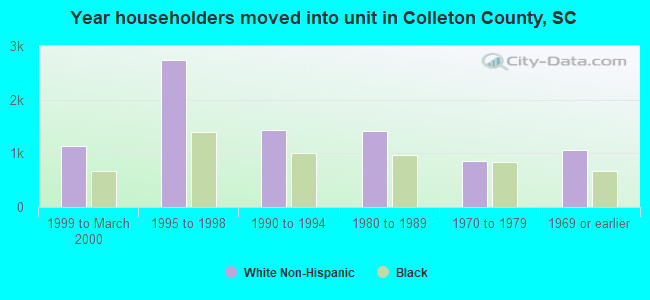
- Year of entry for the foreign-born population
- 6762010 or later
- 2772000 to 2009
- 561990 to 1999
- 541980 to 1989
- 691970 to 1979
- 155Before 1970
Mean travel time to work (commute): ! minutes
Percentage of county residents living and working in this county: 98.4%
Housing units in structures:
- One, detached: 10,528
- One, attached: 241
- Two: 227
- 3 or 4: 508
- 5 to 9: 297
- 10 to 19: 268
- 20 to 49: 75
- 50 or more: 136
- Mobile homes: 7,912
- Boats, RVs, vans, etc.: 82
Housing units in Colleton County with a mortgage: 5,694 (253 second mortgage, 26 home equity loan, 205 both second mortgage and home equity loan)
Houses without a mortgage: 43
| Here: | 10.4% with mortgage |
| State: | 97.3% with mortgage |
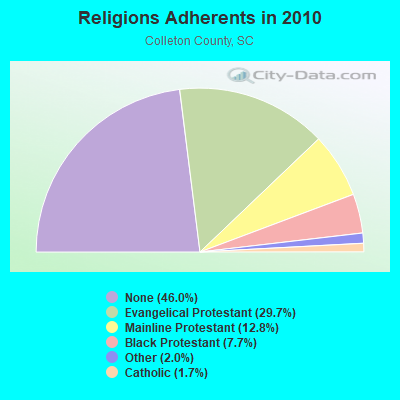
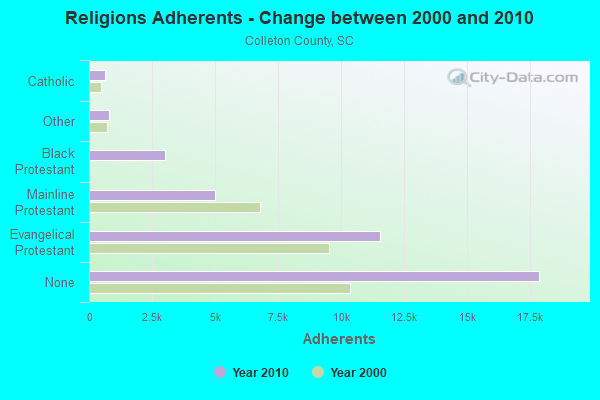
Religion statistics for Colleton County
| Religion | Adherents | Congregations |
|---|---|---|
| Evangelical Protestant | 11,561 | 58 |
| Mainline Protestant | 4,990 | 44 |
| Black Protestant | 3,011 | 25 |
| Other | 787 | 2 |
| Catholic | 650 | 2 |
| None | 17,893 | - |
Source: Clifford Grammich, Kirk Hadaway, Richard Houseal, Dale E.Jones, Alexei Krindatch, Richie Stanley and Richard H.Taylor. 2012. 2010 U.S.Religion Census: Religious Congregations & Membership Study. Association of Statisticians of American Religious Bodies. Jones, Dale E., et al. 2002. Congregations and Membership in the United States 2000. Nashville, TN: Glenmary Research Center.
Food Environment Statistics:
| Colleton County: | 3.08 / 10,000 pop. |
| State: | 1.99 / 10,000 pop. |
| This county: | 0.51 / 10,000 pop. |
| South Carolina: | 0.85 / 10,000 pop. |
| Colleton County: | 10.02 / 10,000 pop. |
| South Carolina: | 5.38 / 10,000 pop. |
| This county: | 6.94 / 10,000 pop. |
| State: | 7.75 / 10,000 pop. |
| Colleton County: | 12.4% |
| South Carolina: | 10.6% |
| Colleton County: | 32.3% |
| State: | 29.4% |
| Here: | 11.4% |
| State: | 13.4% |
Agriculture in Colleton County:
Average size of farms: 278 acresAverage value of agricultural products sold per farm: $26,661
Average value of crops sold per acre for harvested cropland: $660.28
The value of nursery, greenhouse, floriculture, and sod as a percentage of the total market value of agricultural products sold: 12.58%
The value of livestock, poultry, and their products as a percentage of the total market value of agricultural products sold: 21.78%
Average total farm production expenses per farm: $25,155
Harvested cropland as a percentage of land in farms: 11.37%
Irrigated harvested cropland as a percentage of land in farms: 7.32%
Average market value of all machinery and equipment per farm: $43,754
The percentage of farms operated by a family or individual: 93.54%
Average age of principal farm operators: 57 years
Average number of cattle and calves per 100 acres of all land in farms: 4.10
Milk cows as a percentage of all cattle and calves: 0.78%
Corn for grain: 4952 harvested acres
All wheat for grain: 473 harvested acres
Soybeans for beans: 2561 harvested acres
Vegetables: 1,535 harvested acres
Land in orchards: 106 acres
Tornado activity:
Colleton County historical area-adjusted tornado activity is significantly below South Carolina state average. It is 11222988.7 times below overall U.S. average.Tornadoes in this county have caused one fatality and 6 injuries recorded between 1950 and 2004.
On 9/22/2000, a category 2 (max. wind speeds 113-157 mph) tornado killed one person and injured 5 people and caused $290,000 in damages.
Earthquake activity:
Colleton County-area historical earthquake activity is significantly above South Carolina state average. It is 44% smaller than the overall U.S. average.On 11/22/1974 at 05:25:55, a magnitude 4.7 (4.7 MB, Class: Light, Intensity: IV - V) earthquake occurred 30.7 miles away from Colleton County center
On 8/2/1974 at 08:52:09, a magnitude 4.9 (4.3 MB, 4.9 LG) earthquake occurred 125.0 miles away from the county center
On 8/21/1992 at 16:31:55, a magnitude 4.4 (4.1 MB, 4.1 LG, 4.4 LG, Depth: 6.2 mi) earthquake occurred 34.2 miles away from the county center
On 8/9/2020 at 12:07:37, a magnitude 5.1 (5.1 MW, Depth: 4.7 mi, Class: Moderate, Intensity: VI - VII) earthquake occurred 249.2 miles away from the county center
On 8/23/2011 at 17:51:04, a magnitude 5.8 (5.8 MW, Depth: 3.7 mi) earthquake occurred 379.9 miles away from Colleton County center
On 11/11/2002 at 23:39:29, a magnitude 4.0 (4.0 MB, Depth: 1.5 mi) earthquake occurred 54.5 miles away from the county center
Magnitude types: regional Lg-wave magnitude (LG), body-wave magnitude (MB), moment magnitude (MW)
Most recent natural disasters:
- South Carolina Severe Storms, Tornadoes, And Straight-line Winds, Incident Period: April 12, 2020 - April 13, 2020, FEMA Id: 4542, Natural disaster type: Storm, Tornado, Wind
- South Carolina Covid-19 Pandemic, Incident Period: January 20, 2020, FEMA Id: 4492, Natural disaster type: Other
- South Carolina Hurricane Dorian, Incident Period: August 31, 2019 - September 6, 2019, FEMA Id: 4464, Natural disaster type: Hurricane
- South Carolina Hurricane Florence, Incident Period: September 8, 2018 - October 8, 2018, FEMA Id: 4394, Natural disaster type: Hurricane
- South Carolina Hurricane Irma, Incident Period: September 6, 2017 - September 13, 2017, FEMA Id: 4346, Natural disaster type: Hurricane
- South Carolina Hurricane Matthew, Incident Period: October 04, 2016 to October 30, 2016, Emergency Declared EM-3378: October 06, 2016, FEMA Id: 3378, Natural disaster type: Hurricane
- South Carolina Hurricane Matthew, Incident Period: October 04, 2016 to October 30, 2016, Major Disaster (Presidential) Declared DR-4286: October 11, 2016, FEMA Id: 4286, Natural disaster type: Hurricane
- South Carolina Severe Storms and Flooding, Incident Period: October 01, 2015 to October 23, 2015, Emergency Declared EM-3373: October 03, 2015, FEMA Id: 3373, Natural disaster type: Storm, Flood
- South Carolina Severe Storms and Flooding, Incident Period: October 01, 2015 to October 23, 2015, Major Disaster (Presidential) Declared DR-4241: October 05, 2015, FEMA Id: 4241, Natural disaster type: Storm, Flood
- South Carolina Severe Winter Storm, Incident Period: February 10, 2014 to February 19, 2014, Emergency Declared EM-3369: February 12, 2014, FEMA Id: 3369, Natural disaster type: Winter Storm
- 6 other natural disasters have been reported since 1953.
The number of natural disasters in Colleton County (16) is near the US average (15).
Major Disasters (Presidential) Declared: 6
Emergencies Declared: 5
Causes of natural disasters: Hurricanes: 9, Storms: 3, Winter Storms: 3, Floods: 2, Tornado: 1, Wind: 1, Other: 1 (Note: some incidents may be assigned to more than one category).
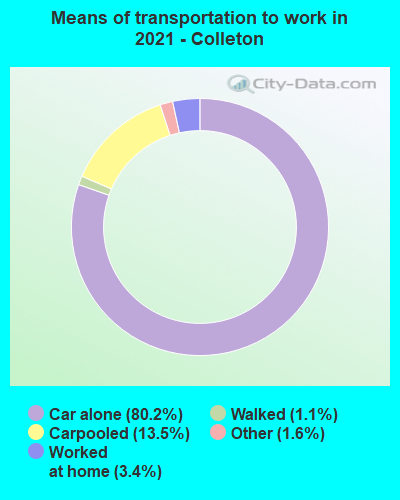
Means of transportation to work:
- Drove a car alone: 9,960 (75.3%)
- Carpooled: 1,757 (13.3%)
- Long-distance train or commuter rail: 4 (0.0%)
- Taxicab, motorcycle, or other means: 328 (2.5%)
- Bicycle: 9 (0.1%)
- Walked: 106 (0.8%)
- Worked at home: 934 (7.1%)
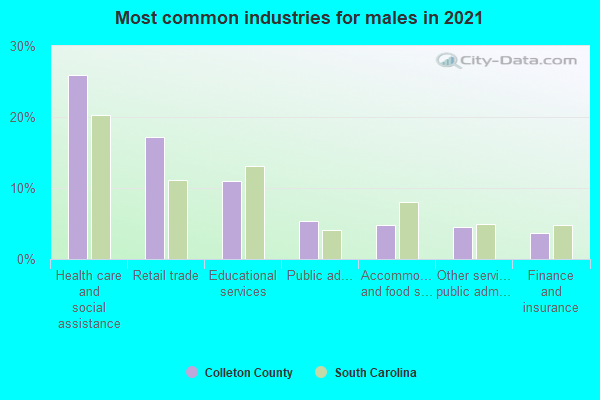
- Health care and social assistance (25%)
- Retail trade (17%)
- Accommodation and food services (9%)
- Educational services (9%)
- Manufacturing (5%)
- Public administration (5%)
- Other services, except public administration (4%)
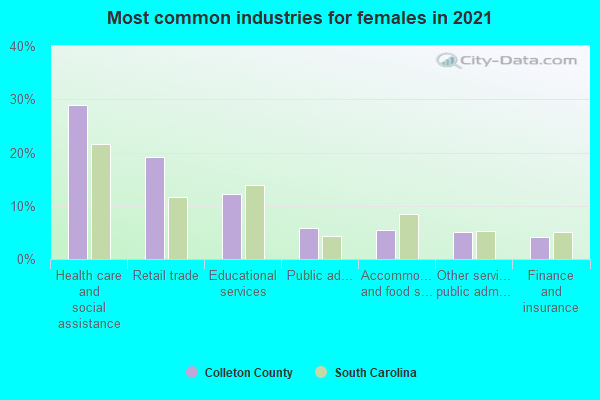
- Health care and social assistance (27%)
- Retail trade (19%)
- Accommodation and food services (10%)
- Educational services (10%)
- Manufacturing (6%)
- Public administration (5%)
- Other services, except public administration (4%)
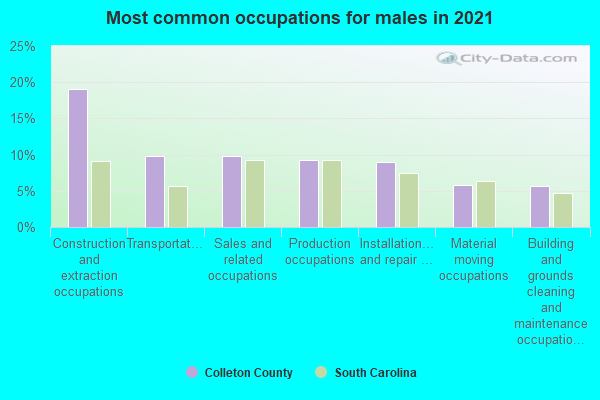
- Construction and extraction occupations (17%)
- Production occupations (11%)
- Installation, maintenance, and repair occupations (10%)
- Transportation occupations (10%)
- Sales and related occupations (9%)
- Management occupations (7%)
- Material moving occupations (6%)
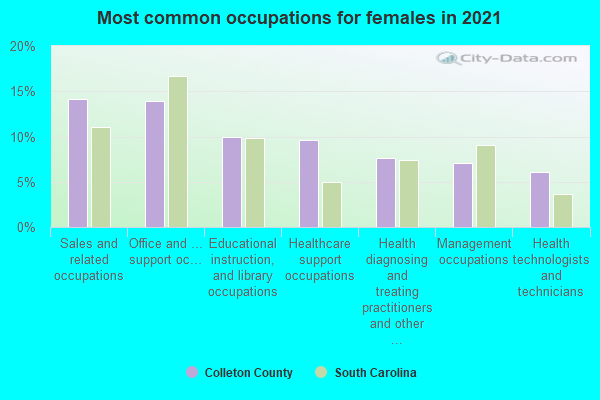
- Office and administrative support occupations (17%)
- Sales and related occupations (16%)
- Management occupations (9%)
- Educational instruction, and library occupations (9%)
- Healthcare support occupations (8%)
- Health diagnosing and treating practitioners and other technical occupations (7%)
- Building and grounds cleaning and maintenance occupations (5%)
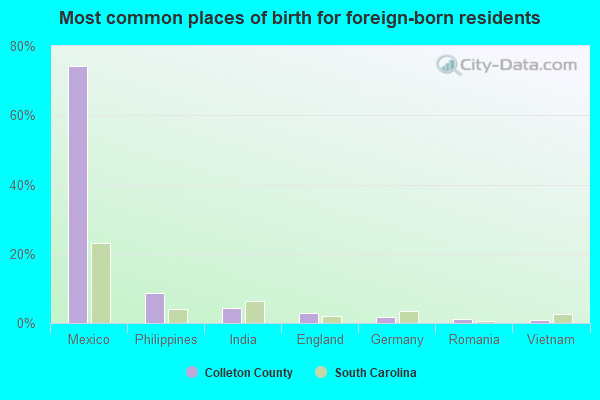
- Mexico (70%)
- India (9%)
- Philippines (6%)
- Germany (3%)
- England (2%)
- Netherlands (1%)
- Australia (1%)
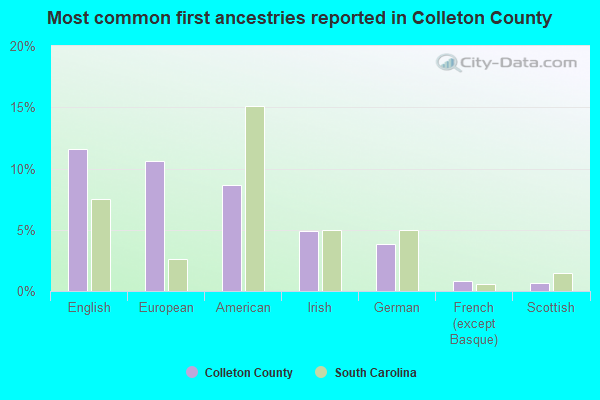
- American (13%)
- European (10%)
- English (9%)
- Irish (5%)
- German (4%)
- French (except Basque) (1%)
- Scotch-Irish (1%)
People in group quarters in Colleton County, South Carolina in 2010:
- 359 people in nursing facilities/skilled-nursing facilities
- 20 people in group homes intended for adults
- 9 people in emergency and transitional shelters (with sleeping facilities) for people experiencing homelessness
People in group quarters in Colleton County, South Carolina in 2000:
- 127 people in nursing homes
- 71 people in local jails and other confinement facilities (including police lockups)
- 50 people in other group homes
- 49 people in agriculture workers' dormitories on farms
- 26 people in homes for the mentally retarded
- 9 people in other noninstitutional group quarters
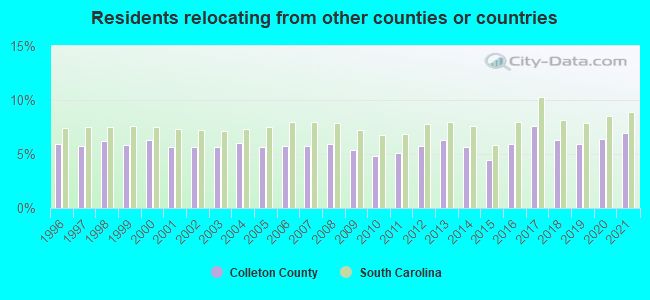
6.96% of this county's 2021 resident taxpayers lived in other counties in 2020 ($51,234 average adjusted gross income)
| Here: | 6.96% |
| South Carolina average: | 8.89% |
10 or fewer of this county's residents moved from foreign countries.
4.51% relocated from other counties in South Carolina ($32,203 average AGI)
2.46% relocated from other states ($19,031 average AGI)
Colleton County: 2.46% South Carolina average: 4.96%
Top counties from which taxpayers relocated into this county between 2020 and 2021:
| from Dorchester County, SC | |
| from Charleston County, SC | |
| from Berkeley County, SC | |
| from Beaufort County, SC | |
| from Orangeburg County, SC | |
| from Hampton County, SC | |
| from Richland County, SC |
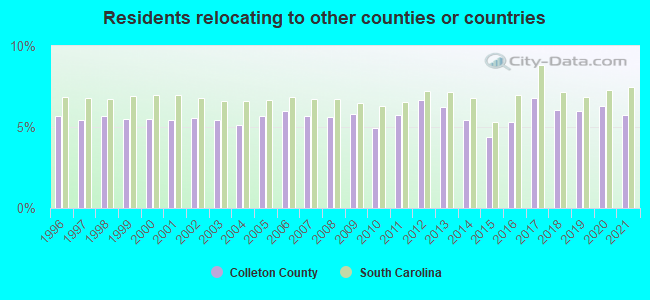
5.77% of this county's 2020 resident taxpayers moved to other counties in 2021 ($38,379 average adjusted gross income)
| Here: | 5.77% |
| South Carolina average: | 7.46% |
10 or fewer of this county's residents moved to foreign countries.
3.94% relocated to other counties in South Carolina ($27,692 average AGI)
1.83% relocated to other states ($10,687 average AGI)
Colleton County: 1.83% South Carolina average: 3.47%
Top counties to which taxpayers relocated from this county between 2020 and 2021:
| to Dorchester County, SC | |
| to Charleston County, SC | |
| to Berkeley County, SC | |
| to Beaufort County, SC | |
| to Hampton County, SC | |
| to Bamberg County, SC | |
| to Richland County, SC |
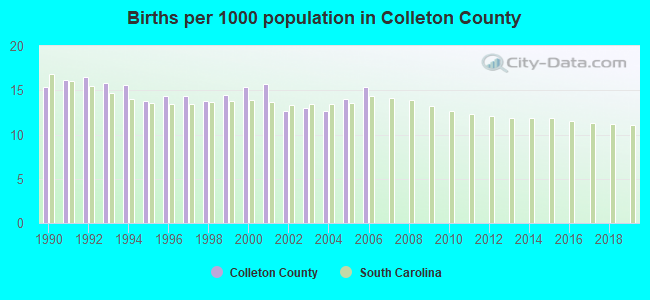
Births per 1000 population from 1990 to 1999: 15.0
Births per 1000 population from 2000 to 2006: 14.1
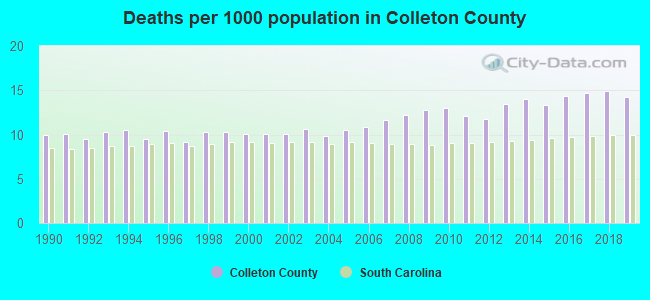
Deaths per 1000 population from 1990 to 1999: 10.0
Deaths per 1000 population from 2000 to 2009: 10.9
Deaths per 1000 population from 2010 to 2020: 13.9
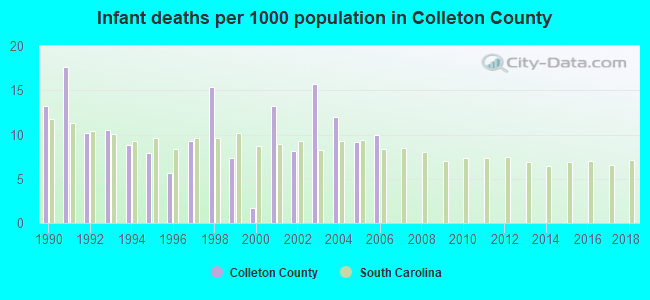
Infant deaths per 1000 live births from 1990 to 1999: 10.6
Infant deaths per 1000 live births from 2000 to 2006: 10.0
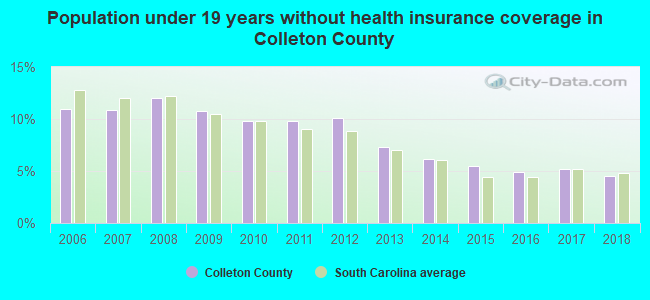
Persons under 19 years old without health insurance coverage in 2018: 4.5%
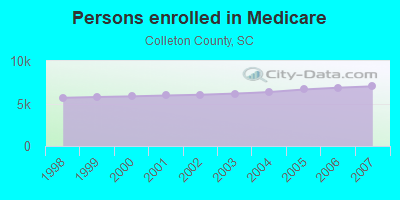
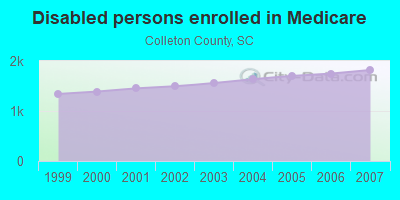
Persons enrolled in hospital insurance and/or supplemental medical insurance (Medicare) in July 1, 2007: 7,020 (5,200 aged, 1,820 disabled)
Children under 18 without health insurance coverage in 2007: 1,028 (10%)

Most common underlying causes of death in Colleton County, South Carolina in 1999 - 2019:
- Bronchus or lung, unspecified - Malignant neoplasms (680)
- Acute myocardial infarction, unspecified (540)
- Atherosclerotic heart disease (427)
- Chronic obstructive pulmonary disease, unspecified (403)
- Stroke, not specified as haemorrhage or infarction (282)
- Unspecified dementia (279)
- Alzheimer disease, unspecified (276)
- Congestive heart failure (262)
- Malignant neoplasm of prostate (97)
- Person injured in unspecified motor-vehicle accident, traffic (72)
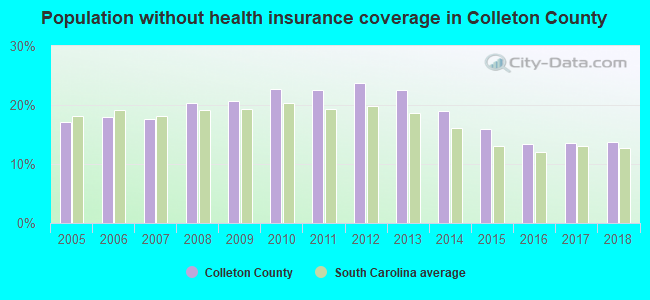
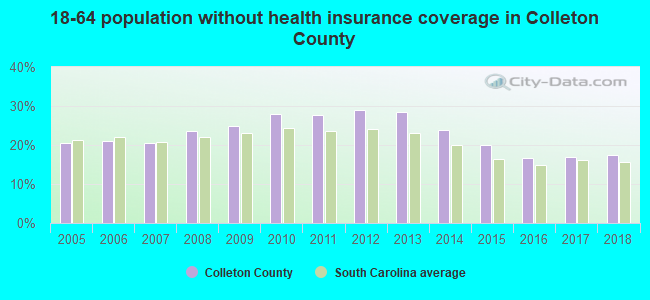
Population without health insurance coverage in 2000: 19%
Children under 18 without health insurance coverage in 2000: 16%
Short term general hospital admissions per 100,000 population in 2004: 12,471
Short term general hospital beds per 100,000 population in 2004: 331
Emergency room visits per 100,000 population in 2004: 52,211
General practice office based MDs per 100,000 population in 2005: 1,290
Medical specialist MDs per 100,000 population in 2005: 975
Dentists per 100,000 population in 1998: 3
Total births per 100,000 population, July 2005 - July 2006 : 24
Total deaths per 100,000 population, July 2005 - July 2006: 56
Limited-service eating places per 100,000 population in 2005 : 5
EPA green book nonattainment status in 2004-2006: 1
Homicides per 1,000,000 population from 2000 to 2006: 114.5. This is more than state average.
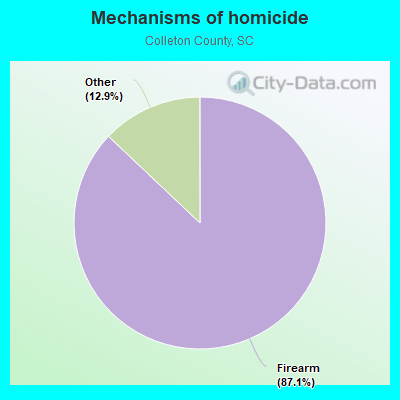
- Firearm - 99.7
- Other - 14.8
Suicides per 1,000,000 population from 2000 to 2006: 110.8. This is less than state average.
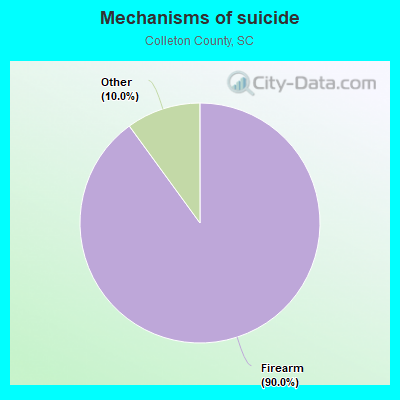
- Firearm - 99.7
- Other - 11.1
Household type by relationship:
Households: 39,609- Male householders: 7,851 (2,848 living alone), Female householders: 8,678 (2,455 living alone)
6,648 spouses (6,573 opposite-sex spouses), 1,395 unmarried partners, (1,372 opposite-sex unmarried partners), 9,463 children (9,067 natural, 108 adopted, 274 stepchildren), 2,296 grandchildren, 741 brothers or sisters, 228 parents, 296 foster children, 835 other relatives, 644 non-relatives
- In group quarters: 642
Size of family households: 5,220 2-persons, 2,560 3-persons, 1,238 4-persons, 616 5-persons, 352 6-persons, 330 7-or-more-persons.
Size of nonfamily households: 5,297 1-person, 738 2-persons, 137 3-persons, 5 4-persons, 62 5-persons.
3,471 married couples with children.
2,578 single-parent households (823 men, 1,755 women).
96.1% of residents of Colleton speak English at home.
3.1% of residents speak Spanish at home (44% speak English very well, 15% speak English well, 26% speak English not well, 15% don't speak English at all).
0.5% of residents speak other Indo-European language at home (85% speak English very well, 15% speak English well).
0.3% of residents speak Asian or Pacific Island language at home (96% speak English very well, 4% speak English well).
In fiscal year 2004:
Federal Government expenditure: $256,529,000 ($6,479 per capita)
Department of Defense expenditure: $10,321,000
Federal direct payments to individuals for retirement and disability: $110,599,000
Federal other direct payments to individuals: $57,573,000
Federal direct payments not to individuals: $1,578,000
Federal grants: $77,030,000
Federal procurement contracts: $1,800,000 ($495,000 Department of Defense)
Federal salaries and wages: $7,949,000 ($1,726,000 Department of Defense)
Federal Government direct loans: $109,000
Federal guaranteed/insured loans: $2,793,000
Federal Government insurance: $370,468,000
Population change from April 1, 2000 to July 1, 2005:
Births: 2,850| Here: | 72 per 1000 residents |
| State: | 69 per 1000 residents |
Deaths: 2,106
| Here: | 53 per 1000 residents |
| State: | 46 per 1000 residents |
Net international migration: +135
| Here: | +3 per 1000 residents |
| State: | +9 per 1000 residents |
Net internal migration: +519
| Here: | +13 per 1000 residents |
| State: | +27 per 1000 residents |
Total withdrawal of fresh water for public supply: 2.35 millions of gallons per day (all from ground)
| Here: | 6.2 |
| State: | 6.4 |
| Here: | 4.8 |
| State: | 4.5 |
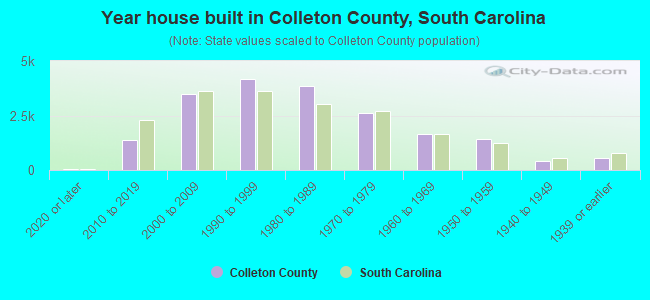
- Year house built in Colleton County, South Carolina
- 1132020 or later
- 1,7022010 to 2019
- 3,6452000 to 2009
- 3,7761990 to 1999
- 4,0231980 to 1989
- 2,6731970 to 1979
- 1,8181960 to 1969
- 1,1341950 to 1959
- 4131940 to 1949
- 5161939 or earlier
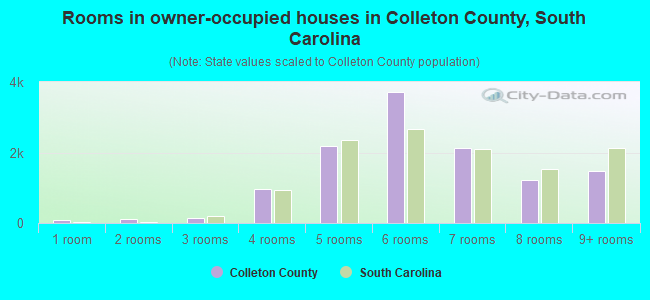
- Rooms in owner-occupied houses in Colleton County, South Carolina
- 1031 room
- 822 rooms
- 1473 rooms
- 9814 rooms
- 2,1835 rooms
- 3,4506 rooms
- 2,3367 rooms
- 1,3798 rooms
- 1,4829+ rooms
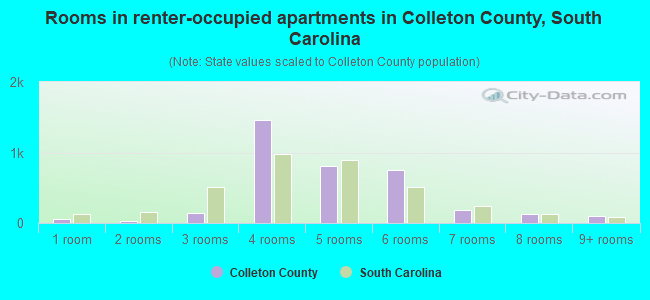
- Rooms in renter-occupied apartments in Colleton County, South Carolina
- 631 room
- 142 rooms
- 2523 rooms
- 1,5544 rooms
- 1,1505 rooms
- 8026 rooms
- 1437 rooms
- 1748 rooms
- 1739+ rooms
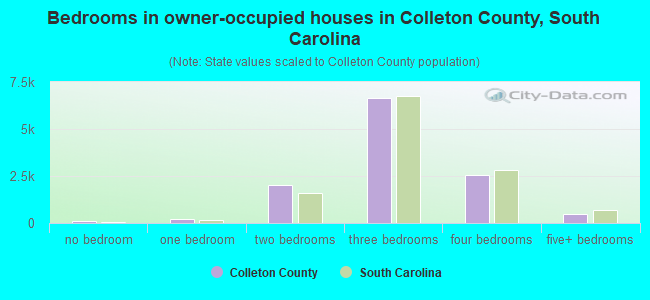
- Bedrooms in owner-occupied houses in Colleton County, South Carolina
- 112no bedroom
- 2021 bedroom
- 1,8162 bedrooms
- 6,8123 bedrooms
- 2,7034 bedrooms
- 5445+ bedrooms
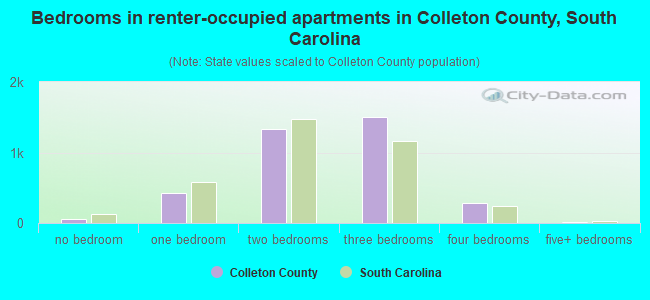
- Bedrooms in renter-occupied apartments in Colleton County, South Carolina
- 72no bedroom
- 4551 bedroom
- 1,5402 bedrooms
- 1,9823 bedrooms
- 2514 bedrooms
- 115+ bedrooms
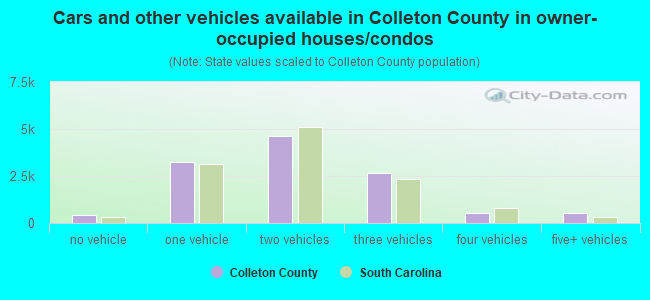
- Cars and other vehicles available in Colleton County in owner-occupied houses/condos
- 449no vehicle
- 3,6101 vehicle
- 4,5412 vehicles
- 2,5393 vehicles
- 5414 vehicles
- 5255+ vehicles
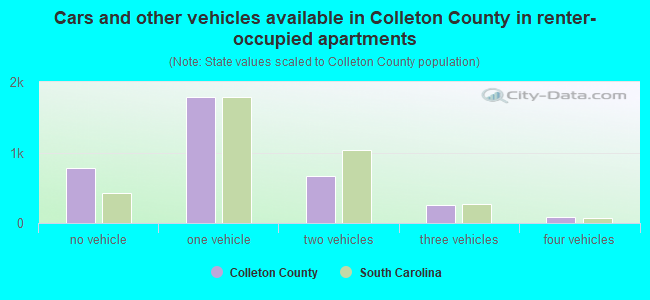
- Cars and other vehicles available in Colleton County in renter-occupied apartments
- 1,015no vehicle
- 1,7101 vehicle
- 1,1012 vehicles
- 3953 vehicles
- 554 vehicles
- 265+ vehicles
94.5% of Colleton County residents lived in the same house 1 years ago.
Out of people who lived in different houses, 24% lived in this county.
Out of people who lived in different counties, 73% lived in South Carolina.
| Colleton County: | 94.5% |
| State average: | 86.5% |
Place of birth for U.S.-born residents:
- This state: 28,501
- Other state: 9,255
- Northeast: 2,996
- Midwest: 1,127
- South: 4,301
- West: 830
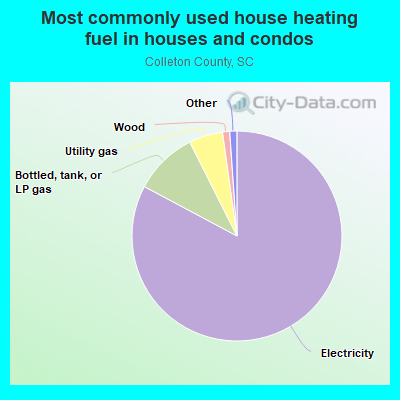
- 81.1%Electricity
- 10.1%Bottled, tank, or LP gas
- 5.9%Utility gas
- 1.5%Wood
- 0.7%Fuel oil, kerosene, etc.
- 0.5%No fuel used
- 0.2%Solar energy
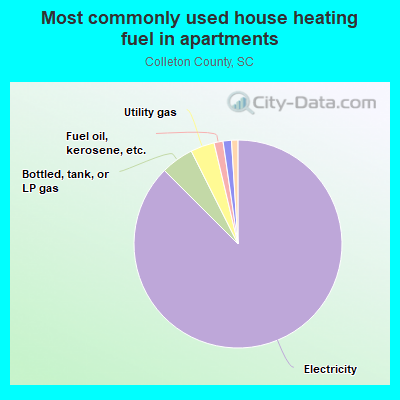
- 86.8%Electricity
- 5.6%Bottled, tank, or LP gas
- 5.0%Utility gas
- 0.9%Other fuel
- 0.7%No fuel used
- 0.6%Fuel oil, kerosene, etc.
- 0.3%Wood
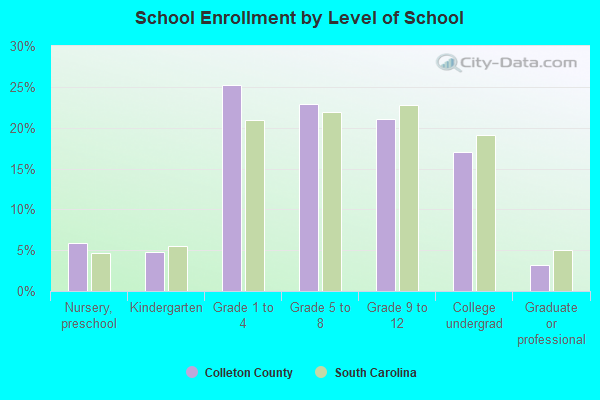
Private vs. public school enrollment:
| Here: | 7.8% |
| South Carolina: | 14.4% |
| Here: | 9.2% |
| South Carolina: | 11.1% |
| Here: | 10.6% |
| South Carolina: | 21.9% |
Colleton County government finances - Expenditure in 2018:
- Bond Funds - Cash and Securities: $30,591,000
Cash and Securities: $15,427,000
- Charges - Other: $5,876,000
Solid Waste Management: $2,446,000
Solid Waste Management: $1,982,000
Regular Highways: $985,000
Regular Highways: $960,000
Parks and Recreation: $601,000
Parks and Recreation: $359,000
- Construction - Parks and Recreation: $4,060,000
General - Other: $2,353,000
Regular Highways: $2,341,000
Police Protection: $850,000
Local Fire Protection: $489,000
Regular Highways: $411,000
Central Staff Services: $298,000
Central Staff Services: $258,000
Solid Waste Management: $201,000
Parks and Recreation: $187,000
- Current Operations - Local Fire Protection: $10,585,000
Local Fire Protection: $10,387,000
Police Protection: $10,384,000
Central Staff Services: $10,109,000
Central Staff Services: $6,458,000
Judicial and Legal Services: $6,217,000
Judicial and Legal Services: $5,726,000
Police Protection: $5,538,000
Solid Waste Management: $3,648,000
Parks and Recreation: $3,028,000
General - Other: $2,937,000
Solid Waste Management: $2,715,000
Health - Other: $2,656,000
Regular Highways: $2,212,000
Health - Other: $2,210,000
Parks and Recreation: $2,083,000
Regular Highways: $2,045,000
Correctional Institutions: $2,011,000
General Public Buildings: $1,825,000
General - Other: $1,812,000
Financial Administration: $1,760,000
Libraries: $907,000
Public Welfare Institutions: $869,000
Public Welfare Institutions: $822,000
Protective Inspection and Regulation - Other: $230,000
Public Welfare - Other: $155,000
Libraries: $98,000
- Federal Intergovernmental - Other: $743,000
Public Welfare: $653,000
Education: $3,000
- General - Interest on Debt: $1,100,000
Interest on Debt: $886,000
- Long Term Debt - Beginning Outstanding - Unspecified Public Purpose: $36,170,000
Beginning Outstanding - Unspecified Public Purpose: $35,223,000
Outstanding Unspecified Public Purpose: $33,473,000
Outstanding Unspecified Public Purpose: $31,005,000
Retired Unspecified Public Purpose: $5,165,000
Retired Unspecified Public Purpose: $1,750,000
- Miscellaneous - Fines and Forfeits: $6,587,000
Fines and Forfeits: $1,146,000
General Revenue - Other: $862,000
Interest Earnings: $729,000
Rents: $165,000
General Revenue - Other: $111,000
Sale of Property: $100,000
Donations From Private Sources: $6,000
- Other Capital Outlay - Parks and Recreation: $1,164,000
Regular Highways: $27,000
Judicial and Legal Services: $15,000
Solid Waste Management: $6,000
- Other Funds - Cash and Securities: $22,261,000
Cash and Securities: $7,252,000
- Sinking Funds - Cash and Securities: $2,526,000
- State Intergovernmental - General Local Government Support: $4,564,000
General Local Government Support: $2,763,000
Health and Hospitals: $765,000
Health and Hospitals: $732,000
Sewerage: $136,000
Water Utilities: $37,000
- Tax - Property: $26,872,000
Property: $18,930,000
General Sales and Gross Receipts: $3,182,000
General Sales and Gross Receipts: $2,221,000
Other: $1,147,000
Other Selective Sales: $1,055,000
Documentary and Stock Transfer: $347,000
Other License: $165,000
Motor Vehicle License: $147,000
Public Utilities Sales: $139,000
Public Utilities Sales: $70,000
Pari - mutuels Sales: $58,000
- Total Salaries and Wages: $17,132,000
Colleton County government finances - Revenue in 2018:
- Bond Funds - Cash and Securities: $30,591,000
Cash and Securities: $15,427,000
- Charges - Other: $5,876,000
Solid Waste Management: $2,446,000
Solid Waste Management: $1,982,000
Regular Highways: $985,000
Regular Highways: $960,000
Parks and Recreation: $601,000
Parks and Recreation: $359,000
- Construction - Parks and Recreation: $4,060,000
General - Other: $2,353,000
Regular Highways: $2,341,000
Police Protection: $850,000
Local Fire Protection: $489,000
Regular Highways: $411,000
Central Staff Services: $298,000
Central Staff Services: $258,000
Solid Waste Management: $201,000
Parks and Recreation: $187,000
- Current Operations - Local Fire Protection: $10,585,000
Local Fire Protection: $10,387,000
Police Protection: $10,384,000
Central Staff Services: $10,109,000
Central Staff Services: $6,458,000
Judicial and Legal Services: $6,217,000
Judicial and Legal Services: $5,726,000
Police Protection: $5,538,000
Solid Waste Management: $3,648,000
Parks and Recreation: $3,028,000
General - Other: $2,937,000
Solid Waste Management: $2,715,000
Health - Other: $2,656,000
Regular Highways: $2,212,000
Health - Other: $2,210,000
Parks and Recreation: $2,083,000
Regular Highways: $2,045,000
Correctional Institutions: $2,011,000
General Public Buildings: $1,825,000
General - Other: $1,812,000
Financial Administration: $1,760,000
Libraries: $907,000
Public Welfare Institutions: $869,000
Public Welfare Institutions: $822,000
Protective Inspection and Regulation - Other: $230,000
Public Welfare - Other: $155,000
Libraries: $98,000
- Federal Intergovernmental - Other: $743,000
Public Welfare: $653,000
Education: $3,000
- General - Interest on Debt: $1,100,000
Interest on Debt: $886,000
- Long Term Debt - Beginning Outstanding - Unspecified Public Purpose: $36,170,000
Beginning Outstanding - Unspecified Public Purpose: $35,223,000
Outstanding Unspecified Public Purpose: $33,473,000
Outstanding Unspecified Public Purpose: $31,005,000
Retired Unspecified Public Purpose: $5,165,000
Retired Unspecified Public Purpose: $1,750,000
- Miscellaneous - Fines and Forfeits: $6,587,000
Fines and Forfeits: $1,146,000
General Revenue - Other: $862,000
Interest Earnings: $729,000
Rents: $165,000
General Revenue - Other: $111,000
Sale of Property: $100,000
Donations From Private Sources: $6,000
- Other Capital Outlay - Parks and Recreation: $1,164,000
Regular Highways: $27,000
Judicial and Legal Services: $15,000
Solid Waste Management: $6,000
- Other Funds - Cash and Securities: $22,261,000
Cash and Securities: $7,252,000
- Sinking Funds - Cash and Securities: $2,526,000
- State Intergovernmental - General Local Government Support: $4,564,000
General Local Government Support: $2,763,000
Health and Hospitals: $765,000
Health and Hospitals: $732,000
Sewerage: $136,000
Water Utilities: $37,000
- Tax - Property: $26,872,000
Property: $18,930,000
General Sales and Gross Receipts: $3,182,000
General Sales and Gross Receipts: $2,221,000
Other: $1,147,000
Other Selective Sales: $1,055,000
Documentary and Stock Transfer: $347,000
Other License: $165,000
Motor Vehicle License: $147,000
Public Utilities Sales: $139,000
Public Utilities Sales: $70,000
Pari - mutuels Sales: $58,000
- Total Salaries and Wages: $17,132,000
Colleton County government finances - Debt in 2018:
- Bond Funds - Cash and Securities: $30,591,000
Cash and Securities: $15,427,000
- Charges - Other: $5,876,000
Solid Waste Management: $2,446,000
Solid Waste Management: $1,982,000
Regular Highways: $985,000
Regular Highways: $960,000
Parks and Recreation: $601,000
Parks and Recreation: $359,000
- Construction - Parks and Recreation: $4,060,000
General - Other: $2,353,000
Regular Highways: $2,341,000
Police Protection: $850,000
Local Fire Protection: $489,000
Regular Highways: $411,000
Central Staff Services: $298,000
Central Staff Services: $258,000
Solid Waste Management: $201,000
Parks and Recreation: $187,000
- Current Operations - Local Fire Protection: $10,585,000
Local Fire Protection: $10,387,000
Police Protection: $10,384,000
Central Staff Services: $10,109,000
Central Staff Services: $6,458,000
Judicial and Legal Services: $6,217,000
Judicial and Legal Services: $5,726,000
Police Protection: $5,538,000
Solid Waste Management: $3,648,000
Parks and Recreation: $3,028,000
General - Other: $2,937,000
Solid Waste Management: $2,715,000
Health - Other: $2,656,000
Regular Highways: $2,212,000
Health - Other: $2,210,000
Parks and Recreation: $2,083,000
Regular Highways: $2,045,000
Correctional Institutions: $2,011,000
General Public Buildings: $1,825,000
General - Other: $1,812,000
Financial Administration: $1,760,000
Libraries: $907,000
Public Welfare Institutions: $869,000
Public Welfare Institutions: $822,000
Protective Inspection and Regulation - Other: $230,000
Public Welfare - Other: $155,000
Libraries: $98,000
- Federal Intergovernmental - Other: $743,000
Public Welfare: $653,000
Education: $3,000
- General - Interest on Debt: $1,100,000
Interest on Debt: $886,000
- Long Term Debt - Beginning Outstanding - Unspecified Public Purpose: $36,170,000
Beginning Outstanding - Unspecified Public Purpose: $35,223,000
Outstanding Unspecified Public Purpose: $33,473,000
Outstanding Unspecified Public Purpose: $31,005,000
Retired Unspecified Public Purpose: $5,165,000
Retired Unspecified Public Purpose: $1,750,000
- Miscellaneous - Fines and Forfeits: $6,587,000
Fines and Forfeits: $1,146,000
General Revenue - Other: $862,000
Interest Earnings: $729,000
Rents: $165,000
General Revenue - Other: $111,000
Sale of Property: $100,000
Donations From Private Sources: $6,000
- Other Capital Outlay - Parks and Recreation: $1,164,000
Regular Highways: $27,000
Judicial and Legal Services: $15,000
Solid Waste Management: $6,000
- Other Funds - Cash and Securities: $22,261,000
Cash and Securities: $7,252,000
- Sinking Funds - Cash and Securities: $2,526,000
- State Intergovernmental - General Local Government Support: $4,564,000
General Local Government Support: $2,763,000
Health and Hospitals: $765,000
Health and Hospitals: $732,000
Sewerage: $136,000
Water Utilities: $37,000
- Tax - Property: $26,872,000
Property: $18,930,000
General Sales and Gross Receipts: $3,182,000
General Sales and Gross Receipts: $2,221,000
Other: $1,147,000
Other Selective Sales: $1,055,000
Documentary and Stock Transfer: $347,000
Other License: $165,000
Motor Vehicle License: $147,000
Public Utilities Sales: $139,000
Public Utilities Sales: $70,000
Pari - mutuels Sales: $58,000
- Total Salaries and Wages: $17,132,000
Colleton County government finances - Cash and Securities in 2018:
- Bond Funds - Cash and Securities: $30,591,000
Cash and Securities: $15,427,000
- Charges - Other: $5,876,000
Solid Waste Management: $2,446,000
Solid Waste Management: $1,982,000
Regular Highways: $985,000
Regular Highways: $960,000
Parks and Recreation: $601,000
Parks and Recreation: $359,000
- Construction - Parks and Recreation: $4,060,000
General - Other: $2,353,000
Regular Highways: $2,341,000
Police Protection: $850,000
Local Fire Protection: $489,000
Regular Highways: $411,000
Central Staff Services: $298,000
Central Staff Services: $258,000
Solid Waste Management: $201,000
Parks and Recreation: $187,000
- Current Operations - Local Fire Protection: $10,585,000
Local Fire Protection: $10,387,000
Police Protection: $10,384,000
Central Staff Services: $10,109,000
Central Staff Services: $6,458,000
Judicial and Legal Services: $6,217,000
Judicial and Legal Services: $5,726,000
Police Protection: $5,538,000
Solid Waste Management: $3,648,000
Parks and Recreation: $3,028,000
General - Other: $2,937,000
Solid Waste Management: $2,715,000
Health - Other: $2,656,000
Regular Highways: $2,212,000
Health - Other: $2,210,000
Parks and Recreation: $2,083,000
Regular Highways: $2,045,000
Correctional Institutions: $2,011,000
General Public Buildings: $1,825,000
General - Other: $1,812,000
Financial Administration: $1,760,000
Libraries: $907,000
Public Welfare Institutions: $869,000
Public Welfare Institutions: $822,000
Protective Inspection and Regulation - Other: $230,000
Public Welfare - Other: $155,000
Libraries: $98,000
- Federal Intergovernmental - Other: $743,000
Public Welfare: $653,000
Education: $3,000
- General - Interest on Debt: $1,100,000
Interest on Debt: $886,000
- Long Term Debt - Beginning Outstanding - Unspecified Public Purpose: $36,170,000
Beginning Outstanding - Unspecified Public Purpose: $35,223,000
Outstanding Unspecified Public Purpose: $33,473,000
Outstanding Unspecified Public Purpose: $31,005,000
Retired Unspecified Public Purpose: $5,165,000
Retired Unspecified Public Purpose: $1,750,000
- Miscellaneous - Fines and Forfeits: $6,587,000
Fines and Forfeits: $1,146,000
General Revenue - Other: $862,000
Interest Earnings: $729,000
Rents: $165,000
General Revenue - Other: $111,000
Sale of Property: $100,000
Donations From Private Sources: $6,000
- Other Capital Outlay - Parks and Recreation: $1,164,000
Regular Highways: $27,000
Judicial and Legal Services: $15,000
Solid Waste Management: $6,000
- Other Funds - Cash and Securities: $22,261,000
Cash and Securities: $7,252,000
- Sinking Funds - Cash and Securities: $2,526,000
- State Intergovernmental - General Local Government Support: $4,564,000
General Local Government Support: $2,763,000
Health and Hospitals: $765,000
Health and Hospitals: $732,000
Sewerage: $136,000
Water Utilities: $37,000
- Tax - Property: $26,872,000
Property: $18,930,000
General Sales and Gross Receipts: $3,182,000
General Sales and Gross Receipts: $2,221,000
Other: $1,147,000
Other Selective Sales: $1,055,000
Documentary and Stock Transfer: $347,000
Other License: $165,000
Motor Vehicle License: $147,000
Public Utilities Sales: $139,000
Public Utilities Sales: $70,000
Pari - mutuels Sales: $58,000
- Total Salaries and Wages: $17,132,000
Supplemental Security Income (SSI) in 2006:
- Total number of recipients: 1,778
- Number of aged recipients: 158
- Number of blind and disabled recipients: 1,620
- Number of recipients under 18: 270
- Number of recipients between 18 and 64: 1,112
- Number of recipients older than 64: 396
- Number of recipients also receiving OASDI: 674
- Amount of payments (thousands of dollars): 740
| Most common first names in Colleton County, SC among deceased individuals | ||
| Name | Count | Lived (average) |
|---|---|---|
| James | 208 | 68.2 years |
| John | 186 | 70.7 years |
| William | 168 | 70.2 years |
| Mary | 157 | 76.4 years |
| George | 95 | 70.5 years |
| Robert | 94 | 70.3 years |
| Willie | 91 | 69.8 years |
| Charles | 84 | 70.7 years |
| Joseph | 79 | 70.6 years |
| Henry | 66 | 71.5 years |
| Most common last names in Colleton County, SC among deceased individuals | ||
| Last name | Count | Lived (average) |
|---|---|---|
| Crosby | 150 | 73.9 years |
| Williams | 137 | 70.0 years |
| Brown | 126 | 73.0 years |
| Smith | 96 | 73.0 years |
| Carter | 67 | 77.0 years |
| Jones | 64 | 72.3 years |
| Hiott | 63 | 71.6 years |
| Nettles | 56 | 68.2 years |
| Johnson | 55 | 69.4 years |
| Ackerman | 53 | 77.1 years |
| Businesses in Colleton County, SC | ||||
| Name | Count | Name | Count | |
|---|---|---|---|---|
| Ace Hardware | 1 | La-Z-Boy | 2 | |
| Advance Auto Parts | 1 | Lane Furniture | 1 | |
| Arby's | 1 | Little Caesars Pizza | 1 | |
| AutoZone | 1 | McDonald's | 2 | |
| Best Western | 1 | Microtel | 1 | |
| Burger King | 1 | Motel 6 | 1 | |
| CVS | 1 | Nike | 3 | |
| Chevrolet | 1 | Pizza Hut | 1 | |
| Church's Chicken | 1 | Quality | 1 | |
| Comfort Inn | 1 | Quiznos | 1 | |
| Cracker Barrel | 1 | Ramada | 1 | |
| Curves | 1 | Rite Aid | 1 | |
| DHL | 1 | Ruby Tuesday | 1 | |
| Dairy Queen | 2 | SONIC Drive-In | 1 | |
| Days Inn | 1 | Sears | 1 | |
| Domino's Pizza | 2 | Sleep Inn | 1 | |
| FedEx | 4 | Subway | 1 | |
| Ford | 1 | Super 8 | 1 | |
| GNC | 1 | T-Mobile | 2 | |
| GameStop | 1 | Taco Bell | 1 | |
| Goodwill | 2 | True Value | 1 | |
| H&R Block | 1 | U-Haul | 4 | |
| Hardee's | 1 | UPS | 3 | |
| Hilton | 1 | Verizon Wireless | 1 | |
| Holiday Inn | 1 | Waffle House | 2 | |
| Jones New York | 1 | Walgreens | 1 | |
| KFC | 2 | Walmart | 1 | |
| Kincaid | 1 | |||
Colleton County on our top lists:
- #53 on the list of "Top 101 counties with the lowest Ozone (1-hour) air pollution readings in 2012 (ppm)"