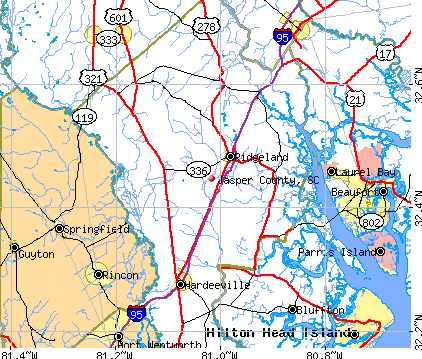
Jasper County, South Carolina (SC)
County owner-occupied free and clear houses and condos in 2010: 2,504
County owner-occupied houses and condos in 2000: 5,476
Renter-occupied apartments: 2,646 (it was 1,566 in 2000)
| % of renters here: | 22% |
| State: | 31% |
Land area: 656 sq. mi.
Water area: 43.7 sq. mi.
Population density: 46 people per square mile (average).
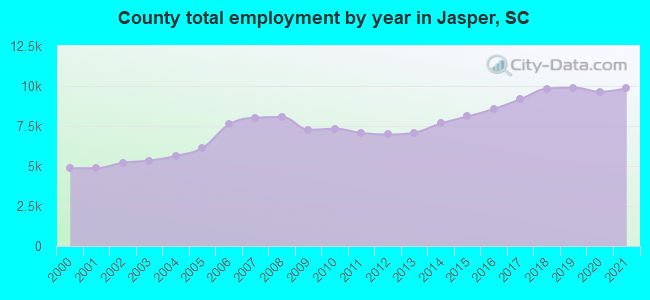
Industries providing employment: Educational, health and social services (18.5%), Retail trade (16.4%), Construction (11.9%), Professional, scientific, management, administrative, and waste management services (11.5%), Arts, entertainment, recreation, accommodation and food services (11.1%).
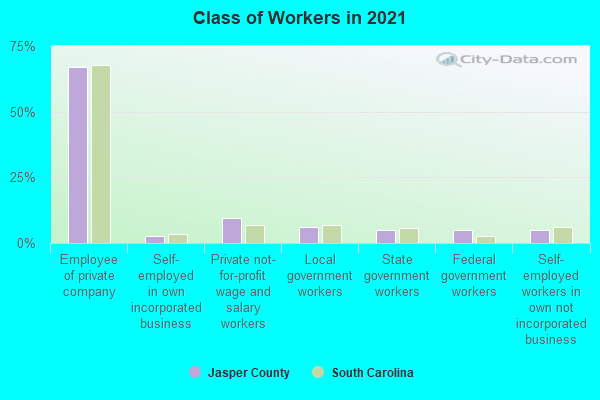
Type of workers:
- Private wage or salary: 80%
- Government: 14%
- Self-employed, not incorporated: 6%
- Unpaid family work: 0%
- OSM Map
- General Map
- Google Map
- MSN Map

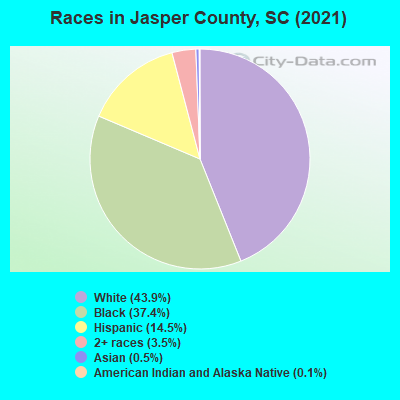
- 13,58144.9%White Non-Hispanic Alone
- 10,95336.2%Black Non-Hispanic Alone
- 4,47714.8%Hispanic or Latino
- 9973.3%Two or more races
- 1870.6%Asian alone
- 180.06%Some other race alone
- 100.03%American Indian and Alaska Native alone
| Median resident age: | 44.1 years |
| South Carolina median age: | 40.5 years |
| Males: 15,027 | |
| Females: 15,217 |

 | Should there be a freeway connection between Augusta and Charleston? (6 replies) |
| 2020 SC Census Number (360 replies) |
| South Carolina 10 year growth changes (157 replies) |
| New Exit on I-95 could bring big business to Jasper County (0 replies) |
| Rural Towns near Shoreline (75 replies) |
| Since 2000 Charleston has added 238k residents, eclipsing our 2030 forecasts already (94 replies) |
| Jasper County: | 2.0 people |
| South Carolina: | 2 people |
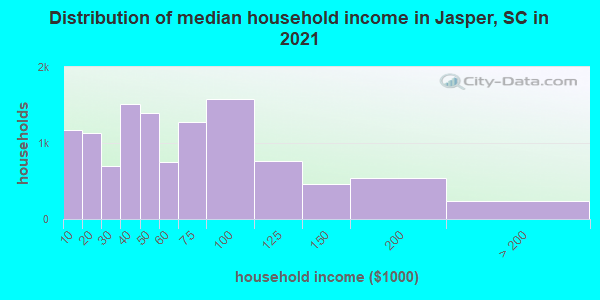
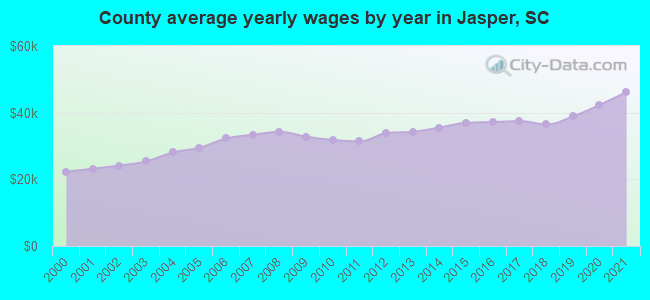
Estimated median household income in 2022: $60,919 ($30,727 in 1999)
| This county: | $60,919 |
| South Carolina: | $64,115 |
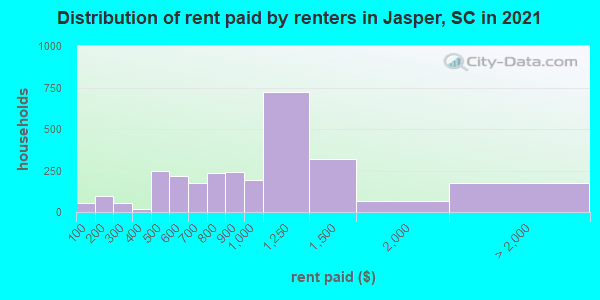
Median contract rent in 2022 for apartments: $1,013 (lower quartile is $583, upper quartile is $1,335)
| This county: | $1013 |
| State: | $893 |
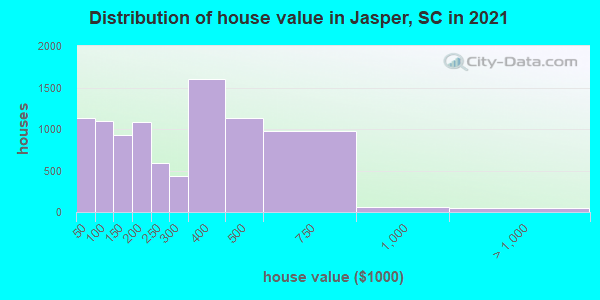
Estimated median house or condo value in 2022: $286,984 (it was $64,900 in 2000)
| Jasper: | $286,984 |
| South Carolina: | $254,600 |
Mean price in 2022:
Median monthly housing costs for homes and condos with a mortgage: $1,387Detached houses: $439,334
Here: $439,334 State: $368,255 Townhouses or other attached units: $430,997
Here: $430,997 State: $292,023 Mobile homes: $107,150
Here: $107,150 State: $102,531 Occupied boats, RVs, vans, etc.: $1,016,990
Here: $1,016,990 State: $132,484
Median monthly housing costs for units without a mortgage: $402
Institutionalized population: 1,452
Crime in 2021 (reported by the sheriff's office or county police, not the county total):
- Murders: 3
- Rapes: 9
- Robberies: 12
- Assaults: 56
- Burglaries: 56
- Thefts: 263
- Auto thefts: 61
Crime in 2018 (reported by the sheriff's office or county police, not the county total):
- Murders: 4
- Rapes: 2
- Robberies: 12
- Assaults: 14
- Burglaries: 58
- Thefts: 230
- Auto thefts: 29
Health of residents in Jasper County based on CDC Behavioral Risk Factor Surveillance System Survey Questionnaires from 2013 to 2021:
General health status score of residents in this county from 1 (poor) to 5 (excellent) is 3.6. This is better than average.78.2% of residents exercised in the past month. This is about average.
48.9% of residents smoked 100+ cigarettes in their lives. This is about average.
63.4% of adult residents drank alcohol in the past 30 days. This is less than average.
73.6% of residents visited a dentist within the past year. This is about average.
Average weight of males is 195 pounds. This is about average.
Average weight of females is 158 pounds. This is about average.
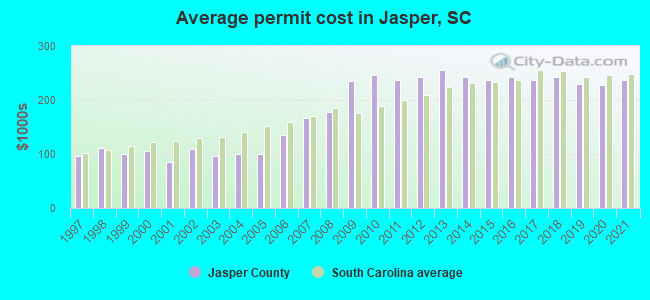
Single-family new house construction building permits:
- 2022: 1015 buildings, average cost: $229,400
- 2021: 871 buildings, average cost: $236,900
- 2020: 690 buildings, average cost: $227,300
- 2019: 575 buildings, average cost: $230,300
- 2018: 443 buildings, average cost: $242,000
- 2017: 255 buildings, average cost: $236,500
- 2016: 233 buildings, average cost: $243,100
- 2015: 247 buildings, average cost: $236,600
- 2014: 229 buildings, average cost: $241,500
- 2013: 204 buildings, average cost: $254,600
- 2012: 121 buildings, average cost: $242,200
- 2011: 119 buildings, average cost: $236,700
- 2010: 118 buildings, average cost: $245,800
- 2009: 117 buildings, average cost: $235,900
- 2008: 129 buildings, average cost: $177,600
- 2007: 239 buildings, average cost: $165,600
- 2006: 287 buildings, average cost: $135,900
- 2005: 198 buildings, average cost: $100,400
- 2004: 116 buildings, average cost: $100,400
- 2003: 68 buildings, average cost: $95,500
- 2002: 80 buildings, average cost: $110,400
- 2001: 82 buildings, average cost: $85,400
- 2000: 72 buildings, average cost: $105,400
- 1999: 77 buildings, average cost: $99,700
- 1998: 80 buildings, average cost: $110,800
- 1997: 94 buildings, average cost: $96,400

Median real estate property taxes paid for housing units with mortgages in 2022: $1,790 (0.5%)
Median real estate property taxes paid for housing units with no mortgage in 2022: $1,082 (0.5%)
| Jasper County: | 17.4% |
| South Carolina: | 14.0% |
Median age of residents in 2022: 44.1 years old
(Males: 42.6 years old, Females: 47.9 years old)
(Median age for: White residents: 57.4 years old, Black residents: 40.4 years old, American Indian residents: 20.5 years old, Asian residents: 65.9 years old, Hispanic or Latino residents: 28.0 years old, Other race residents: 22.5 years old)
Fair market rent in 2006 for a 1-bedroom apartment in Jasper County is $480 a month.
Fair market rent for a 2-bedroom apartment is $534 a month.
Fair market rent for a 3-bedroom apartment is $637 a month.
Cities in this county include: Grays-Tillman, Ridgeland, Hardeeville.
Neighboring counties: Beaufort County  , Chattahoochee County, Georgia
  , Madison Parish, Louisiana , Madison County, Mississippi , Dodge County, Georgia , Harris County, Georgia , Macon County, Georgia , Pulaski County, Georgia , Parker County, Texas , Taylor County, Texas .
| Here: | 2.8% |
| South Carolina: | 3.1% |
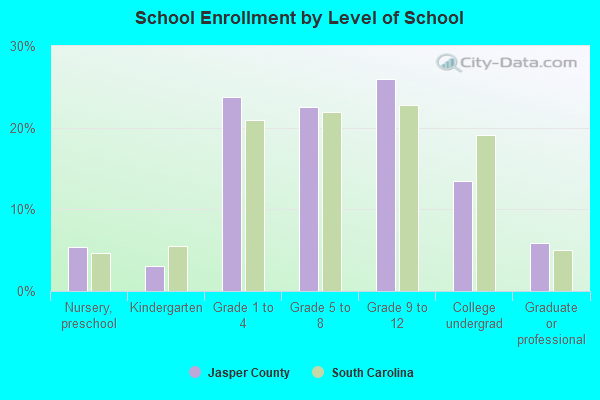
Current college students: 578
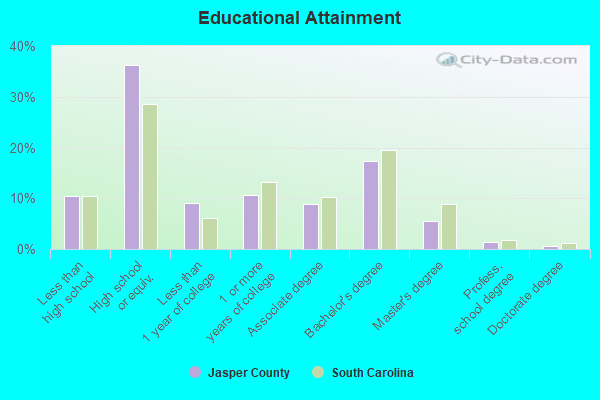
People 25 years of age or older with a high school degree or higher: 89.8%
People 25 years of age or older with a bachelor's degree or higher: 23.3%
Number of foreign born residents: 2,951 (33.0% naturalized citizens)
| Jasper County: | 9.8% |
| Whole state: | 5.2% |
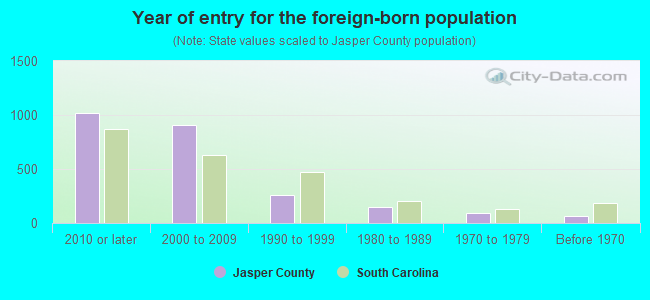
- Year of entry for the foreign-born population
- 1,0742010 or later
- 1,0672000 to 2009
- 2651990 to 1999
- 1451980 to 1989
- 901970 to 1979
- 65Before 1970
Mean travel time to work (commute): minutes
Percentage of county residents living and working in this county: 91.6%
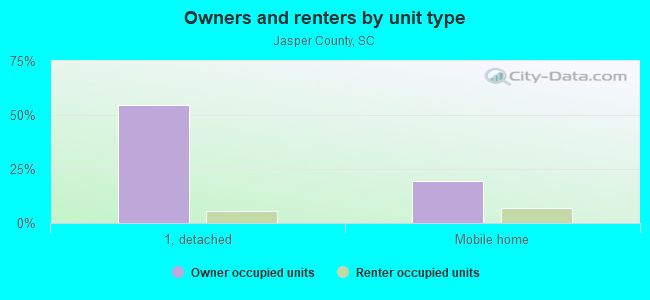
Housing units in structures:
- One, detached: 7,595
- One, attached: 525
- Two: 32
- 3 or 4: 383
- 5 to 9: 470
- 10 to 19: 377
- 20 to 49: 350
- 50 or more: 44
- Mobile homes: 3,643
- Boats, RVs, vans, etc.: 157
Housing units in Jasper County with a mortgage: 5,305 (147 second mortgage, 0 home equity loan, 125 both second mortgage and home equity loan)
Houses without a mortgage: 160
| Here: | 3.0% with mortgage |
| State: | 97.3% with mortgage |
Religion statistics for Jasper County
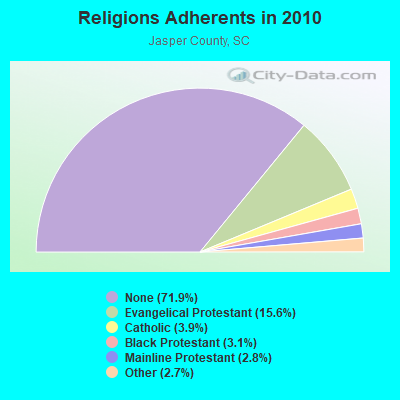
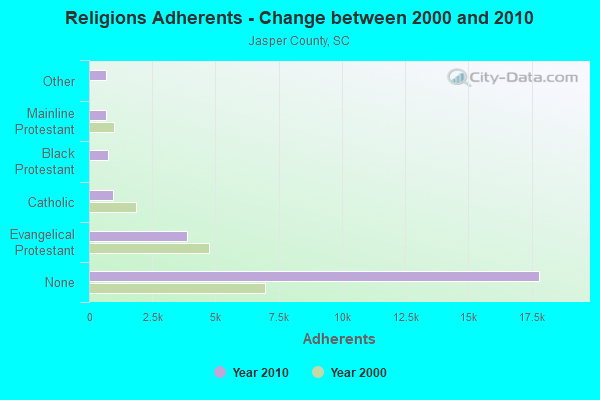
| Religion | Adherents | Congregations |
|---|---|---|
| Evangelical Protestant | 3,877 | 22 |
| Catholic | 956 | 2 |
| Black Protestant | 763 | 4 |
| Mainline Protestant | 687 | 6 |
| Other | 681 | 2 |
| None | 17,813 | - |
Source: Clifford Grammich, Kirk Hadaway, Richard Houseal, Dale E.Jones, Alexei Krindatch, Richie Stanley and Richard H.Taylor. 2012. 2010 U.S.Religion Census: Religious Congregations & Membership Study. Association of Statisticians of American Religious Bodies. Jones, Dale E., et al. 2002. Congregations and Membership in the United States 2000. Nashville, TN: Glenmary Research Center.
Food Environment Statistics:
| Jasper County: | 1.83 / 10,000 pop. |
| State: | 1.99 / 10,000 pop. |
| Here: | 0.46 / 10,000 pop. |
| South Carolina: | 0.15 / 10,000 pop. |
| This county: | 2.28 / 10,000 pop. |
| South Carolina: | 0.85 / 10,000 pop. |
| Jasper County: | 10.96 / 10,000 pop. |
| South Carolina: | 5.38 / 10,000 pop. |
| This county: | 7.76 / 10,000 pop. |
| State: | 7.75 / 10,000 pop. |
| Jasper County: | 13.4% |
| South Carolina: | 10.6% |
| Jasper County: | 33.7% |
| State: | 29.4% |
| Here: | 16.7% |
| State: | 13.4% |
Agriculture in Jasper County:
Average size of farms: 485 acresAverage value of agricultural products sold per farm: $52,421
Average value of crops sold per acre for harvested cropland: $1065.88
The value of livestock, poultry, and their products as a percentage of the total market value of agricultural products sold: 3.55%
Average total farm production expenses per farm: $45,198
Harvested cropland as a percentage of land in farms: 9.78%
Irrigated harvested cropland as a percentage of land in farms: 35.40%
Average market value of all machinery and equipment per farm: $81,353
The percentage of farms operated by a family or individual: 91.41%
Average age of principal farm operators: 58 years
Average number of cattle and calves per 100 acres of all land in farms: 1.46
Milk cows as a percentage of all cattle and calves: 1.65%
Corn for grain: 1629 harvested acres
Soybeans for beans: 710 harvested acres
Land in orchards: 13 acres
Earthquake activity:
Jasper County-area historical earthquake activity is significantly above South Carolina state average. It is 45% smaller than the overall U.S. average.On 11/22/1974 at 05:25:55, a magnitude 4.7 (4.7 MB, Class: Light, Intensity: IV - V) earthquake occurred 59.8 miles away from Jasper County center
On 8/2/1974 at 08:52:09, a magnitude 4.9 (4.3 MB, 4.9 LG) earthquake occurred 130.2 miles away from the county center
On 8/21/1992 at 16:31:55, a magnitude 4.4 (4.1 MB, 4.1 LG, 4.4 LG, Depth: 6.2 mi) earthquake occurred 67.1 miles away from the county center
On 11/11/2002 at 23:39:29, a magnitude 4.0 (4.0 MB, Depth: 1.5 mi) earthquake occurred 63.3 miles away from the county center
On 8/9/2020 at 12:07:37, a magnitude 5.1 (5.1 MW, Depth: 4.7 mi, Class: Moderate, Intensity: VI - VII) earthquake occurred 278.7 miles away from Jasper County center
On 8/23/2011 at 17:51:04, a magnitude 5.8 (5.8 MW, Depth: 3.7 mi) earthquake occurred 416.1 miles away from the county center
Magnitude types: regional Lg-wave magnitude (LG), body-wave magnitude (MB), moment magnitude (MW)
Most recent natural disasters:
- South Carolina Covid-19 Pandemic, Incident Period: January 20, 2020, FEMA Id: 4492, Natural disaster type: Other
- South Carolina Hurricane Dorian, Incident Period: August 31, 2019 - September 6, 2019, FEMA Id: 4464, Natural disaster type: Hurricane
- South Carolina Hurricane Florence, Incident Period: September 8, 2018 - October 8, 2018, FEMA Id: 4394, Natural disaster type: Hurricane
- South Carolina Hurricane Irma, Incident Period: September 6, 2017 - September 13, 2017, FEMA Id: 4346, Natural disaster type: Hurricane
- South Carolina Hurricane Matthew, Incident Period: October 04, 2016 to October 30, 2016, Emergency Declared EM-3378: October 06, 2016, FEMA Id: 3378, Natural disaster type: Hurricane
- South Carolina Hurricane Matthew, Incident Period: October 04, 2016 to October 30, 2016, Major Disaster (Presidential) Declared DR-4286: October 11, 2016, FEMA Id: 4286, Natural disaster type: Hurricane
- South Carolina Severe Storms and Flooding, Incident Period: October 01, 2015 to October 23, 2015, Emergency Declared EM-3373: October 03, 2015, FEMA Id: 3373, Natural disaster type: Storm, Flood
- South Carolina Severe Winter Storm, Incident Period: February 10, 2014 to February 19, 2014, Emergency Declared EM-3369: February 12, 2014, FEMA Id: 3369, Natural disaster type: Winter Storm
- South Carolina Hurricane Katrina Evacuation, Incident Period: August 29, 2005 to October 01, 2005, Emergency Declared EM-3233: September 10, 2005, FEMA Id: 3233, Natural disaster type: Hurricane
- South Carolina Hurricane Floyd, Incident Period: September 14, 1999 to September 30, 1999, Major Disaster (Presidential) Declared DR-1299: September 21, 1999, FEMA Id: 1299, Natural disaster type: Hurricane
- 2 other natural disasters have been reported since 1953.
The number of natural disasters in Jasper County (12) is smaller than the US average (15).
Major Disasters (Presidential) Declared: 2
Emergencies Declared: 6
Causes of natural disasters: Hurricanes: 8, Drought: 1, Flood: 1, Storm: 1, Winter Storm: 1, Other: 1 (Note: some incidents may be assigned to more than one category).
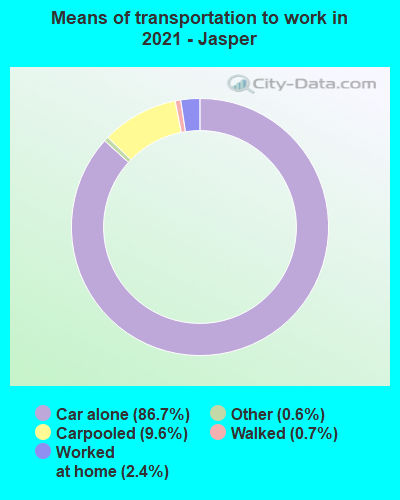
Means of transportation to work:
- Drove a car alone: 8,491 (79.2%)
- Carpooled: 1,078 (10.0%)
- Taxicab, motorcycle, or other means: 98 (0.9%)
- Bicycle: 32 (0.3%)
- Walked: 189 (1.8%)
- Worked at home: 680 (6.3%)
- Health care and social assistance (18%)
- Retail trade (15%)
- Educational services (9%)
- Accommodation and food services (9%)
- Public administration (7%)
- Finance and insurance (6%)
- Administrative and support and waste management services (6%)
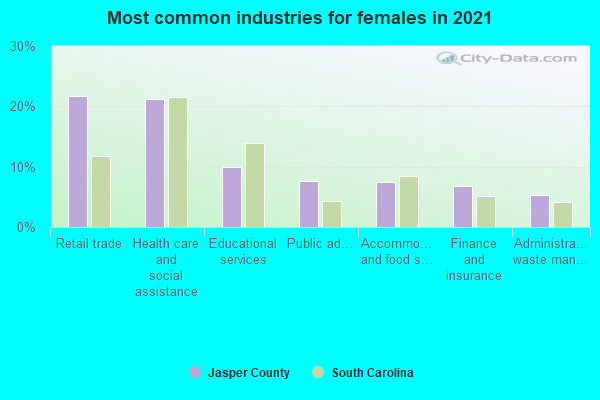
- Health care and social assistance (20%)
- Retail trade (17%)
- Educational services (10%)
- Accommodation and food services (10%)
- Public administration (7%)
- Finance and insurance (7%)
- Administrative and support and waste management services (6%)
- Construction and extraction occupations (16%)
- Sales and related occupations (9%)
- Material moving occupations (9%)
- Installation, maintenance, and repair occupations (8%)
- Building and grounds cleaning and maintenance occupations (7%)
- Management occupations (7%)
- Production occupations (5%)
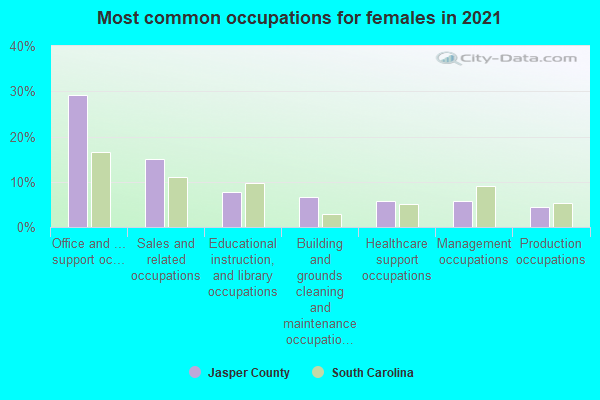
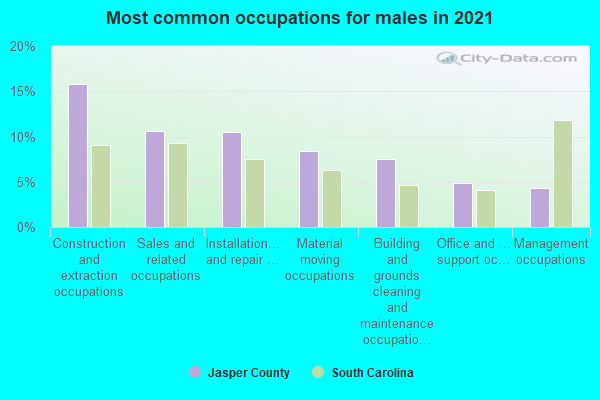
- Office and administrative support occupations (30%)
- Sales and related occupations (13%)
- Educational instruction, and library occupations (9%)
- Building and grounds cleaning and maintenance occupations (8%)
- Healthcare support occupations (5%)
- Management occupations (5%)
- Food preparation and serving related occupations (5%)
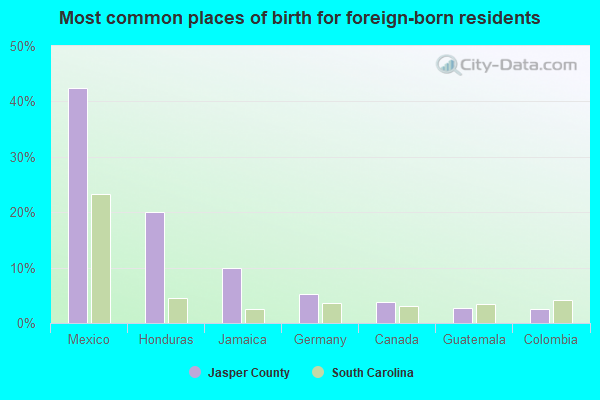
- Mexico (36%)
- Honduras (14%)
- Germany (7%)
- Jamaica (7%)
- Canada (5%)
- Cuba (4%)
- Guatemala (4%)
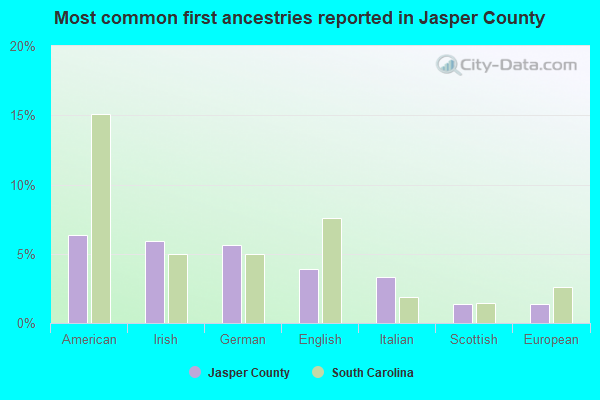
- American (8%)
- German (7%)
- Irish (6%)
- English (4%)
- Italian (3%)
- European (1%)
- French Canadian (1%)
People in group quarters in Jasper County, South Carolina in 2010:
- 1,294 people in state prisons
- 85 people in nursing facilities/skilled-nursing facilities
- 73 people in local jails and other municipal confinement facilities
- 26 people in group homes intended for adults
- 10 people in residential treatment centers for adults
People in group quarters in Jasper County, South Carolina in 2000:
- 1,203 people in state prisons
- 90 people in nursing homes
- 37 people in local jails and other confinement facilities (including police lockups)
- 11 people in homes for the mentally ill
- 6 people in other noninstitutional group quarters
15.45% of this county's 2021 resident taxpayers lived in other counties in 2020 ($74,696 average adjusted gross income)
| Here: | 15.45% |
| South Carolina average: | 8.89% |
10 or fewer of this county's residents moved from foreign countries.
7.04% relocated from other counties in South Carolina ($23,239 average AGI)
8.41% relocated from other states ($51,456 average AGI)
Jasper County: 8.41% South Carolina average: 4.96%
Top counties from which taxpayers relocated into this county between 2020 and 2021:
| from Beaufort County, SC | |
| from Chatham County, GA | |
| from Hampton County, SC | |
| from Charleston County, SC | |
| from Richland County, SC | |
| from Suffolk County, NY |
10.21% of this county's 2020 resident taxpayers moved to other counties in 2021 ($50,339 average adjusted gross income)
| Here: | 10.21% |
| South Carolina average: | 7.46% |
10 or fewer of this county's residents moved to foreign countries.
5.23% relocated to other counties in South Carolina ($26,001 average AGI)
4.98% relocated to other states ($24,338 average AGI)
Jasper County: 4.98% South Carolina average: 3.47%
Top counties to which taxpayers relocated from this county between 2020 and 2021:
| to Beaufort County, SC | |
| to Chatham County, GA | |
| to Hampton County, SC | |
| to Effingham County, GA |
Births per 1000 population from 1990 to 1999: 16.5
Births per 1000 population from 2000 to 2006: 15.6
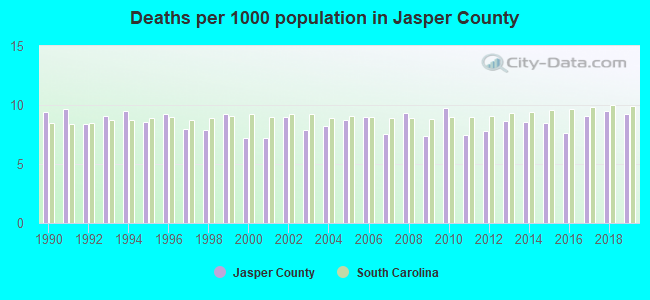
Deaths per 1000 population from 1990 to 1999: 8.9
Deaths per 1000 population from 2000 to 2009: 8.1
Deaths per 1000 population from 2010 to 2020: 8.8
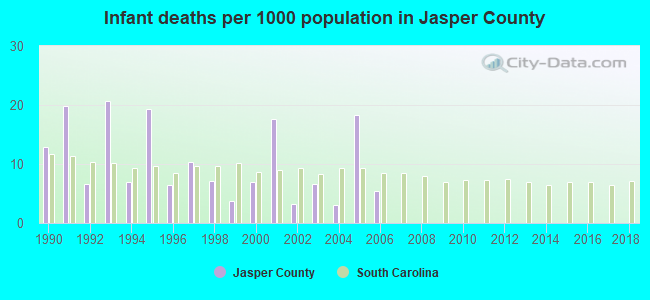
Infant deaths per 1000 live births from 1990 to 1999: 11.4
Infant deaths per 1000 live births from 2000 to 2006: 8.8
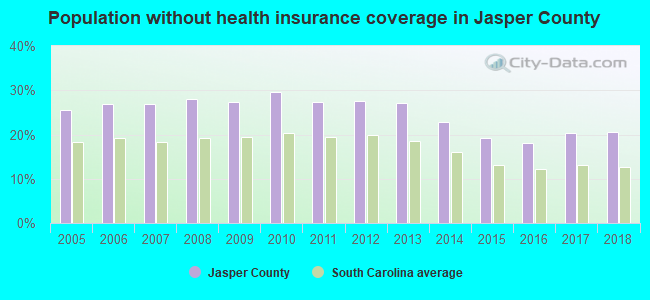
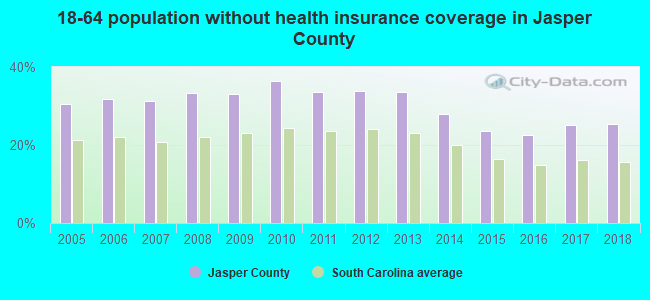
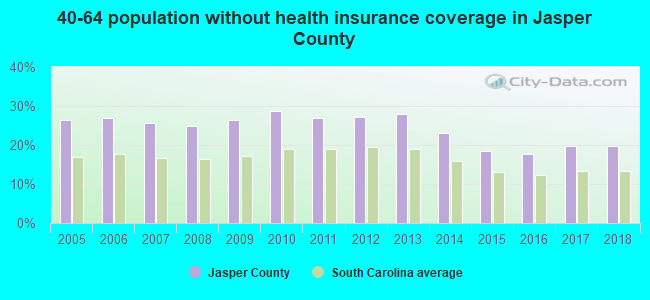
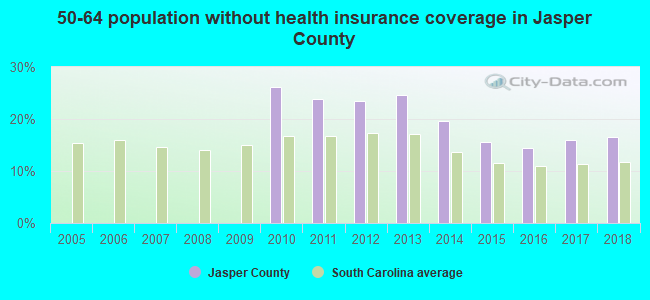
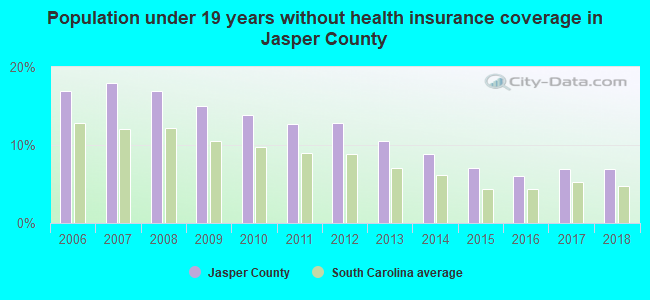
Persons under 19 years old without health insurance coverage in 2018: 6.9%
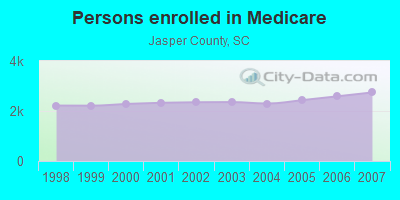
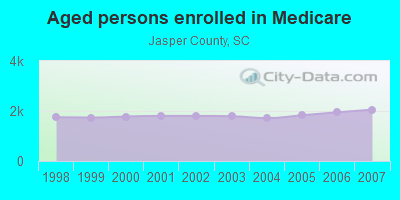
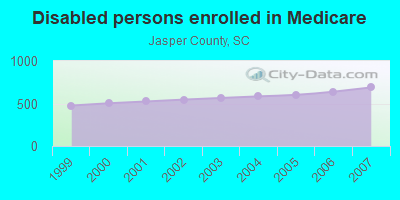
Persons enrolled in hospital insurance and/or supplemental medical insurance (Medicare) in July 1, 2007: 2,743 (2,054 aged, 689 disabled)
Children under 18 without health insurance coverage in 2007: 989 (17%)
Most common underlying causes of death in Jasper County, South Carolina in 1999 - 2019:
- Acute myocardial infarction, unspecified (189)
- Bronchus or lung, unspecified - Malignant neoplasms (175)
- Alzheimer disease, unspecified (58)
- Chronic obstructive pulmonary disease, unspecified (58)
- Atherosclerotic heart disease (36)
- Congestive heart failure (33)
- Other forms of acute ischaemic heart disease (24)
- Stroke, not specified as haemorrhage or infarction (23)
- Heart failure, unspecified (12)
- Assault by other and unspecified firearm discharge (10)
Population without health insurance coverage in 2000: 22%
Children under 18 without health insurance coverage in 2000: 20%
Medical specialist MDs per 100,000 population in 2005: 911
Dentists per 100,000 population in 1998: 14
Total births per 100,000 population, July 2005 - July 2006 : 6
Total deaths per 100,000 population, July 2005 - July 2006: 61
Limited-service eating places per 100,000 population in 2005 : 9
EPA green book nonattainment status in 2004-2006: 1
Crimes per 100,000 population in 1996: 1
Household type by relationship:
Households: 30,244- Male householders: 5,763 (1,590 living alone), Female householders: 6,693 (1,923 living alone)
5,864 spouses (5,778 opposite-sex spouses), 881 unmarried partners, (870 opposite-sex unmarried partners), 6,908 children (6,342 natural, 193 adopted, 376 stepchildren), 1,046 grandchildren, 222 brothers or sisters, 250 parents, 0 foster children, 634 other relatives, 1,159 non-relatives
- In group quarters: 789
Size of family households: 4,865 2-persons, 1,437 3-persons, 1,022 4-persons, 497 5-persons, 185 6-persons, 151 7-or-more-persons.
Size of nonfamily households: 3,514 1-person, 515 2-persons, 140 3-persons, 179 5-persons.
2,309 married couples with children.
1,724 single-parent households (322 men, 1,402 women).
84.3% of residents of Jasper speak English at home.
12.8% of residents speak Spanish at home (69% speak English very well, 9% speak English well, 9% speak English not well, 12% don't speak English at all).
1.3% of residents speak other Indo-European language at home (87% speak English very well, 7% speak English well, 6% don't speak English at all).
0.5% of residents speak Asian or Pacific Island language at home (80% speak English very well, 4% speak English well, 16% speak English not well).
0.9% of residents speak other language at home (100% speak English very well).
In fiscal year 2004:
Federal Government expenditure: $109,626,000 ($5,173 per capita)
Department of Defense expenditure: $13,057,000
Federal direct payments to individuals for retirement and disability: $38,429,000
Federal other direct payments to individuals: $19,419,000
Federal direct payments not to individuals: $214,000
Federal grants: $38,388,000
Federal procurement contracts: $10,897,000 ($10,282,000 Department of Defense)
Federal salaries and wages: $2,278,000 ($0,000 Department of Defense)
Federal Government direct loans: $369,000
Federal guaranteed/insured loans: $1,986,000
Federal Government insurance: $76,841,000
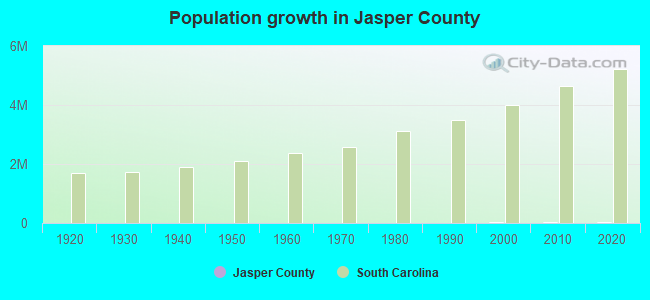
Population change from April 1, 2000 to July 1, 2005:
Births: 1,614| Here: | 75 per 1000 residents |
| State: | 69 per 1000 residents |
Deaths: 843
| Here: | 39 per 1000 residents |
| State: | 46 per 1000 residents |
Net international migration: +563
| Here: | +26 per 1000 residents |
| State: | +9 per 1000 residents |
Net internal migration: -566
| Here: | |
| State: |
Total withdrawal of fresh water for public supply: 1.26 millions of gallons per day (all from ground)
| Here: | 6.1 |
| State: | 6.4 |
| Here: | 4.4 |
| State: | 4.5 |
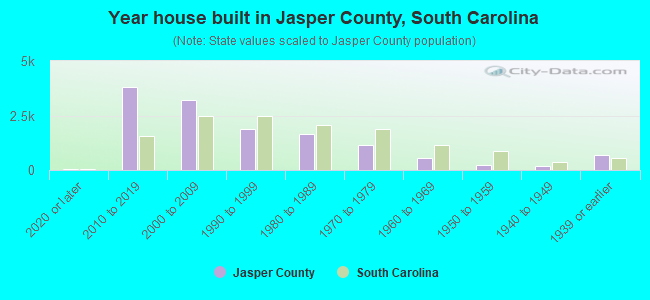
- Year house built in Jasper County, South Carolina
- 3222020 or later
- 4,2002010 to 2019
- 3,3232000 to 2009
- 2,0871990 to 1999
- 1,2071980 to 1989
- 1,1471970 to 1979
- 5391960 to 1969
- 1571950 to 1959
- 1621940 to 1949
- 6051939 or earlier
- Rooms in owner-occupied houses in Jasper County, South Carolina
- 261 room
- 02 rooms
- 2343 rooms
- 1,2244 rooms
- 1,9065 rooms
- 2,2006 rooms
- 1,7317 rooms
- 9428 rooms
- 9969+ rooms
- Rooms in renter-occupied apartments in Jasper County, South Carolina
- 221 room
- 822 rooms
- 6033 rooms
- 1,0684 rooms
- 7445 rooms
- 4046 rooms
- 1687 rooms
- 148 rooms
- 899+ rooms
- Bedrooms in owner-occupied houses in Jasper County, South Carolina
- 43no bedroom
- 381 bedroom
- 2,0172 bedrooms
- 4,9223 bedrooms
- 2,0014 bedrooms
- 2305+ bedrooms
- Bedrooms in renter-occupied apartments in Jasper County, South Carolina
- 33no bedroom
- 6891 bedroom
- 1,3162 bedrooms
- 1,0053 bedrooms
- 974 bedrooms
- 515+ bedrooms
- Cars and other vehicles available in Jasper County in owner-occupied houses/condos
- 282no vehicle
- 3,2941 vehicle
- 3,6522 vehicles
- 1,1313 vehicles
- 6904 vehicles
- 2385+ vehicles
- Cars and other vehicles available in Jasper County in renter-occupied apartments
- 152no vehicle
- 1,6861 vehicle
- 1,1622 vehicles
- 1713 vehicles
- 134 vehicles
- 155+ vehicles
84.0% of Jasper County residents lived in the same house 1 years ago.
Out of people who lived in different houses, 23% lived in this county.
Out of people who lived in different counties, 59% lived in South Carolina.
| Jasper County: | 84.0% |
| State average: | 86.5% |
Place of birth for U.S.-born residents:
- This state: 13,703
- Other state: 13,301
- Northeast: 5,062
- Midwest: 1,752
- South: 6,091
- West: 357
- 70.2%Electricity
- 22.2%Utility gas
- 6.1%Bottled, tank, or LP gas
- 1.6%No fuel used
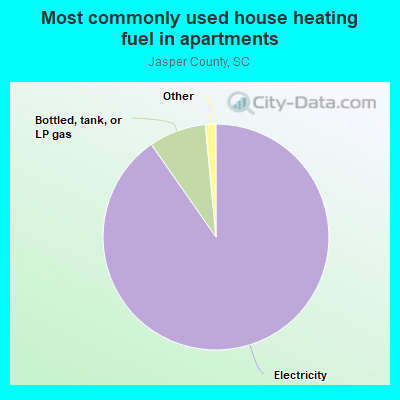
- 91.8%Electricity
- 6.9%Bottled, tank, or LP gas
- 0.6%Utility gas
- 0.6%No fuel used
Private vs. public school enrollment:
| Here: | 27.4% |
| South Carolina: | 14.4% |
| Here: | 17.0% |
| South Carolina: | 11.1% |
| Here: | 18.5% |
| South Carolina: | 21.9% |
Jasper County government finances - Expenditure in 2018:
- Charges - Other: $2,258,000
Parks and Recreation: $32,000
- Construction - Housing and Community Development: $69,000
Air Transportation: $15,000
- Current Operations - Local Fire Protection: $7,005,000
Central Staff Services: $5,865,000
Police Protection: $4,307,000
Correctional Institutions: $3,198,000
General - Other: $2,868,000
Financial Administration: $1,393,000
Judicial and Legal Services: $1,341,000
General Public Buildings: $914,000
Solid Waste Management: $857,000
Regular Highways: $679,000
Parks and Recreation: $562,000
Health - Other: $50,000
Housing and Community Development: $30,000
Libraries: $20,000
Natural Resources - Other: $3,000
- Federal Intergovernmental - Air Transportation: $3,387,000
Other: $90,000
Sewerage: $29,000
- General - Interest on Debt: $888,000
- Intergovernmental to Local - Other - Local Fire Protection: $194,000
Other - Libraries: $70,000
- Long Term Debt - Beginning Outstanding - Unspecified Public Purpose: $20,622,000
Outstanding Unspecified Public Purpose: $19,585,000
Retired Unspecified Public Purpose: $1,362,000
Issue, Unspecified Public Purpose: $325,000
- Miscellaneous - General Revenue - Other: $3,665,000
Fines and Forfeits: $584,000
Interest Earnings: $40,000
Rents: $3,000
- Other Capital Outlay - Regular Highways: $804,000
- Other Funds - Cash and Securities: $46,821,000
- Short Term Debt Outstanding - End of Fiscal Year: $571,000
Beginning: $569,000
- Sinking Funds - Cash and Securities: $1,730,000
- State Intergovernmental - Highways: $751,000
Other: $69,000
- Tax - Property: $19,120,000
General Sales and Gross Receipts: $6,771,000
Other Selective Sales: $744,000
- Total Salaries and Wages: $9,320,000
Jasper County government finances - Revenue in 2018:
- Charges - Other: $2,258,000
Parks and Recreation: $32,000
- Construction - Housing and Community Development: $69,000
Air Transportation: $15,000
- Current Operations - Local Fire Protection: $7,005,000
Central Staff Services: $5,865,000
Police Protection: $4,307,000
Correctional Institutions: $3,198,000
General - Other: $2,868,000
Financial Administration: $1,393,000
Judicial and Legal Services: $1,341,000
General Public Buildings: $914,000
Solid Waste Management: $857,000
Regular Highways: $679,000
Parks and Recreation: $562,000
Health - Other: $50,000
Housing and Community Development: $30,000
Libraries: $20,000
Natural Resources - Other: $3,000
- Federal Intergovernmental - Air Transportation: $3,387,000
Other: $90,000
Sewerage: $29,000
- General - Interest on Debt: $888,000
- Intergovernmental to Local - Other - Local Fire Protection: $194,000
Other - Libraries: $70,000
- Long Term Debt - Beginning Outstanding - Unspecified Public Purpose: $20,622,000
Outstanding Unspecified Public Purpose: $19,585,000
Retired Unspecified Public Purpose: $1,362,000
Issue, Unspecified Public Purpose: $325,000
- Miscellaneous - General Revenue - Other: $3,665,000
Fines and Forfeits: $584,000
Interest Earnings: $40,000
Rents: $3,000
- Other Capital Outlay - Regular Highways: $804,000
- Other Funds - Cash and Securities: $46,821,000
- Short Term Debt Outstanding - End of Fiscal Year: $571,000
Beginning: $569,000
- Sinking Funds - Cash and Securities: $1,730,000
- State Intergovernmental - Highways: $751,000
Other: $69,000
- Tax - Property: $19,120,000
General Sales and Gross Receipts: $6,771,000
Other Selective Sales: $744,000
- Total Salaries and Wages: $9,320,000
Jasper County government finances - Debt in 2018:
- Charges - Other: $2,258,000
Parks and Recreation: $32,000
- Construction - Housing and Community Development: $69,000
Air Transportation: $15,000
- Current Operations - Local Fire Protection: $7,005,000
Central Staff Services: $5,865,000
Police Protection: $4,307,000
Correctional Institutions: $3,198,000
General - Other: $2,868,000
Financial Administration: $1,393,000
Judicial and Legal Services: $1,341,000
General Public Buildings: $914,000
Solid Waste Management: $857,000
Regular Highways: $679,000
Parks and Recreation: $562,000
Health - Other: $50,000
Housing and Community Development: $30,000
Libraries: $20,000
Natural Resources - Other: $3,000
- Federal Intergovernmental - Air Transportation: $3,387,000
Other: $90,000
Sewerage: $29,000
- General - Interest on Debt: $888,000
- Intergovernmental to Local - Other - Local Fire Protection: $194,000
Other - Libraries: $70,000
- Long Term Debt - Beginning Outstanding - Unspecified Public Purpose: $20,622,000
Outstanding Unspecified Public Purpose: $19,585,000
Retired Unspecified Public Purpose: $1,362,000
Issue, Unspecified Public Purpose: $325,000
- Miscellaneous - General Revenue - Other: $3,665,000
Fines and Forfeits: $584,000
Interest Earnings: $40,000
Rents: $3,000
- Other Capital Outlay - Regular Highways: $804,000
- Other Funds - Cash and Securities: $46,821,000
- Short Term Debt Outstanding - End of Fiscal Year: $571,000
Beginning: $569,000
- Sinking Funds - Cash and Securities: $1,730,000
- State Intergovernmental - Highways: $751,000
Other: $69,000
- Tax - Property: $19,120,000
General Sales and Gross Receipts: $6,771,000
Other Selective Sales: $744,000
- Total Salaries and Wages: $9,320,000
Jasper County government finances - Cash and Securities in 2018:
- Charges - Other: $2,258,000
Parks and Recreation: $32,000
- Construction - Housing and Community Development: $69,000
Air Transportation: $15,000
- Current Operations - Local Fire Protection: $7,005,000
Central Staff Services: $5,865,000
Police Protection: $4,307,000
Correctional Institutions: $3,198,000
General - Other: $2,868,000
Financial Administration: $1,393,000
Judicial and Legal Services: $1,341,000
General Public Buildings: $914,000
Solid Waste Management: $857,000
Regular Highways: $679,000
Parks and Recreation: $562,000
Health - Other: $50,000
Housing and Community Development: $30,000
Libraries: $20,000
Natural Resources - Other: $3,000
- Federal Intergovernmental - Air Transportation: $3,387,000
Other: $90,000
Sewerage: $29,000
- General - Interest on Debt: $888,000
- Intergovernmental to Local - Other - Local Fire Protection: $194,000
Other - Libraries: $70,000
- Long Term Debt - Beginning Outstanding - Unspecified Public Purpose: $20,622,000
Outstanding Unspecified Public Purpose: $19,585,000
Retired Unspecified Public Purpose: $1,362,000
Issue, Unspecified Public Purpose: $325,000
- Miscellaneous - General Revenue - Other: $3,665,000
Fines and Forfeits: $584,000
Interest Earnings: $40,000
Rents: $3,000
- Other Capital Outlay - Regular Highways: $804,000
- Other Funds - Cash and Securities: $46,821,000
- Short Term Debt Outstanding - End of Fiscal Year: $571,000
Beginning: $569,000
- Sinking Funds - Cash and Securities: $1,730,000
- State Intergovernmental - Highways: $751,000
Other: $69,000
- Tax - Property: $19,120,000
General Sales and Gross Receipts: $6,771,000
Other Selective Sales: $744,000
- Total Salaries and Wages: $9,320,000
Supplemental Security Income (SSI) in 2006:
- Total number of recipients: 671
- Number of aged recipients: 95
- Number of blind and disabled recipients: 576
- Number of recipients under 18: 128
- Number of recipients between 18 and 64: 354
- Number of recipients older than 64: 189
- Number of recipients also receiving OASDI: 291
- Amount of payments (thousands of dollars): 296
| Most common first names in Jasper County, SC among deceased individuals | ||
| Name | Count | Lived (average) |
|---|---|---|
| James | 110 | 71.8 years |
| William | 85 | 72.4 years |
| Mary | 75 | 72.1 years |
| John | 75 | 73.6 years |
| Willie | 63 | 75.4 years |
| Robert | 52 | 68.9 years |
| Joseph | 46 | 69.7 years |
| Henry | 38 | 72.4 years |
| Charles | 37 | 68.5 years |
| George | 33 | 72.3 years |
| Most common last names in Jasper County, SC among deceased individuals | ||
| Last name | Count | Lived (average) |
|---|---|---|
| Smith | 84 | 73.8 years |
| Williams | 74 | 70.6 years |
| Brown | 67 | 71.9 years |
| Jones | 50 | 75.1 years |
| Cooler | 49 | 71.0 years |
| Simmons | 45 | 70.5 years |
| Malphrus | 44 | 73.2 years |
| Woods | 41 | 78.0 years |
| Jenkins | 41 | 71.9 years |
| Johnson | 40 | 72.0 years |
| Businesses in Jasper County, SC | ||||
| Name | Count | Name | Count | |
|---|---|---|---|---|
| Advance Auto Parts | 1 | H&R Block | 1 | |
| Best Western | 1 | KFC | 1 | |
| Comfort Inn | 1 | MasterBrand Cabinets | 3 | |
| Cricket Wireless | 1 | Penske | 1 | |
| Curves | 1 | Pizza Hut | 1 | |
| Dairy Queen | 1 | Quality | 1 | |
| Days Inn | 1 | Rite Aid | 1 | |
| Decora Cabinetry | 2 | Subway | 1 | |
| FedEx | 4 | U-Haul | 1 | |
| GNC | 1 | UPS | 2 | |
| Goodwill | 1 | Waffle House | 1 | |