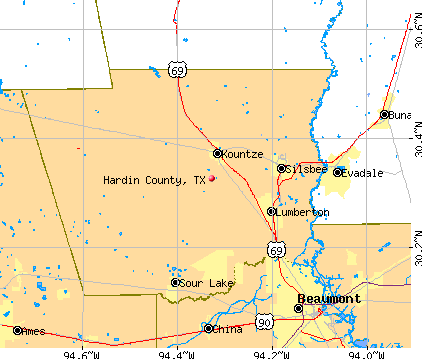
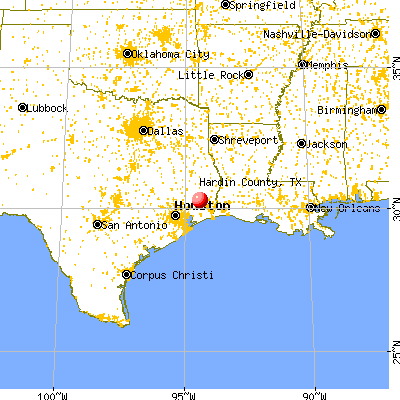
Hardin County, Texas (TX)
County owner-occupied free and clear houses and condos in 2010: 8,046
County owner-occupied houses and condos in 2000: 14,694
Renter-occupied apartments: 4,033 (it was 3,111 in 2000)
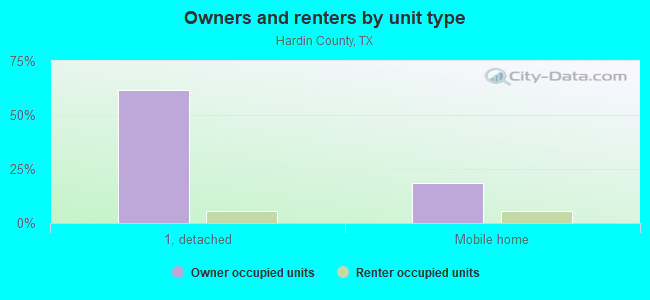
| % of renters here: | 17% |
| State: | 36% |
Land area: 894 sq. mi.
Water area: 3.0 sq. mi.
Population density: 65 people per square mile (average).
Industries providing employment: Educational, health and social services (20.8%), Retail trade (14.0%), Manufacturing (13.3%), Construction (11.4%).
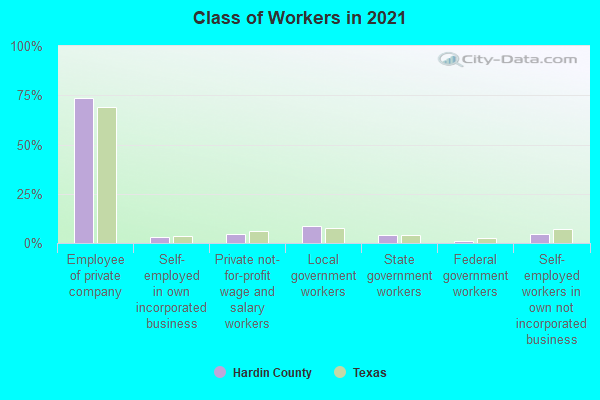
Type of workers:
- Private wage or salary: 82%
- Government: 13%
- Self-employed, not incorporated: 5%
- Unpaid family work: 0%
- OSM Map
- General Map
- Google Map
- MSN Map

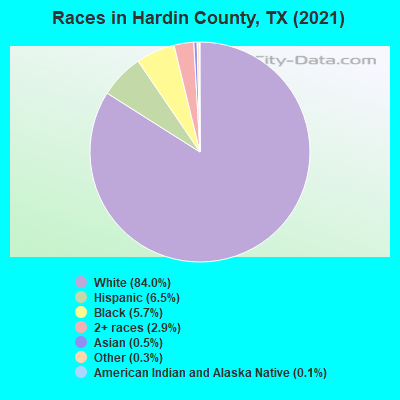
- 47,33982.9%White Non-Hispanic Alone
- 3,8226.7%Hispanic or Latino
- 3,2685.7%Black Non-Hispanic Alone
- 2,2754.0%Two or more races
- 2820.5%Asian alone
- 1080.2%Some other race alone
- 100.02%American Indian and Alaska Native alone
| Median resident age: | 39.8 years |
| Texas median age: | 35.6 years |
| Males: 28,478 | |
| Females: 29,619 |

 | Texas Road Trip (Explore TX) (45 replies) |
| How about we rank the road-trip destinations from Houston? (6 hours or less) (23 replies) |
| Beaumont area (14 replies) |
| We'd Like Some Information On Beaumont (45 replies) |
| New County Population Estimates from the Census Bureau for Jluy 1, 2016 posted this morning about 9 A. M. (13 replies) |
| Texas Trivia (1626 replies) |
| Hardin County: | 2.0 people |
| Texas: | 3 people |
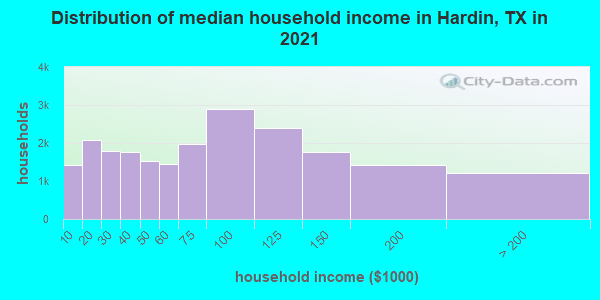
Estimated median household income in 2022: $69,442 ($37,612 in 1999)
| This county: | $69,442 |
| Texas: | $72,284 |
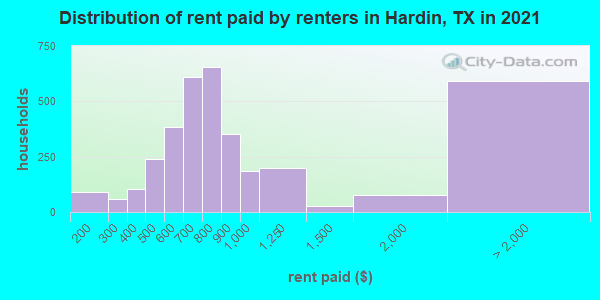
Median contract rent in 2022 for apartments: $775 (lower quartile is $639, upper quartile is $906)
| This county: | $775 |
| State: | $1117 |
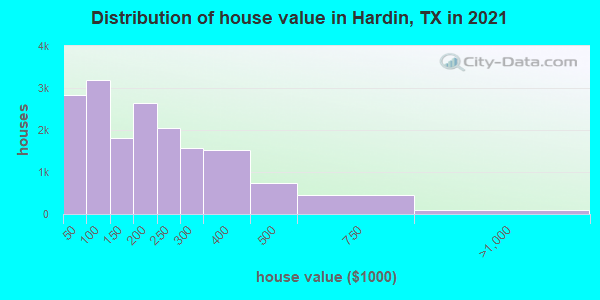
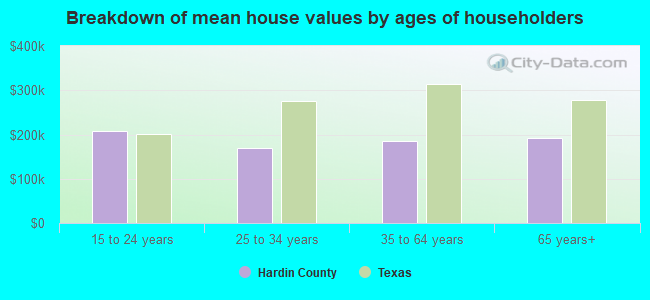
Estimated median house or condo value in 2022: $203,426 (it was $62,100 in 2000)
| Hardin: | $203,426 |
| Texas: | $275,400 |
Median monthly housing costs for homes and condos with a mortgage: $1,482
Median monthly housing costs for units without a mortgage: $488
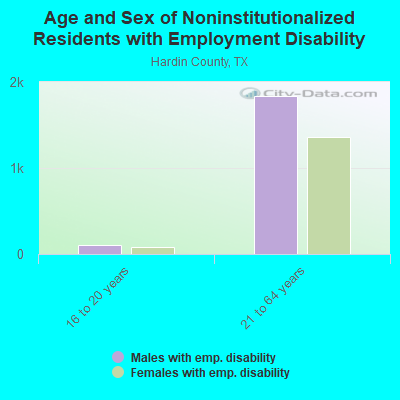
Institutionalized population: 354
Crime in 2021 (reported by the sheriff's office or county police, not the county total):
- Murders: 0
- Rapes: 21
- Robberies: 3
- Assaults: 20
- Burglaries: 71
- Thefts: 114
- Auto thefts: 59
Crime in 2020 (reported by the sheriff's office or county police, not the county total):
- Murders: 1
- Rapes: 8
- Robberies: 3
- Assaults: 17
- Burglaries: 91
- Thefts: 96
- Auto thefts: 62
Health of residents in Hardin County based on CDC Behavioral Risk Factor Surveillance System Survey Questionnaires from 2013 to 2021:
General health status score of residents in this county from 1 (poor) to 5 (excellent) is 3.2. This is significantly worse than average.62.3% of residents exercised in the past month. This is less than average.
44.4% of residents smoked 100+ cigarettes in their lives. This is about average.
44.0% of adult residents drank alcohol in the past 30 days. This is less than average.
Average weight of males is 205 pounds. This is more than average.
Average weight of females is 169 pounds. This is more than average.
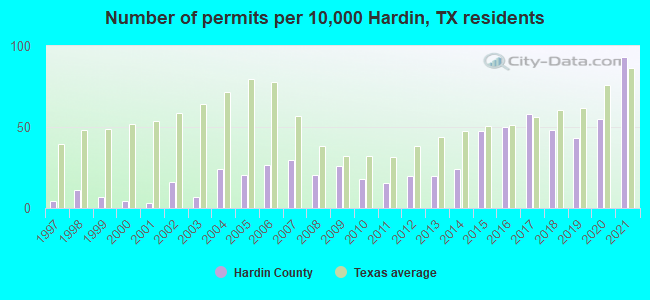
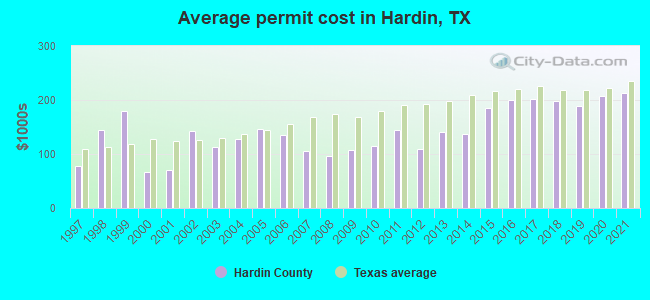
Single-family new house construction building permits:
- 2022: 508 buildings, average cost: $235,400
- 2021: 449 buildings, average cost: $212,800
- 2020: 263 buildings, average cost: $208,200
- 2019: 208 buildings, average cost: $187,600
- 2018: 230 buildings, average cost: $198,700
- 2017: 278 buildings, average cost: $201,600
- 2016: 240 buildings, average cost: $199,500
- 2015: 229 buildings, average cost: $185,600
- 2014: 117 buildings, average cost: $136,900
- 2013: 96 buildings, average cost: $140,100
- 2012: 94 buildings, average cost: $109,100
- 2011: 73 buildings, average cost: $145,200
- 2010: 87 buildings, average cost: $115,000
- 2009: 126 buildings, average cost: $107,700
- 2008: 97 buildings, average cost: $96,200
- 2007: 141 buildings, average cost: $105,900
- 2006: 129 buildings, average cost: $134,700
- 2005: 98 buildings, average cost: $146,300
- 2004: 115 buildings, average cost: $127,500
- 2003: 32 buildings, average cost: $112,900
- 2002: 77 buildings, average cost: $141,900
- 2001: 16 buildings, average cost: $69,900
- 2000: 21 buildings, average cost: $65,900
- 1999: 33 buildings, average cost: $179,900
- 1998: 54 buildings, average cost: $144,600
- 1997: 21 buildings, average cost: $77,300
Median real estate property taxes paid for housing units with mortgages in 2022: $2,704 (1.2%)
Median real estate property taxes paid for housing units with no mortgage in 2022: $1,424 (1.0%)
| Hardin County: | 13.5% |
| Texas: | 14.0% |
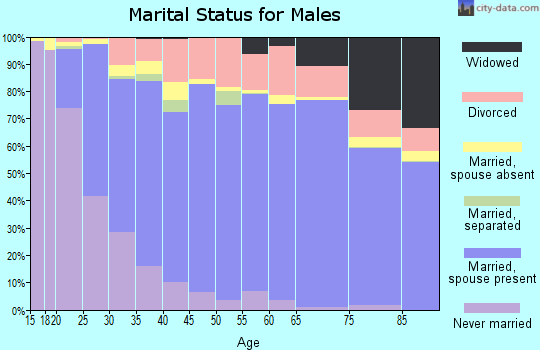
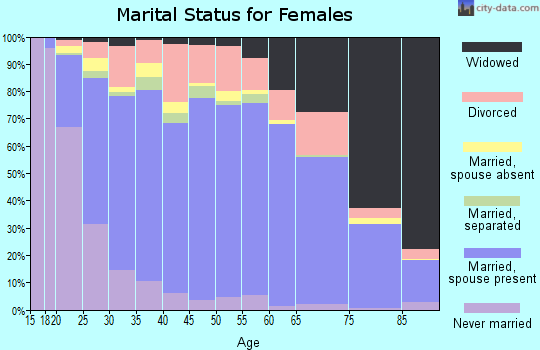
Median age of residents in 2022: 39.8 years old
(Males: 39.3 years old, Females: 40.3 years old)
(Median age for: White residents: 41.1 years old, Black residents: 34.8 years old, American Indian residents: 26.1 years old, Asian residents: 31.4 years old, Hispanic or Latino residents: 30.6 years old, Other race residents: 17.4 years old)
Area name: Beaumont-Port Arthur, TX MSA
Fair market rent in 2006 for a 1-bedroom apartment in Hardin County is $477 a month.
Fair market rent for a 2-bedroom apartment is $570 a month.
Fair market rent for a 3-bedroom apartment is $707 a month.
Cities in this county include: Chance-Loeb, Lumberton, Silsbee, Saratoga-Batson, Kountze, Sour Lake, Pinewood Estates, Rose Hill Acres.
Notable locations in this county outside city limits:
Notable locations in Hardin County: West Ranch (A), Circle Bar Ranch (B), Dead Mans Ford (C), Deike Ranch (D), Harvey Ranch (E), Hereford Hills Ranch (F), Kilborn Ranch (G), Peese Ranch (H), Robinson Community Hall (I), Rocky Creek Ranch (J), Voyles Lazy V Ranch (K), WE Four Ranch (L), Duval County Library (M), Happy Old Folks Home (N), Round Mountain Stage-Coach Inn and Stable (O). Display/hide their locations on the map
Churches in Hardin County include: Rocky Community Church (A), Saint Mary Church (B), Mount Horebe Church (C), Walnut Hill Church (D). Display/hide their locations on the map
Cemeteries: Miller Creek Cemetery (1), Henly Cemetery (2), Davis Cemetery (3), Wegner Cemetery (4), Round Mountain Cemetery (5), Payton Cemetery (6), Comanche Cemetery (7). Display/hide their locations on the map
Lakes and reservoirs: Mustang Lake (A), Taylor Lake (B), Lake Johnson City (C), Wayne Smith Lake (D), Soil Conservation Service Site 1 Reservoir (E), Tatum Lake (F). Display/hide their locations on the map
Streams, rivers, and creeks: Blasingame Creek (A), Yeager Creek (B), Williams Creek (C), Walker Branch (D), Turkey Creek (E), Town Creek (F), Towhead Creek (G), Sycamore Creek (H), Smith Spring Branch (I). Display/hide their locations on the map
Park in Hardin County: Pedernales Falls State Park (1). Display/hide its location on the map
Neighboring counties: Cameron Parish, Louisiana  , Blanco County
  , Lafayette Parish, Louisiana
  , Union County, Florida , West Feliciana Parish, Louisiana , Mason County , Presidio County .
| Here: | 4.3% |
| Texas: | 3.5% |
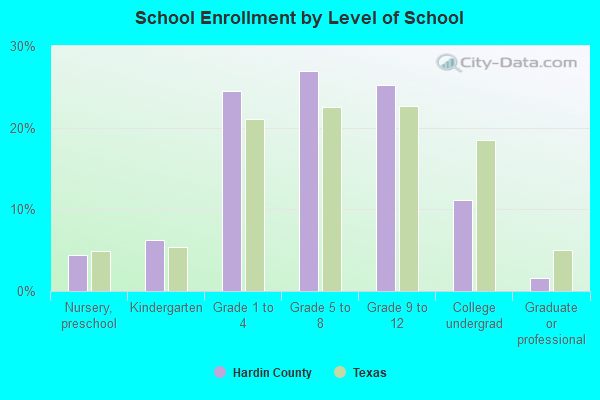
Current college students: 1,418
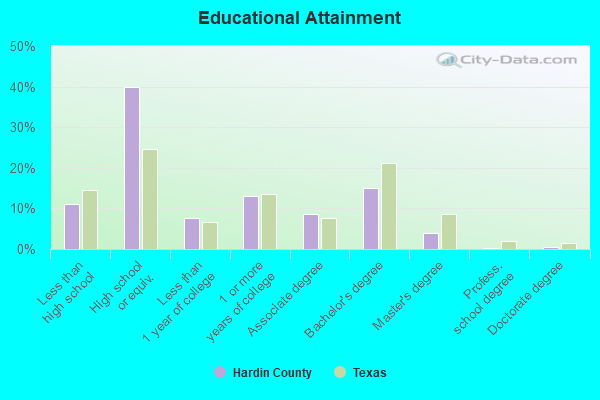
People 25 years of age or older with a high school degree or higher: 88.9%
People 25 years of age or older with a bachelor's degree or higher: 18.5%
Number of foreign born residents: 1,041 (41.9% naturalized citizens)
| Hardin County: | 1.8% |
| Whole state: | 17.2% |
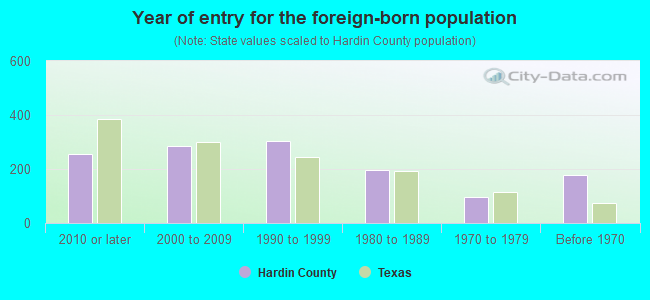
- Year of entry for the foreign-born population
- 2362010 or later
- 2982000 to 2009
- 2511990 to 1999
- 1951980 to 1989
- 981970 to 1979
- 176Before 1970
Mean travel time to work (commute): minutes
Percentage of county residents living and working in this county: 99.2%
Housing units in structures:
- One, detached: 17,293
- One, attached: 108
- Two: 188
- 3 or 4: 113
- 5 to 9: 499
- 10 to 19: 246
- 20 to 49: 166
- 50 or more: 262
- Mobile homes: 5,750
- Boats, RVs, vans, etc.: 427
Housing units in Hardin County with a mortgage: 7,919 (277 second mortgage, 0 home equity loan, 182 both second mortgage and home equity loan)
Houses without a mortgage: 146
| Here: | 4.6% with mortgage |
| State: | 98.4% with mortgage |
Religion statistics for Hardin County
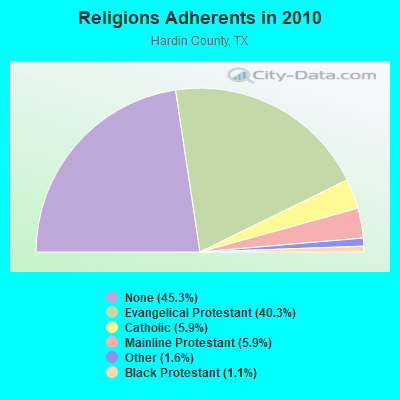
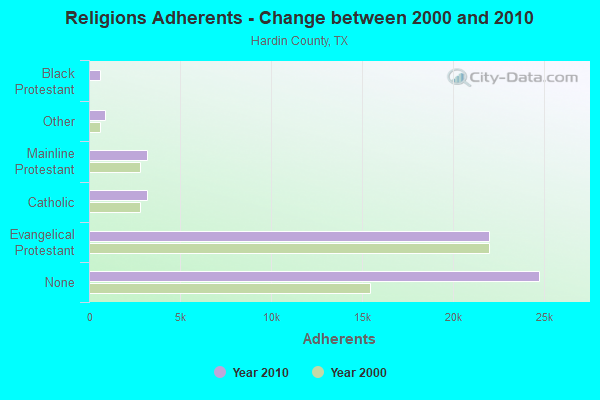
| Religion | Adherents | Congregations |
|---|---|---|
| Evangelical Protestant | 21,993 | 78 |
| Catholic | 3,214 | 4 |
| Mainline Protestant | 3,211 | 8 |
| Other | 852 | 4 |
| Black Protestant | 612 | 5 |
| None | 24,753 | - |
Source: Clifford Grammich, Kirk Hadaway, Richard Houseal, Dale E.Jones, Alexei Krindatch, Richie Stanley and Richard H.Taylor. 2012. 2010 U.S.Religion Census: Religious Congregations & Membership Study. Association of Statisticians of American Religious Bodies. Jones, Dale E., et al. 2002. Congregations and Membership in the United States 2000. Nashville, TN: Glenmary Research Center.
Food Environment Statistics:
| Hardin County: | 2.13 / 10,000 pop. |
| State: | 1.47 / 10,000 pop. |
| This county: | 0.58 / 10,000 pop. |
| Texas: | 1.11 / 10,000 pop. |
| Hardin County: | 5.63 / 10,000 pop. |
| Texas: | 3.95 / 10,000 pop. |
| This county: | 3.30 / 10,000 pop. |
| State: | 6.13 / 10,000 pop. |
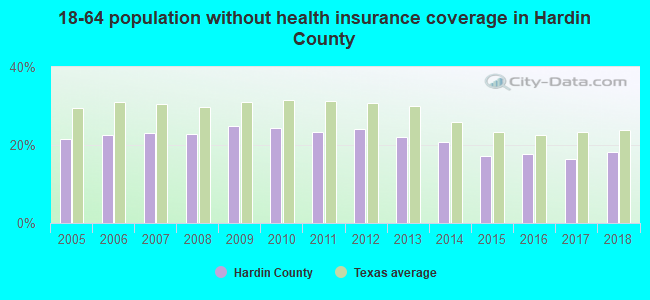
| Hardin County: | 10.6% |
| Texas: | 8.9% |
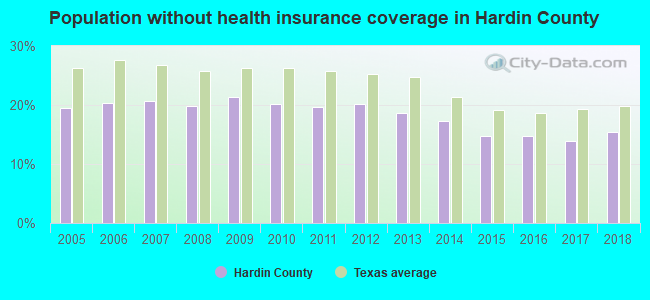
| Hardin County: | 27.9% |
| State: | 26.6% |
| Here: | 13.8% |
| State: | 15.7% |
Agriculture in Hardin County:
Average size of farms: 133 acresAverage total farm production expenses per farm: $10,300
Harvested cropland as a percentage of land in farms: 10.74%
Irrigated harvested cropland as a percentage of land in farms: 12.33%
Average market value of all machinery and equipment per farm: $21,037
The percentage of farms operated by a family or individual: 97.49%
Average age of principal farm operators: 53 years
Average number of cattle and calves per 100 acres of all land in farms: 13.67
Milk cows as a percentage of all cattle and calves: 0.76%
Corn for grain: 7 harvested acres
Vegetables: 35 harvested acres
Land in orchards: 115 acres
Tornado activity:
Hardin County historical area-adjusted tornado activity is significantly below Texas state average. It is 9874779.3 times below overall U.S. average.Tornadoes in this county have caused 20 injuries recorded between 1950 and 2004.
On 8/10/1980, a category 2 (max. wind speeds 113-157 mph) tornado injured 20 people and caused between $5,000,000 and $50,000,000 in damages.
Earthquake activity:
Hardin County-area historical earthquake activity is significantly above Texas state average. It is 34% smaller than the overall U.S. average.On 5/17/2012 at 08:12:00, a magnitude 4.8 (4.8 MW, Depth: 3.1 mi, Class: Light, Intensity: IV - V) earthquake occurred 110.8 miles away from Hardin County center
On 9/2/2013 at 23:51:15, a magnitude 4.3 (4.3 MW, Depth: 2.9 mi) earthquake occurred 109.8 miles away from the county center
On 9/2/2013 at 21:52:38, a magnitude 4.2 (4.2 MW, Depth: 3.0 mi) earthquake occurred 114.1 miles away from the county center
On 1/25/2013 at 07:01:19, a magnitude 4.1 (4.1 MB, Depth: 3.1 mi) earthquake occurred 105.1 miles away from the county center
On 10/20/2011 at 12:24:41, a magnitude 4.8 (4.8 MW, Depth: 3.1 mi) earthquake occurred 247.0 miles away from Hardin County center
On 5/10/2012 at 15:15:38, a magnitude 3.9 (3.9 MW, Depth: 4.3 mi, Class: Light, Intensity: II - III) earthquake occurred 113.7 miles away from the county center
Magnitude types: body-wave magnitude (MB), moment magnitude (MW)
Most recent natural disasters:
- Texas Covid-19 Pandemic, Incident Period: January 20, 2020, FEMA Id: 4485, Natural disaster type: Other
- Texas Hurricane Harvey, Incident Period: August 23, 2017 - September 15, 2017, FEMA Id: 4332, Natural disaster type: Hurricane
- Texas Severe Storms and Flooding, Incident Period: May 22, 2016 to June 24, 2016, Major Disaster (Presidential) Declared DR-4272: June 11, 2016, FEMA Id: 4272, Natural disaster type: Storm, Flood
- Texas Severe Storms, Tornadoes, Straight-line Winds, and Flooding, Incident Period: October 22, 2015 to October 31, 2015, Major Disaster (Presidential) Declared DR-4245: November 25, 2015, FEMA Id: 4245, Natural disaster type: Storm, Tornado, Flood, Wind
- Texas Severe Storms, Tornadoes, Straight-line Winds, and Flooding, Incident Period: May 04, 2015 to June 23, 2015, Major Disaster (Presidential) Declared DR-4223: May 29, 2015, FEMA Id: 4223, Natural disaster type: Storm, Tornado, Flood, Wind
- Texas Hurricane Ike, Incident Period: September 07, 2008 to October 02, 2008, Major Disaster (Presidential) Declared DR-1791: September 13, 2008, FEMA Id: 1791, Natural disaster type: Hurricane
- Texas Hurricane Ike, Incident Period: September 07, 2008 to September 26, 2008, Emergency Declared EM-3294: September 10, 2008, FEMA Id: 3294, Natural disaster type: Hurricane
- Texas Hurricane Gustav, Incident Period: August 27, 2008 to September 07, 2008, Emergency Declared EM-3290: August 29, 2008, FEMA Id: 3290, Natural disaster type: Hurricane
- Texas Wildfires, Incident Period: March 14, 2008 to September 01, 2008, Emergency Declared EM-3284: March 14, 2008, FEMA Id: 3284, Natural disaster type: Fire
- Texas Hurricane Rita, Incident Period: September 23, 2005 to October 14, 2005, Major Disaster (Presidential) Declared DR-1606: September 24, 2005, FEMA Id: 1606, Natural disaster type: Hurricane
- 12 other natural disasters have been reported since 1953.
The number of natural disasters in Hardin County (22) is greater than the US average (15).
Major Disasters (Presidential) Declared: 12
Emergencies Declared: 8
Causes of natural disasters: Floods: 9, Storms: 9, Hurricanes: 7, Tornadoes: 5, Fires: 3, Winds: 2, Tropical Storm: 1, Other: 2 (Note: some incidents may be assigned to more than one category).
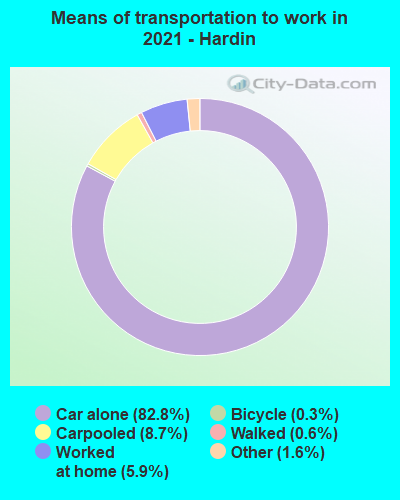
Means of transportation to work:
- Drove a car alone: 11,104 (77.9%)
- Carpooled: 1,236 (8.7%)
- Bus: 8 (0.1%)
- Taxicab, motorcycle, or other means: 270 (1.9%)
- Bicycle: 68 (0.5%)
- Walked: 82 (0.6%)
- Worked at home: 1,243 (8.7%)

- Health care and social assistance (20%)
- Retail trade (12%)
- Educational services (10%)
- Accommodation and food services (9%)
- Professional, scientific, and technical services (4%)
- Construction (3%)
- Finance and insurance (3%)
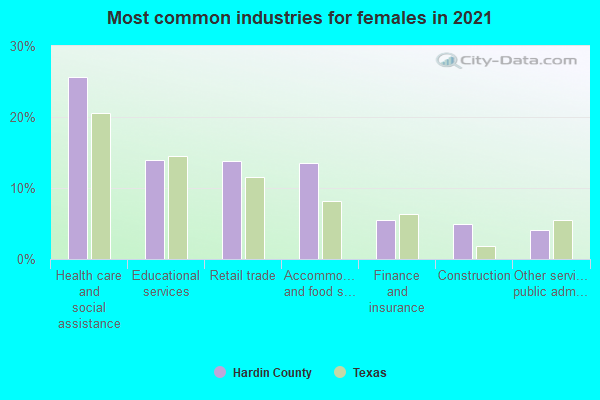
- Health care and social assistance (26%)
- Retail trade (15%)
- Educational services (13%)
- Accommodation and food services (12%)
- Professional, scientific, and technical services (6%)
- Construction (4%)
- Finance and insurance (4%)
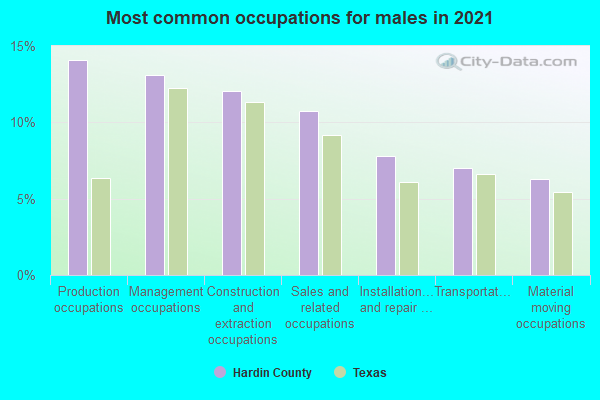
- Production occupations (16%)
- Management occupations (12%)
- Construction and extraction occupations (12%)
- Sales and related occupations (12%)
- Installation, maintenance, and repair occupations (8%)
- Transportation occupations (7%)
- Material moving occupations (5%)
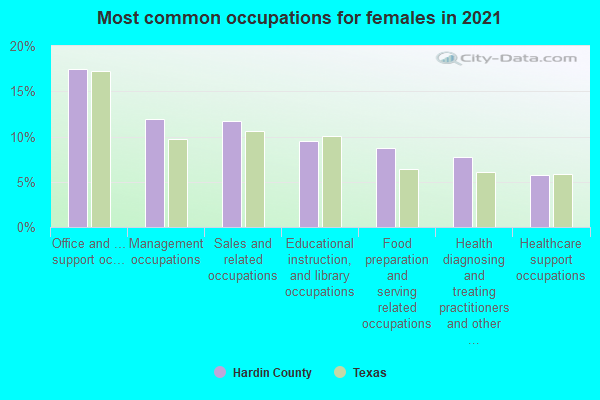
- Office and administrative support occupations (18%)
- Sales and related occupations (12%)
- Management occupations (11%)
- Educational instruction, and library occupations (10%)
- Health diagnosing and treating practitioners and other technical occupations (10%)
- Food preparation and serving related occupations (7%)
- Healthcare support occupations (6%)
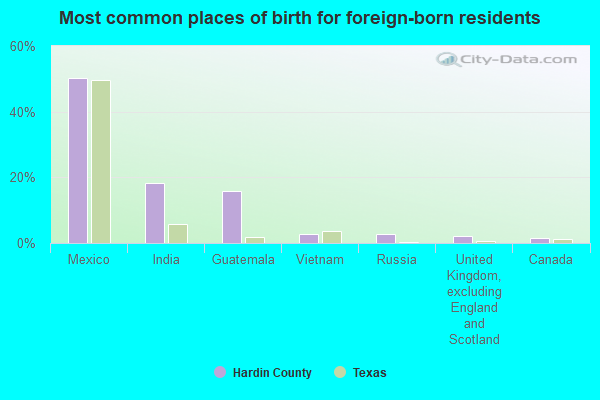
- Mexico (45%)
- Guatemala (17%)
- India (9%)
- Russia (7%)
- Germany (5%)
- Vietnam (4%)
- Philippines (3%)
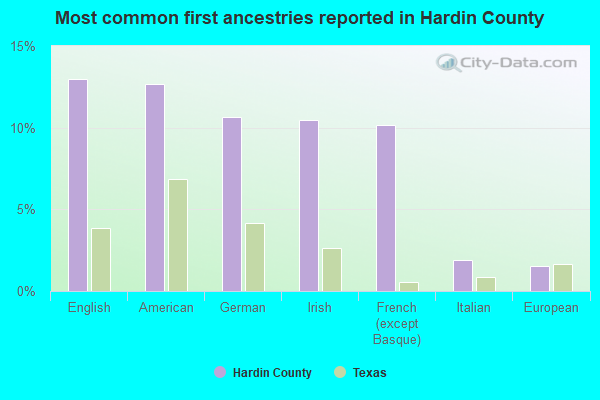
- American (13%)
- English (12%)
- German (11%)
- French (except Basque) (8%)
- Irish (8%)
- Italian (2%)
- European (2%)
People in group quarters in Hardin County, Texas in 2010:
- 351 people in nursing facilities/skilled-nursing facilities
- 18 people in group homes intended for adults
- 8 people in residential treatment centers for adults
- 3 people in correctional facilities intended for juveniles
People in group quarters in Hardin County, Texas in 2000:
- 323 people in nursing homes
- 81 people in local jails and other confinement facilities (including police lockups)
- 12 people in other noninstitutional group quarters
- 6 people in homes for the mentally ill
- 4 people in job corps and vocational training facilities
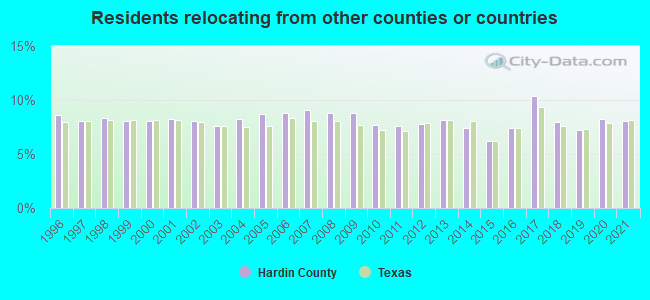
8.03% of this county's 2021 resident taxpayers lived in other counties in 2020 ($60,057 average adjusted gross income)
| Here: | 8.03% |
| Texas average: | 8.12% |
10 or fewer of this county's residents moved from foreign countries.
6.63% relocated from other counties in Texas ($50,067 average AGI)
1.41% relocated from other states ($9,990 average AGI)
Hardin County: 1.41% Texas average: 2.83%
Top counties from which taxpayers relocated into this county between 2020 and 2021:
| from Jefferson County, TX | |
| from Orange County, TX | |
| from Harris County, TX | |
| from Jasper County, TX | |
| from Tyler County, TX | |
| from Liberty County, TX | |
| from Montgomery County, TX |
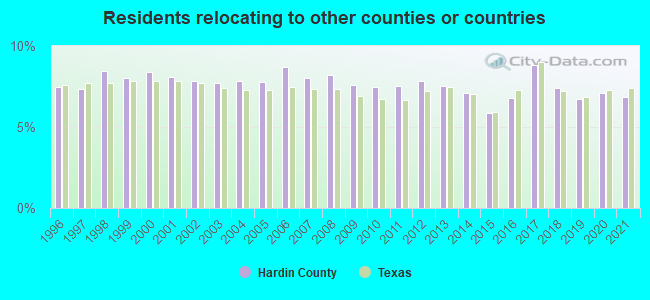
6.84% of this county's 2020 resident taxpayers moved to other counties in 2021 ($61,943 average adjusted gross income)
| Here: | 6.84% |
| Texas average: | 7.40% |
10 or fewer of this county's residents moved to foreign countries.
5.70% relocated to other counties in Texas ($53,019 average AGI)
1.14% relocated to other states ($8,924 average AGI)
Hardin County: 1.14% Texas average: 2.08%
Top counties to which taxpayers relocated from this county between 2020 and 2021:
| to Jefferson County, TX | |
| to Orange County, TX | |
| to Tyler County, TX | |
| to Jasper County, TX | |
| to Harris County, TX | |
| to Liberty County, TX | |
| to Montgomery County, TX |
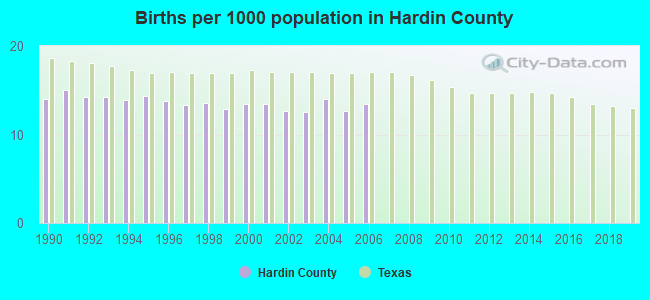
Births per 1000 population from 1990 to 1999: 13.9
Births per 1000 population from 2000 to 2006: 13.1
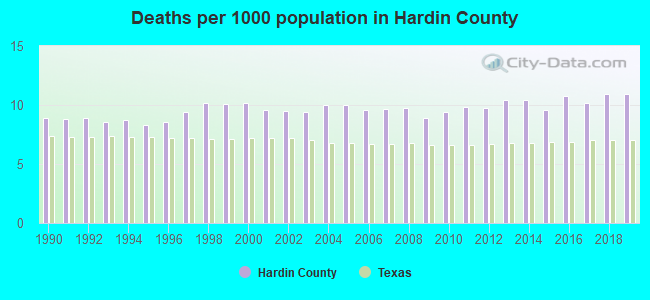
Deaths per 1000 population from 1990 to 1999: 9.1
Deaths per 1000 population from 2000 to 2009: 9.7
Deaths per 1000 population from 2010 to 2020: 10.3
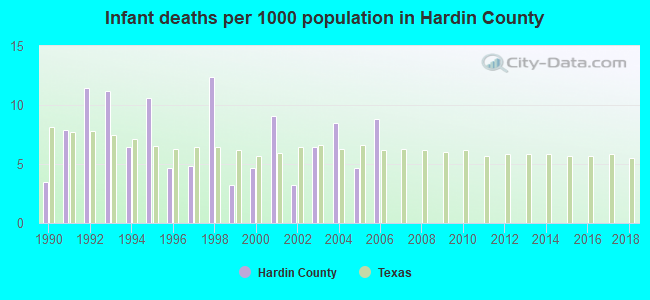
Infant deaths per 1000 live births from 1990 to 1999: 7.6
Infant deaths per 1000 live births from 2000 to 2006: 6.5
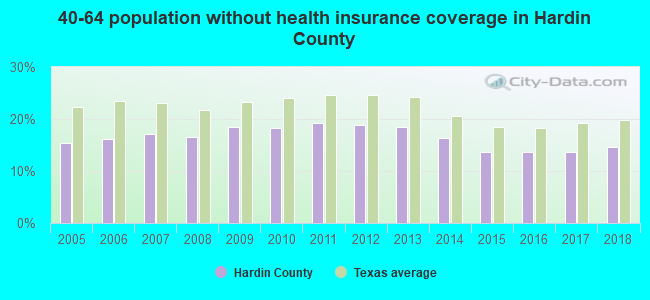
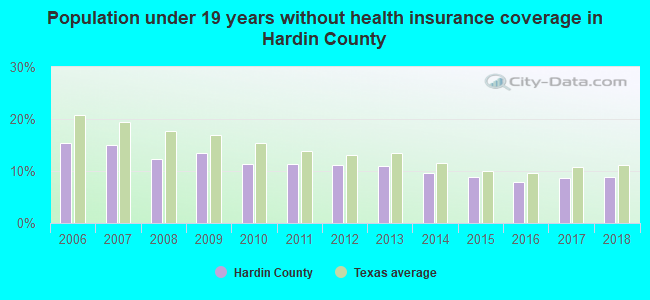
Persons under 19 years old without health insurance coverage in 2018: 8.8%
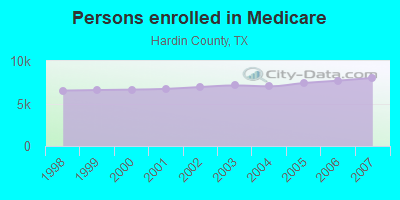
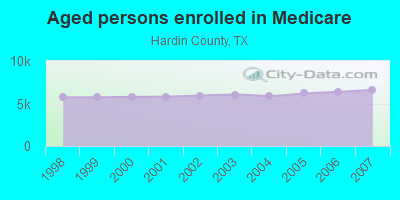
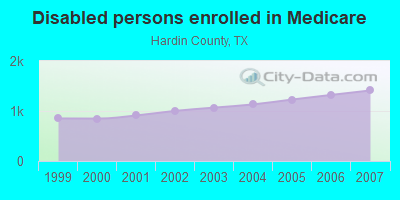
Persons enrolled in hospital insurance and/or supplemental medical insurance (Medicare) in July 1, 2007: 8,013 (6,602 aged, 1,411 disabled)
Children under 18 without health insurance coverage in 2007: 1,874 (14%)
Most common underlying causes of death in Hardin County, Texas in 1999 - 2019:
- Bronchus or lung, unspecified - Malignant neoplasms (740)
- Acute myocardial infarction, unspecified (737)
- Chronic obstructive pulmonary disease, unspecified (674)
- Atherosclerotic heart disease (648)
- Alzheimer disease, unspecified (468)
- Unspecified dementia (404)
- Stroke, not specified as haemorrhage or infarction (325)
- Congestive heart failure (318)
- Heart disease, unspecified (296)
- Unspecified diabetes mellitus, without complications (105)
Population without health insurance coverage in 2000: 14%
Children under 18 without health insurance coverage in 2000: 12%
Medical specialist MDs per 100,000 population in 2005: 1,071
Dentists per 100,000 population in 1998: 6
Total births per 100,000 population, July 2005 - July 2006 : 21
Total deaths per 100,000 population, July 2005 - July 2006: 63
Limited-service eating places per 100,000 population in 2005 : 12
Beer, wine & liquor stores per 100,000 population in 2005: 1
Suicides per 1,000,000 population from 2000 to 2006: 144.6. This is more than state average.
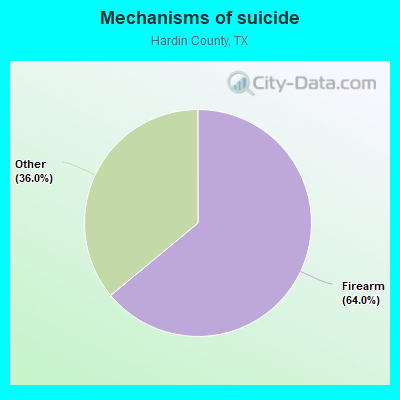
- Firearm - 92.6
- Other - 52.1
Household type by relationship:
Households: 58,097- Male householders: 10,752 (2,546 living alone), Female householders: 11,284 (2,966 living alone)
12,031 spouses (11,816 opposite-sex spouses), 1,043 unmarried partners, (1,032 opposite-sex unmarried partners), 18,068 children (16,383 natural, 407 adopted, 1,280 stepchildren), 1,285 grandchildren, 236 brothers or sisters, 644 parents, 52 foster children, 778 other relatives, 1,484 non-relatives
- In group quarters: 483
Size of family households: 7,562 2-persons, 3,064 3-persons, 2,946 4-persons, 1,688 5-persons, 331 6-persons, 267 7-or-more-persons.
Size of nonfamily households: 5,513 1-person, 550 2-persons, 30 3-persons, 18 4-persons, 31 5-persons.
8,503 married couples with children.
3,827 single-parent households (1,512 men, 2,315 women).
95.5% of residents of Hardin speak English at home.
3.9% of residents speak Spanish at home (58% speak English very well, 23% speak English well, 19% speak English not well).
0.3% of residents speak other Indo-European language at home (92% speak English very well, 8% speak English well).
0.3% of residents speak Asian or Pacific Island language at home (46% speak English very well, 36% speak English well, 15% speak English not well, 3% don't speak English at all).
In fiscal year 2004:
Federal Government expenditure: $228,015,000 ($4,529 per capita)
Department of Defense expenditure: $2,502,000
Federal direct payments to individuals for retirement and disability: $119,442,000
Federal other direct payments to individuals: $65,046,000
Federal direct payments not to individuals: $413,000
Federal grants: $37,829,000
Federal procurement contracts: $971,000 ($9,000 Department of Defense)
Federal salaries and wages: $4,315,000 ($0,000 Department of Defense)
Federal Government direct loans: $106,000
Federal guaranteed/insured loans: $14,271,000
Federal Government insurance: $237,249,000
Population change from April 1, 2000 to July 1, 2005:
Births: 3,319| Here: | 65 per 1000 residents |
| State: | 85 per 1000 residents |
Deaths: 2,496
| Here: | 49 per 1000 residents |
| State: | 35 per 1000 residents |
Net international migration: +57
| Here: | +1 per 1000 residents |
| State: | +29 per 1000 residents |
Net internal migration: +2,089
| Here: | +41 per 1000 residents |
| State: | +10 per 1000 residents |
Total withdrawal of fresh water for public supply: 13.01 millions of gallons per day (all from ground)
| Here: | 6.0 |
| State: | 6.3 |
| Here: | 4.4 |
| State: | 4.0 |
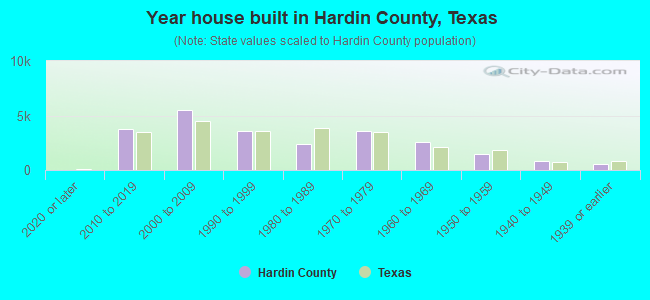
- Year house built in Hardin County, Texas
- 3432020 or later
- 3,8682010 to 2019
- 5,0292000 to 2009
- 3,9541990 to 1999
- 2,4241980 to 1989
- 3,6441970 to 1979
- 2,4481960 to 1969
- 1,4251950 to 1959
- 7601940 to 1949
- 5451939 or earlier
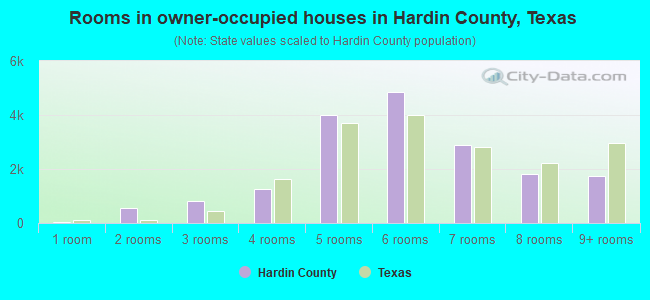
- Rooms in owner-occupied houses in Hardin County, Texas
- 711 room
- 5062 rooms
- 7283 rooms
- 1,4114 rooms
- 4,1855 rooms
- 5,0476 rooms
- 2,8297 rooms
- 1,7318 rooms
- 1,7549+ rooms
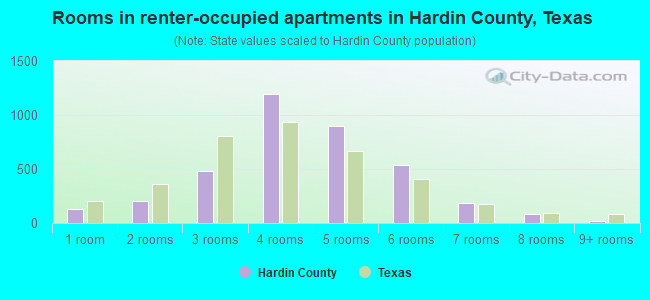
- Rooms in renter-occupied apartments in Hardin County, Texas
- 1311 room
- 1862 rooms
- 3693 rooms
- 1,2884 rooms
- 8455 rooms
- 6156 rooms
- 1977 rooms
- 1048 rooms
- 319+ rooms
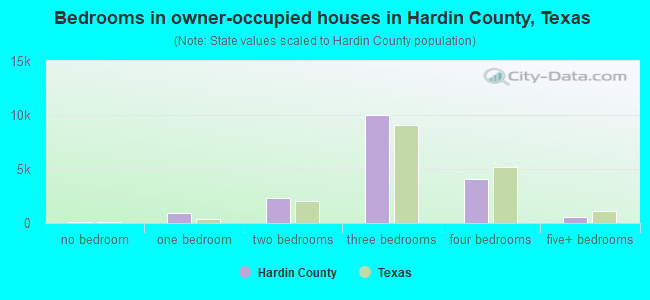
- Bedrooms in owner-occupied houses in Hardin County, Texas
- 79no bedroom
- 7791 bedroom
- 2,3732 bedrooms
- 10,4093 bedrooms
- 3,8344 bedrooms
- 6835+ bedrooms
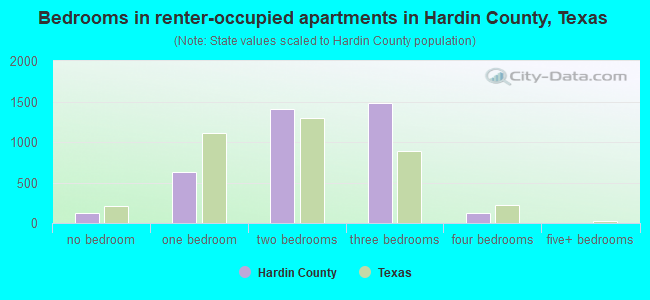
- Bedrooms in renter-occupied apartments in Hardin County, Texas
- 130no bedroom
- 5171 bedroom
- 1,4182 bedrooms
- 1,5223 bedrooms
- 2044 bedrooms
- 05+ bedrooms
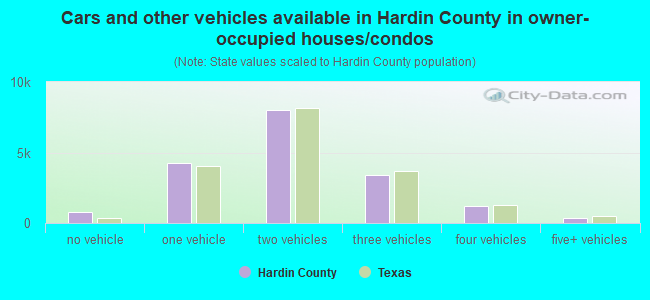
- Cars and other vehicles available in Hardin County in owner-occupied houses/condos
- 773no vehicle
- 4,4101 vehicle
- 7,9012 vehicles
- 3,3783 vehicles
- 1,2854 vehicles
- 4945+ vehicles
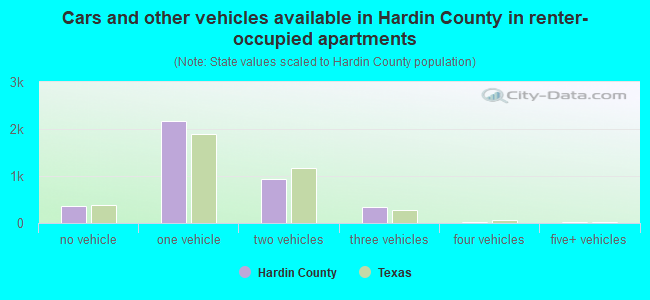
- Cars and other vehicles available in Hardin County in renter-occupied apartments
- 326no vehicle
- 2,2041 vehicle
- 1,0062 vehicles
- 2633 vehicles
- 364 vehicles
- 115+ vehicles
88.4% of Hardin County residents lived in the same house 1 years ago.
Out of people who lived in different houses, 30% lived in this county.
Out of people who lived in different counties, 80% lived in Texas.
| Hardin County: | 88.4% |
| State average: | 85.7% |
Place of birth for U.S.-born residents:
- This state: 45,098
- Other state: 11,197
- Northeast: 1,486
- Midwest: 2,073
- South: 6,011
- West: 1,547

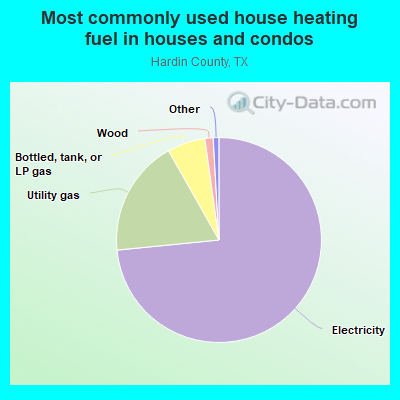
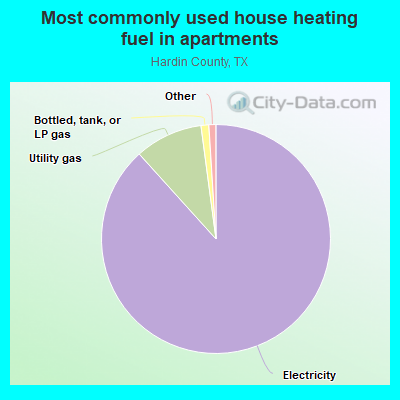
- 74.9%Electricity
- 17.7%Utility gas
- 5.3%Bottled, tank, or LP gas
- 1.4%Wood
- 0.2%Fuel oil, kerosene, etc.
- 0.2%Other fuel
- 0.2%No fuel used
- 88.5%Electricity
- 9.4%Utility gas
- 0.9%Bottled, tank, or LP gas
- 0.6%Wood
- 0.3%Other fuel
- 0.2%No fuel used
Private vs. public school enrollment:
| Here: | 11.3% |
| Texas: | 8.8% |
| Here: | 15.8% |
| Texas: | 8.0% |
| Here: | 8.8% |
| Texas: | 16.2% |
Hardin County government finances - Expenditure in 2017:
- Bond Funds - Cash and Securities: $969,000
- Current Operations - Police Protection: $7,298,000
Police Protection: $5,582,000
Regular Highways: $4,927,000
Judicial and Legal Services: $4,710,000
Regular Highways: $4,472,000
Judicial and Legal Services: $4,430,000
Central Staff Services: $2,927,000
Central Staff Services: $2,333,000
General - Other: $1,638,000
Financial Administration: $1,599,000
Corrections - Other: $1,508,000
Financial Administration: $1,438,000
General - Other: $1,180,000
Public Welfare - Other: $1,008,000
General Public Buildings: $891,000
Public Welfare - Other: $829,000
General Public Buildings: $743,000
Health - Other: $680,000
Health - Other: $618,000
Parks and Recreation: $133,000
Parks and Recreation: $118,000
Correctional Institutions: $35,000
Correctional Institutions: $19,000
Sewerage: $5,000
- Federal Intergovernmental - Other: $1,625,000
- General - Interest on Debt: $60,000
Interest on Debt: $58,000
- Long Term Debt - Outstanding Unspecified Public Purpose: $2,950,000
Beginning Outstanding - Unspecified Public Purpose: $2,395,000
Beginning Outstanding - Unspecified Public Purpose: $2,125,000
Outstanding Unspecified Public Purpose: $2,100,000
Issue, Unspecified Public Purpose: $1,065,000
Retired Unspecified Public Purpose: $295,000
Retired Unspecified Public Purpose: $240,000
- Miscellaneous - Fines and Forfeits: $2,167,000
Fines and Forfeits: $1,726,000
General Revenue - Other: $507,000
Interest Earnings: $248,000
General Revenue - Other: $165,000
Interest Earnings: $22,000
- Other Capital Outlay - General - Other: $262,000
Regular Highways: $135,000
General - Other: $102,000
Public Welfare - Other: $35,000
Judicial and Legal Services: $30,000
- Other Funds - Cash and Securities: $9,655,000
Cash and Securities: $9,183,000
- Sinking Funds - Cash and Securities: $17,000
- State Intergovernmental - Other: $2,885,000
Other: $2,769,000
Health and Hospitals: $679,000
Highways: $37,000
- Tax - Property: $18,186,000
Property: $16,470,000
Other License: $2,045,000
Other License: $1,883,000
Hardin County government finances - Revenue in 2017:
- Bond Funds - Cash and Securities: $969,000
- Current Operations - Police Protection: $7,298,000
Police Protection: $5,582,000
Regular Highways: $4,927,000
Judicial and Legal Services: $4,710,000
Regular Highways: $4,472,000
Judicial and Legal Services: $4,430,000
Central Staff Services: $2,927,000
Central Staff Services: $2,333,000
General - Other: $1,638,000
Financial Administration: $1,599,000
Corrections - Other: $1,508,000
Financial Administration: $1,438,000
General - Other: $1,180,000
Public Welfare - Other: $1,008,000
General Public Buildings: $891,000
Public Welfare - Other: $829,000
General Public Buildings: $743,000
Health - Other: $680,000
Health - Other: $618,000
Parks and Recreation: $133,000
Parks and Recreation: $118,000
Correctional Institutions: $35,000
Correctional Institutions: $19,000
Sewerage: $5,000
- Federal Intergovernmental - Other: $1,625,000
- General - Interest on Debt: $60,000
Interest on Debt: $58,000
- Long Term Debt - Outstanding Unspecified Public Purpose: $2,950,000
Beginning Outstanding - Unspecified Public Purpose: $2,395,000
Beginning Outstanding - Unspecified Public Purpose: $2,125,000
Outstanding Unspecified Public Purpose: $2,100,000
Issue, Unspecified Public Purpose: $1,065,000
Retired Unspecified Public Purpose: $295,000
Retired Unspecified Public Purpose: $240,000
- Miscellaneous - Fines and Forfeits: $2,167,000
Fines and Forfeits: $1,726,000
General Revenue - Other: $507,000
Interest Earnings: $248,000
General Revenue - Other: $165,000
Interest Earnings: $22,000
- Other Capital Outlay - General - Other: $262,000
Regular Highways: $135,000
General - Other: $102,000
Public Welfare - Other: $35,000
Judicial and Legal Services: $30,000
- Other Funds - Cash and Securities: $9,655,000
Cash and Securities: $9,183,000
- Sinking Funds - Cash and Securities: $17,000
- State Intergovernmental - Other: $2,885,000
Other: $2,769,000
Health and Hospitals: $679,000
Highways: $37,000
- Tax - Property: $18,186,000
Property: $16,470,000
Other License: $2,045,000
Other License: $1,883,000
Hardin County government finances - Debt in 2017:
- Bond Funds - Cash and Securities: $969,000
- Current Operations - Police Protection: $7,298,000
Police Protection: $5,582,000
Regular Highways: $4,927,000
Judicial and Legal Services: $4,710,000
Regular Highways: $4,472,000
Judicial and Legal Services: $4,430,000
Central Staff Services: $2,927,000
Central Staff Services: $2,333,000
General - Other: $1,638,000
Financial Administration: $1,599,000
Corrections - Other: $1,508,000
Financial Administration: $1,438,000
General - Other: $1,180,000
Public Welfare - Other: $1,008,000
General Public Buildings: $891,000
Public Welfare - Other: $829,000
General Public Buildings: $743,000
Health - Other: $680,000
Health - Other: $618,000
Parks and Recreation: $133,000
Parks and Recreation: $118,000
Correctional Institutions: $35,000
Correctional Institutions: $19,000
Sewerage: $5,000
- Federal Intergovernmental - Other: $1,625,000
- General - Interest on Debt: $60,000
Interest on Debt: $58,000
- Long Term Debt - Outstanding Unspecified Public Purpose: $2,950,000
Beginning Outstanding - Unspecified Public Purpose: $2,395,000
Beginning Outstanding - Unspecified Public Purpose: $2,125,000
Outstanding Unspecified Public Purpose: $2,100,000
Issue, Unspecified Public Purpose: $1,065,000
Retired Unspecified Public Purpose: $295,000
Retired Unspecified Public Purpose: $240,000
- Miscellaneous - Fines and Forfeits: $2,167,000
Fines and Forfeits: $1,726,000
General Revenue - Other: $507,000
Interest Earnings: $248,000
General Revenue - Other: $165,000
Interest Earnings: $22,000
- Other Capital Outlay - General - Other: $262,000
Regular Highways: $135,000
General - Other: $102,000
Public Welfare - Other: $35,000
Judicial and Legal Services: $30,000
- Other Funds - Cash and Securities: $9,655,000
Cash and Securities: $9,183,000
- Sinking Funds - Cash and Securities: $17,000
- State Intergovernmental - Other: $2,885,000
Other: $2,769,000
Health and Hospitals: $679,000
Highways: $37,000
- Tax - Property: $18,186,000
Property: $16,470,000
Other License: $2,045,000
Other License: $1,883,000
Hardin County government finances - Cash and Securities in 2017:
- Bond Funds - Cash and Securities: $969,000
- Current Operations - Police Protection: $7,298,000
Police Protection: $5,582,000
Regular Highways: $4,927,000
Judicial and Legal Services: $4,710,000
Regular Highways: $4,472,000
Judicial and Legal Services: $4,430,000
Central Staff Services: $2,927,000
Central Staff Services: $2,333,000
General - Other: $1,638,000
Financial Administration: $1,599,000
Corrections - Other: $1,508,000
Financial Administration: $1,438,000
General - Other: $1,180,000
Public Welfare - Other: $1,008,000
General Public Buildings: $891,000
Public Welfare - Other: $829,000
General Public Buildings: $743,000
Health - Other: $680,000
Health - Other: $618,000
Parks and Recreation: $133,000
Parks and Recreation: $118,000
Correctional Institutions: $35,000
Correctional Institutions: $19,000
Sewerage: $5,000
- Federal Intergovernmental - Other: $1,625,000
- General - Interest on Debt: $60,000
Interest on Debt: $58,000
- Long Term Debt - Outstanding Unspecified Public Purpose: $2,950,000
Beginning Outstanding - Unspecified Public Purpose: $2,395,000
Beginning Outstanding - Unspecified Public Purpose: $2,125,000
Outstanding Unspecified Public Purpose: $2,100,000
Issue, Unspecified Public Purpose: $1,065,000
Retired Unspecified Public Purpose: $295,000
Retired Unspecified Public Purpose: $240,000
- Miscellaneous - Fines and Forfeits: $2,167,000
Fines and Forfeits: $1,726,000
General Revenue - Other: $507,000
Interest Earnings: $248,000
General Revenue - Other: $165,000
Interest Earnings: $22,000
- Other Capital Outlay - General - Other: $262,000
Regular Highways: $135,000
General - Other: $102,000
Public Welfare - Other: $35,000
Judicial and Legal Services: $30,000
- Other Funds - Cash and Securities: $9,655,000
Cash and Securities: $9,183,000
- Sinking Funds - Cash and Securities: $17,000
- State Intergovernmental - Other: $2,885,000
Other: $2,769,000
Health and Hospitals: $679,000
Highways: $37,000
- Tax - Property: $18,186,000
Property: $16,470,000
Other License: $2,045,000
Other License: $1,883,000
Supplemental Security Income (SSI) in 2006:
- Total number of recipients: 1,062
- Number of aged recipients: 98
- Number of blind and disabled recipients: 964
- Number of recipients under 18: 196
- Number of recipients between 18 and 64: 673
- Number of recipients older than 64: 193
- Number of recipients also receiving OASDI: 390
- Amount of payments (thousands of dollars): 494
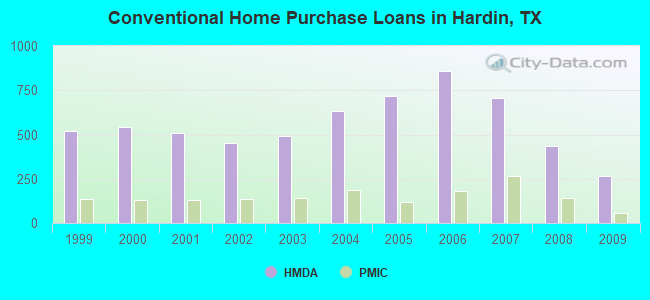
| Home Mortgage Disclosure Act Aggregated Statistics For Year 2009 (Based on 11 full tracts) | ||||||||||||||
| A) FHA, FSA/RHS & VA Home Purchase Loans | B) Conventional Home Purchase Loans | C) Refinancings | D) Home Improvement Loans | E) Loans on Dwellings For 5+ Families | F) Non-occupant Loans on < 5 Family Dwellings (A B C & D) | G) Loans On Manufactured Home Dwelling (A B C & D) | ||||||||
|---|---|---|---|---|---|---|---|---|---|---|---|---|---|---|
| Number | Average Value | Number | Average Value | Number | Average Value | Number | Average Value | Number | Average Value | Number | Average Value | Number | Average Value | |
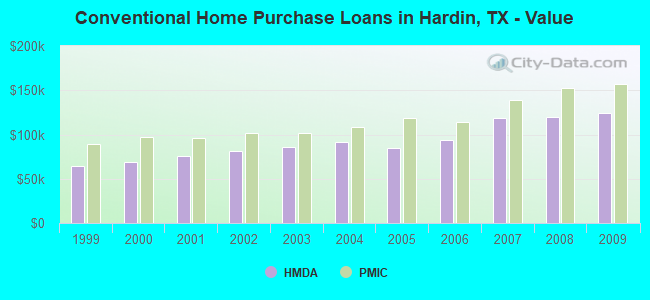
| LOANS ORIGINATED | 217 | $133,161 | 267 | $124,446 | 359 | $142,415 | 61 | $46,869 | 1 | $1,000,000 | 27 | $95,148 | 67 | $50,284 |
| APPLICATIONS APPROVED, NOT ACCEPTED | 22 | $107,773 | 48 | $101,417 | 42 | $116,690 | 15 | $41,800 | 0 | $0 | 2 | $72,000 | 39 | $54,641 |
| APPLICATIONS DENIED | 39 | $131,205 | 120 | $81,983 | 177 | $125,288 | 70 | $32,186 | 0 | $0 | 15 | $99,067 | 90 | $54,111 |
| APPLICATIONS WITHDRAWN | 14 | $139,643 | 20 | $153,500 | 127 | $129,386 | 9 | $73,889 | 0 | $0 | 8 | $62,625 | 4 | $77,250 |
| FILES CLOSED FOR INCOMPLETENESS | 7 | $135,571 | 12 | $78,583 | 24 | $108,542 | 1 | $100,000 | 0 | $0 | 1 | $131,000 | 10 | $56,100 |
| Private Mortgage Insurance Companies Aggregated Statistics For Year 2009 (Based on 11 full tracts) | ||||
| A) Conventional Home Purchase Loans | B) Refinancings | |||
|---|---|---|---|---|
| Number | Average Value | Number | Average Value | |
| LOANS ORIGINATED | 55 | $157,455 | 23 | $190,739 |
| APPLICATIONS APPROVED, NOT ACCEPTED | 14 | $157,071 | 5 | $203,000 |
| APPLICATIONS DENIED | 5 | $145,000 | 7 | $164,429 |
| APPLICATIONS WITHDRAWN | 0 | $0 | 2 | $135,000 |
| FILES CLOSED FOR INCOMPLETENESS | 0 | $0 | 0 | $0 |
| Most common first names in Hardin County, TX among deceased individuals | ||
| Name | Count | Lived (average) |
|---|---|---|
| James | 294 | 70.0 years |
| John | 234 | 73.6 years |
| Mary | 204 | 78.3 years |
| William | 201 | 74.2 years |
| Robert | 167 | 69.5 years |
| George | 127 | 74.9 years |
| Charles | 120 | 68.4 years |
| Thomas | 100 | 71.8 years |
| Willie | 92 | 75.4 years |
| Dorothy | 67 | 74.0 years |
| Most common last names in Hardin County, TX among deceased individuals | ||
| Last name | Count | Lived (average) |
|---|---|---|
| Smith | 152 | 72.8 years |
| Jones | 102 | 75.1 years |
| Williams | 99 | 73.7 years |
| Brown | 80 | 75.4 years |
| Gore | 76 | 75.3 years |
| Johnson | 75 | 76.2 years |
| Davis | 71 | 71.3 years |
| Jordan | 61 | 74.0 years |
| Richardson | 60 | 75.5 years |
| Wilson | 52 | 75.4 years |
| Businesses in Hardin County, TX | ||||
| Name | Count | Name | Count | |
|---|---|---|---|---|
| AT&T | 1 | Little Caesars Pizza | 1 | |
| Ace Hardware | 1 | McDonald's | 3 | |
| Advance Auto Parts | 1 | Nike | 3 | |
| AutoZone | 1 | Nissan | 1 | |
| Blockbuster | 1 | Pizza Hut | 2 | |
| CVS | 2 | Quiznos | 1 | |
| Chevrolet | 2 | SONIC Drive-In | 4 | |
| Cricket Wireless | 1 | Subway | 6 | |
| Curves | 1 | Super 8 | 1 | |
| Dairy Queen | 2 | T-Mobile | 2 | |
| FedEx | 6 | Taco Bell | 2 | |
| GameStop | 1 | U-Haul | 3 | |
| Goodwill | 2 | UPS | 4 | |
| H&R Block | 2 | Waffle House | 1 | |
| Jack In The Box | 2 | Walgreens | 2 | |
| KFC | 1 | Walmart | 2 | |
| La Quinta | 1 | |||