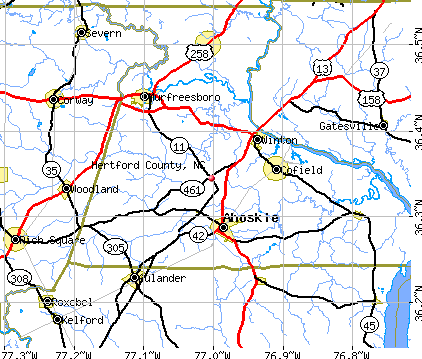
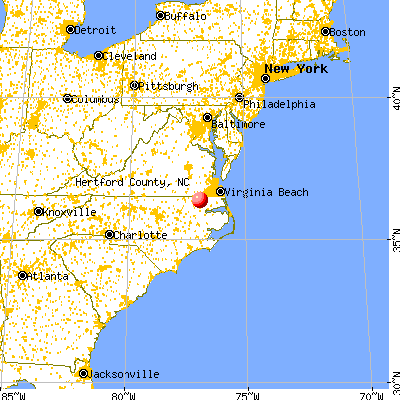
Hertford County, North Carolina (NC)
County owner-occupied free and clear houses and condos in 2010: 2,707
County owner-occupied houses and condos in 2000: 6,270
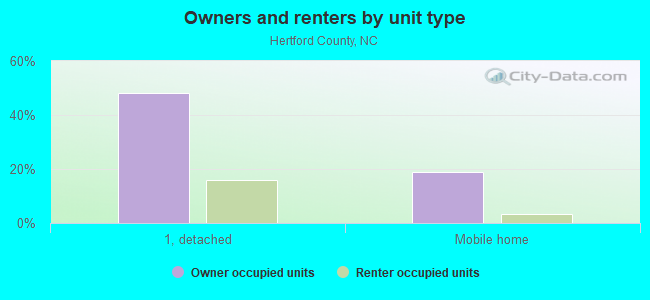
Renter-occupied apartments: 3,083 (it was 2,683 in 2000)
| % of renters here: | 30% |
| State: | 33% |
Land area: 353 sq. mi.
Water area: 7.2 sq. mi.
Population density: 63 people per square mile (average).
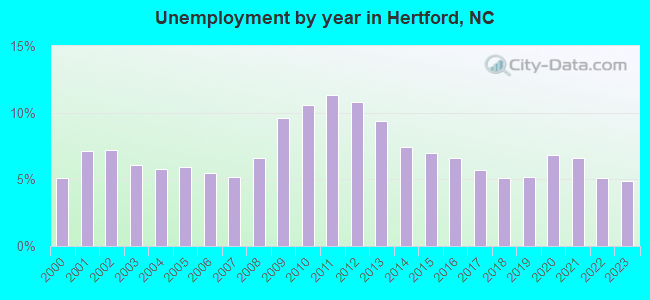
Industries providing employment: Educational, health and social services (27.3%), Manufacturing (16.2%), Retail trade (10.6%).
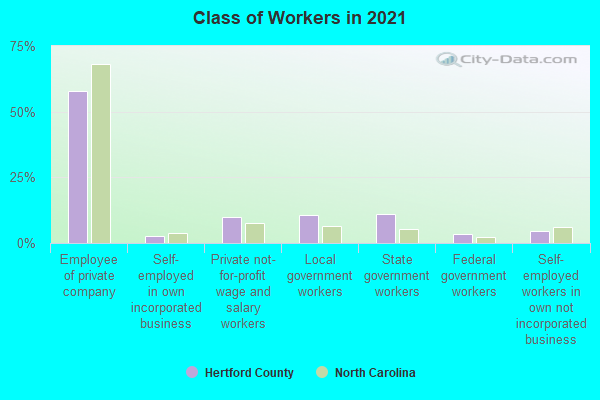
Type of workers:
- Private wage or salary: 69%
- Government: 25%
- Self-employed, not incorporated: 5%
- Unpaid family work: 1%
- OSM Map
- General Map
- Google Map
- MSN Map

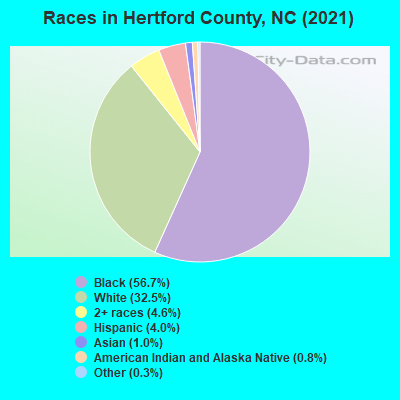
- 12,48657.0%Black Non-Hispanic Alone
- 7,02232.1%White Non-Hispanic Alone
- 1,0644.9%Hispanic or Latino
- 7673.5%Two or more races
- 2451.1%Asian alone
- 2401.1%American Indian and Alaska Native alone
- 470.2%Some other race alone
- 340.2%Native Hawaiian and Other
Pacific Islander alone
| Median resident age: | 41.8 years |
| North Carolina median age: | 39.2 years |
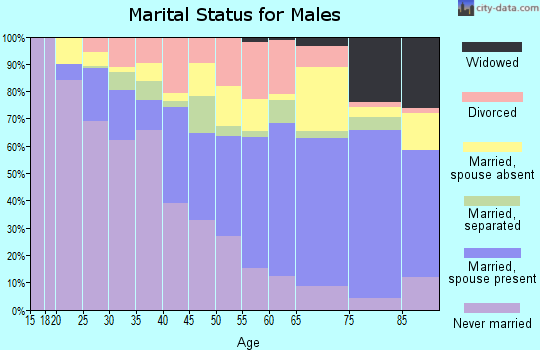
| Males: 11,116 | |
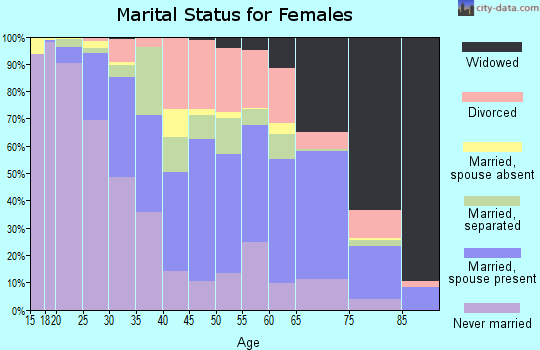
| Females: 10,989 |

 | Road Construction/Projects in Coastal NC (429 replies) |
| Proposed I-795 Quad East loop (719 replies) |
| Coastal and Eastern NC projects included in NCDOT's draft 2018-2027 STIP (3 replies) |
| Fascinating places/events/things to do in Eastern NC (37 replies) |
| Eastern North Carolina Has The Potential To Do Better (18 replies) |
| Can anyone describe Ahoskie? (22 replies) |
| Hertford County: | 2.0 people |
| North Carolina: | 2 people |
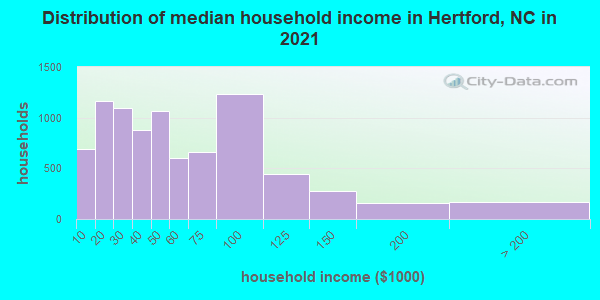
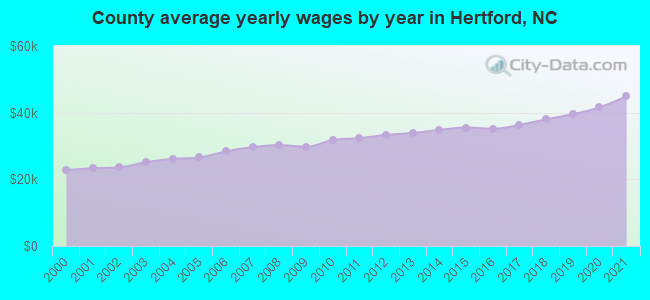
Estimated median household income in 2022: $47,099 ($26,422 in 1999)
| This county: | $47,099 |
| North Carolina: | $67,481 |
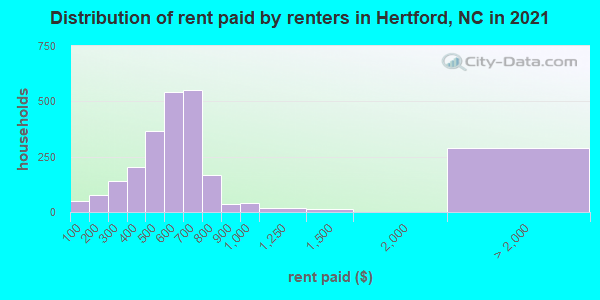
Median contract rent in 2022 for apartments: $577 (lower quartile is $458, upper quartile is $732)
| This county: | $577 |
| State: | $945 |
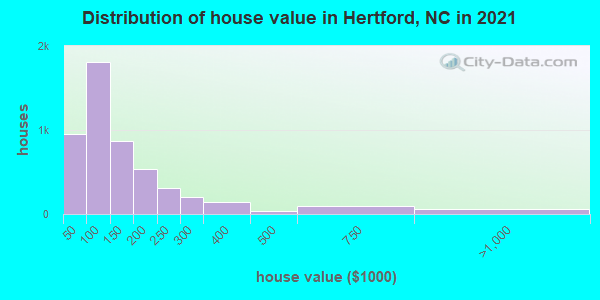
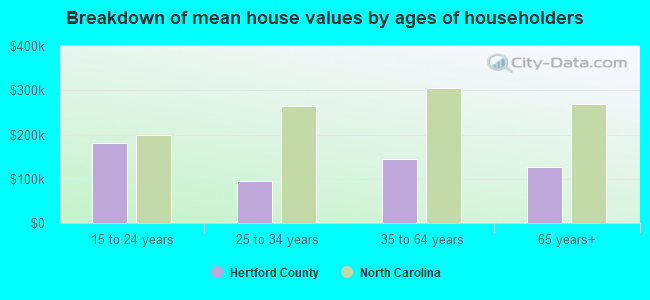
Estimated median house or condo value in 2022: $123,755 (it was $53,800 in 2000)
| Hertford: | $123,755 |
| North Carolina: | $280,600 |
Median monthly housing costs for homes and condos with a mortgage: $1,186
Median monthly housing costs for units without a mortgage: $447
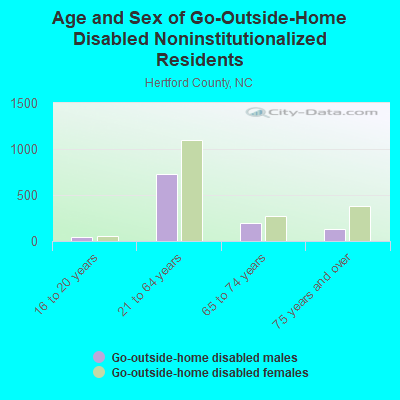
Institutionalized population: 1,561
Crime in 2021 (reported by the sheriff's office or county police, not the county total):
- Murders: 8
- Rapes: 4
- Robberies: 1
- Assaults: 11
- Burglaries: 131
- Thefts: 70
- Auto thefts: 10
Crime in 2020 (reported by the sheriff's office or county police, not the county total):
- Murders: 7
- Rapes: 2
- Robberies: 1
- Assaults: 12
- Burglaries: 59
- Thefts: 77
- Auto thefts: 10
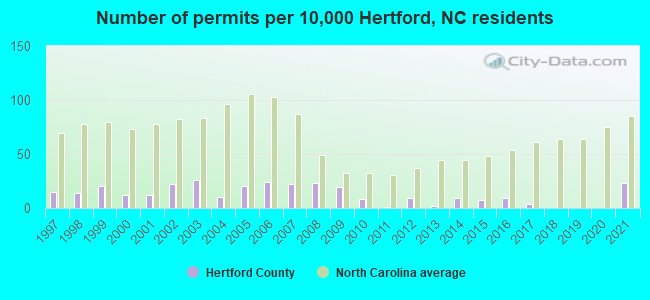
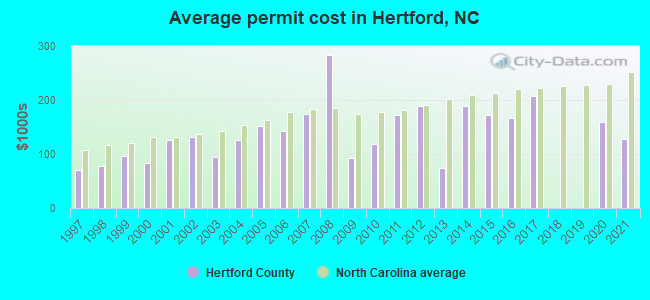
Single-family new house construction building permits:
- 2022: 13 buildings, average cost: $277,000
- 2021: 51 buildings, average cost: $127,200
- 2020: 1 building, cost: $159,900
- 2019: 0 buildings
- 2018: 0 buildings
- 2017: 8 buildings, average cost: $208,200
- 2016: 20 buildings, average cost: $167,200
- 2015: 15 buildings, average cost: $172,100
- 2014: 20 buildings, average cost: $188,300
- 2013: 5 buildings, average cost: $74,500
- 2012: 20 buildings, average cost: $187,800
- 2011: 2 buildings, average cost: $171,500
- 2010: 19 buildings, average cost: $117,700
- 2009: 44 buildings, average cost: $92,400
- 2008: 52 buildings, average cost: $282,700
- 2007: 50 buildings, average cost: $174,100
- 2006: 54 buildings, average cost: $143,200
- 2005: 45 buildings, average cost: $150,900
- 2004: 22 buildings, average cost: $126,400
- 2003: 58 buildings, average cost: $93,900
- 2002: 49 buildings, average cost: $131,600
- 2001: 26 buildings, average cost: $126,000
- 2000: 26 buildings, average cost: $84,100
- 1999: 46 buildings, average cost: $95,800
- 1998: 31 buildings, average cost: $76,700
- 1997: 35 buildings, average cost: $69,600
Median real estate property taxes paid for housing units with mortgages in 2022: $1,271 (0.8%)
Median real estate property taxes paid for housing units with no mortgage in 2022: $931 (0.9%)
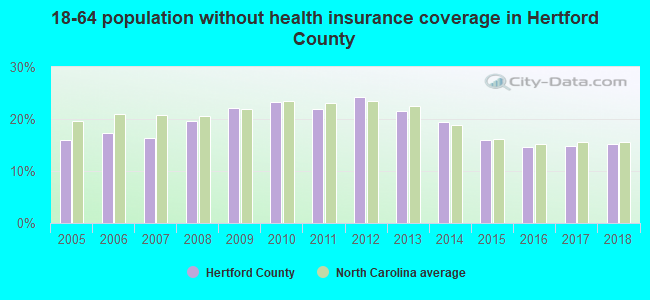
| Hertford County: | 19.4% |
| North Carolina: | 12.8% |
Median age of residents in 2022: 41.8 years old
(Males: 39.6 years old, Females: 45.3 years old)
(Median age for: White residents: 48.5 years old, Black residents: 41.9 years old, American Indian residents: 40.8 years old, Asian residents: 36.3 years old, Hispanic or Latino residents: 26.8 years old, Other race residents: 27.5 years old)
Fair market rent in 2006 for a 1-bedroom apartment in Hertford County is $451 a month.
Fair market rent for a 2-bedroom apartment is $503 a month.
Fair market rent for a 3-bedroom apartment is $660 a month.
Cities in this county include: Ahoskie, Murfreesboro, Winton, Cofield, Harrellsville, Como.
Notable locations in this county outside city limits:
Notable locations in Hertford County: Camp Katzenstein (A), Camp Willow Run (B), Warrenton Country Club (C), Creek (D). Display/hide their locations on the map
Churches in Hertford County include: Gruvers Memorial Church (A), Hebron Church (B), Inez Church (C), Jerusalem Church (D), Jones Chapel (E), Jordan Hill Church (F), Kingdom Hall Church (G), Antioch Church (H), Ashley Grove Church (I). Display/hide their locations on the map
Cemeteries: Warren Plains Cemetery (1), Lovely Hill Cemetery (2), Macons Grave (3), New Hope Cemetery (4), Old Warrenton Cemetery (5), Fairview Cemetery (6), Ridgeway Cemetery (7). Display/hide their locations on the map
Lakes and reservoirs: Largo Lake (A), Peetes Pond (B), Hammes Mill Pond (C), Lake Largo (D), Harringtons Pond (E), Coffmans Lake (F), Ryders Pond (G), Hicks Pond (H). Display/hide their locations on the map
Streams, rivers, and creeks: Ellington Branch (A), Dowtins Creek (B), Coleman Branch (C), Isinglass Creek (D), Buzzard Branch (E), Buffalo Branch (F), Bridle Creek (G), Bobs Branch (H), Bobbitts Branch (I). Display/hide their locations on the map
Parks in Hertford County include: Kimball Point Public Use Area (1), County Line Public Use Area (2). Display/hide their locations on the map
Neighboring counties: Dyer County, Tennessee  , Greene County, Arkansas , Jackson County, Tennessee , Lee County, Virginia , Knox County, Kentucky , Stokes County , Warren County .
| Here: | 4.3% |
| North Carolina: | 3.2% |
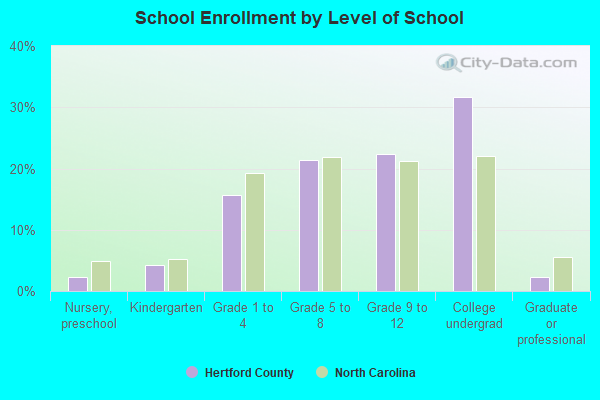
Current college students: 781
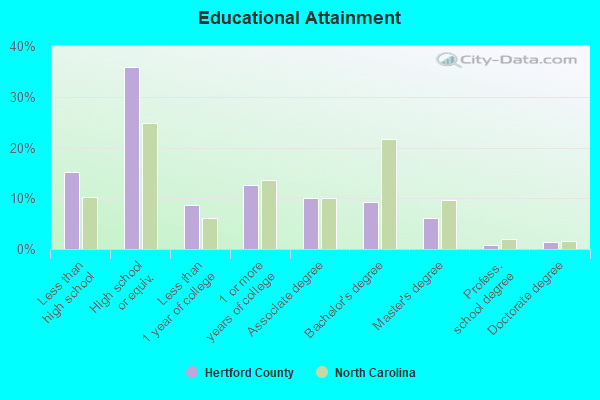
People 25 years of age or older with a high school degree or higher: 83.9%
People 25 years of age or older with a bachelor's degree or higher: 16.0%
Number of foreign born residents: 928 (30.5% naturalized citizens)
| Hertford County: | 4.2% |
| Whole state: | 8.6% |
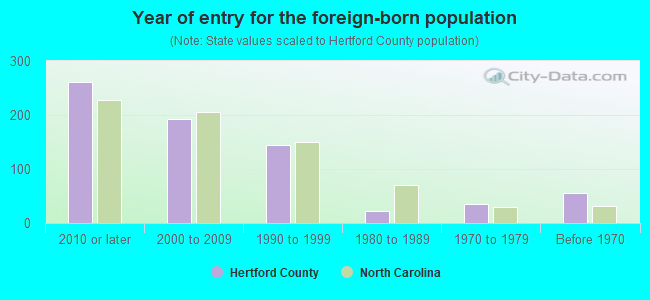
- Year of entry for the foreign-born population
- 3432010 or later
- 1962000 to 2009
- 1461990 to 1999
- 231980 to 1989
- 361970 to 1979
- 56Before 1970
Mean travel time to work (commute): minutes
Percentage of county residents living and working in this county: 83.0%
Housing units in structures:
- One, detached: 6,725
- One, attached: 234
- Two: 507
- 3 or 4: 227
- 5 to 9: 126
- 10 to 19: 33
- 20 to 49: 72
- 50 or more: 36
- Mobile homes: 2,092
Housing units in Hertford County with a mortgage: 2,914 (254 second mortgage, 17 home equity loan, 180 both second mortgage and home equity loan)
Houses without a mortgage: 77
| Here: | 2.5% with mortgage |
| State: | 97.0% with mortgage |
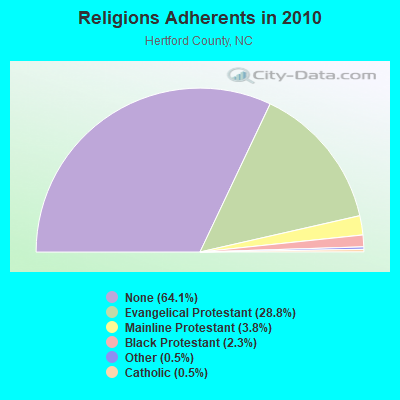
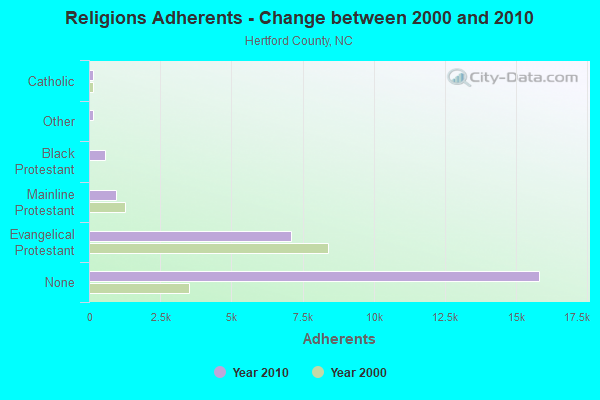
Religion statistics for Hertford County
| Religion | Adherents | Congregations |
|---|---|---|
| Evangelical Protestant | 7,097 | 36 |
| Mainline Protestant | 937 | 6 |
| Black Protestant | 566 | 4 |
| Other | 126 | 2 |
| Catholic | 125 | 1 |
| None | 15,818 | - |
Source: Clifford Grammich, Kirk Hadaway, Richard Houseal, Dale E.Jones, Alexei Krindatch, Richie Stanley and Richard H.Taylor. 2012. 2010 U.S.Religion Census: Religious Congregations & Membership Study. Association of Statisticians of American Religious Bodies. Jones, Dale E., et al. 2002. Congregations and Membership in the United States 2000. Nashville, TN: Glenmary Research Center.
Food Environment Statistics:
| Hertford County: | 3.44 / 10,000 pop. |
| State: | 2.05 / 10,000 pop. |
| This county: | 0.43 / 10,000 pop. |
| North Carolina: | 0.92 / 10,000 pop. |
| Hertford County: | 6.88 / 10,000 pop. |
| North Carolina: | 4.75 / 10,000 pop. |
| This county: | 6.88 / 10,000 pop. |
| State: | 7.57 / 10,000 pop. |
| Hertford County: | 13.7% |
| North Carolina: | 9.8% |
| Hertford County: | 34.3% |
| State: | 28.3% |
| Here: | 12.7% |
| State: | 15.6% |
Agriculture in Hertford County:
Average size of farms: 587 acresAverage value of agricultural products sold per farm: $708,924
Average value of crops sold per acre for harvested cropland: $408.02
The value of livestock, poultry, and their products as a percentage of the total market value of agricultural products sold: 78.05%
Average total farm production expenses per farm: $363,156
Harvested cropland as a percentage of land in farms: 64.99%
Average market value of all machinery and equipment per farm: $181,222
The percentage of farms operated by a family or individual: 73.53%
Average age of principal farm operators: 55 years
Average number of cattle and calves per 100 acres of all land in farms: 0.38
Corn for grain: 11217 harvested acres
All wheat for grain: 1402 harvested acres
Upland cotton: 18575 harvested acres
Soybeans for beans: 8808 harvested acres
Vegetables: 481 harvested acres
Tornado activity:
Hertford County historical area-adjusted tornado activity is significantly below North Carolina state average. It is 8923762.4 times below overall U.S. average.Tornadoes in this county have caused 9 injuries recorded between 1950 and 2004.
On 11/2/1966, a category 2 (max. wind speeds 113-157 mph) tornado injured 9 people and caused between $50,000 and $500,000 in damages.
Earthquake activity:
Hertford County-area historical earthquake activity is significantly above North Carolina state average. It is 60% smaller than the overall U.S. average.On 8/23/2011 at 17:51:04, a magnitude 5.8 (5.8 MW, Depth: 3.7 mi, Class: Moderate, Intensity: VI - VII) earthquake occurred 119.9 miles away from Hertford County center
On 12/9/2003 at 20:59:14, a magnitude 4.5 (4.5 MB, 4.5 LG, Class: Light, Intensity: IV - V) earthquake occurred 99.3 miles away from the county center
On 8/9/2020 at 12:07:37, a magnitude 5.1 (5.1 MW, Depth: 4.7 mi) earthquake occurred 227.9 miles away from the county center
On 12/9/2003 at 20:59:18, a magnitude 4.5 (4.5 ML, Depth: 6.2 mi) earthquake occurred 116.0 miles away from the county center
On 8/25/2011 at 05:07:52, a magnitude 4.5 (4.5 ML, Depth: 4.2 mi) earthquake occurred 123.0 miles away from Hertford County center
On 8/24/2011 at 00:04:36, a magnitude 4.2 (4.2 ML) earthquake occurred 120.7 miles away from the county center
Magnitude types: regional Lg-wave magnitude (LG), body-wave magnitude (MB), local magnitude (ML), moment magnitude (MW)
Most recent natural disasters:
- North Carolina Hurricane Isaias, Incident Period: July 31, 2020 - August 4, 2020, FEMA Id: 4568, Natural disaster type: Hurricane
- North Carolina Covid-19 Pandemic, Incident Period: January 20, 2020, FEMA Id: 4487, Natural disaster type: Other
- North Carolina Hurricane Matthew, Incident Period: October 04, 2016 to October 24, 2016, Emergency Declared EM-3380: October 07, 2016, FEMA Id: 3380, Natural disaster type: Hurricane
- North Carolina Hurricane Matthew, Incident Period: October 04, 2016 to October 24, 2016, Major Disaster (Presidential) Declared DR-4285: October 10, 2016, FEMA Id: 4285, Natural disaster type: Hurricane
- North Carolina Hurricane Irene, Incident Period: August 25, 2011 to September 01, 2011, Emergency Declared EM-3327: August 25, 2011, FEMA Id: 3327, Natural disaster type: Hurricane
- North Carolina Hurricane Irene, Incident Period: August 25, 2011 to September 01, 2011, Major Disaster (Presidential) Declared DR-4019: August 31, 2011, FEMA Id: 4019, Natural disaster type: Hurricane
- North Carolina Severe Storms, Tornadoes, and Flooding, Incident Period: April 16, 2011, Major Disaster (Presidential) Declared DR-1969: April 19, 2011, FEMA Id: 1969, Natural disaster type: Storm, Tornado, Flood
- North Carolina Severe Storms, Flooding, and Straight-line Winds associated with the remnants of Tropical Storm Nicole, Incident Period: September 27, 2010 to October 01, 2010, Major Disaster (Presidential) Declared DR-1942: October 14, 2010, FEMA Id: 1942, Natural disaster type: Tropical Storm, Storm, Flood, Wind
- North Carolina Hurricane Earl, Incident Period: September 01, 2010 to September 04, 2010, Emergency Declared EM-3314: September 01, 2010, FEMA Id: 3314, Natural disaster type: Hurricane
- North Carolina Hurricane Ophelia, Incident Period: September 11, 2005 to September 17, 2005, Emergency Declared EM-3254: September 14, 2005, FEMA Id: 3254, Natural disaster type: Hurricane
- 9 other natural disasters have been reported since 1953.
The number of natural disasters in Hertford County (19) is greater than the US average (15).
Major Disasters (Presidential) Declared: 11
Emergencies Declared: 6
Causes of natural disasters: Hurricanes: 12, Storms: 4, Floods: 3, Tornadoes: 2, Blizzard: 1, Ice Storm: 1, Tropical Storm: 1, Wind: 1, Other: 1 (Note: some incidents may be assigned to more than one category).
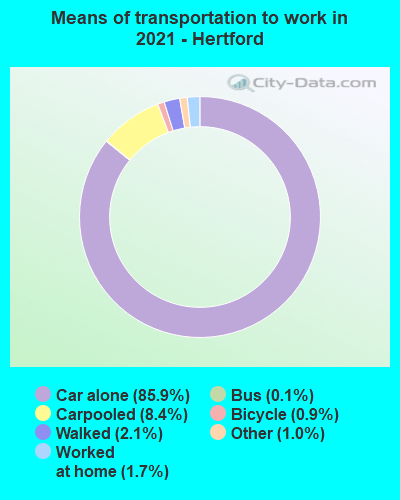
Means of transportation to work:
- Drove a car alone: 8,000 (79.4%)
- Carpooled: 794 (7.9%)
- Bus: 43 (0.4%)
- Taxicab, motorcycle, or other means: 210 (2.1%)
- Bicycle: 75 (0.7%)
- Walked: 160 (1.6%)
- Worked at home: 414 (4.1%)
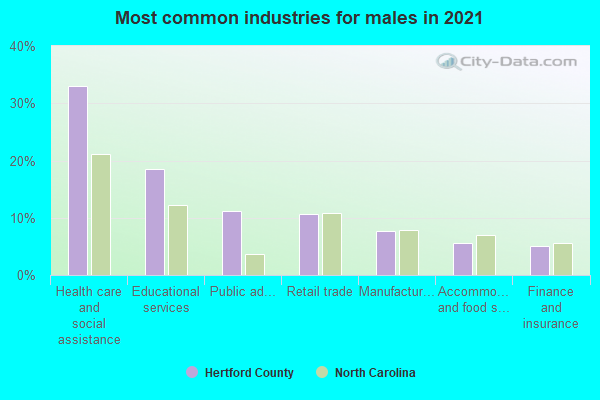
- Health care and social assistance (28%)
- Educational services (17%)
- Retail trade (11%)
- Public administration (8%)
- Manufacturing (7%)
- Accommodation and food services (7%)
- Finance and insurance (5%)
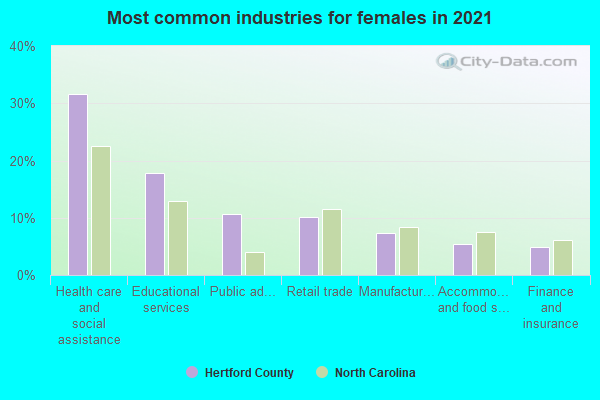
- Health care and social assistance (28%)
- Educational services (17%)
- Retail trade (11%)
- Public administration (8%)
- Manufacturing (7%)
- Accommodation and food services (7%)
- Finance and insurance (5%)
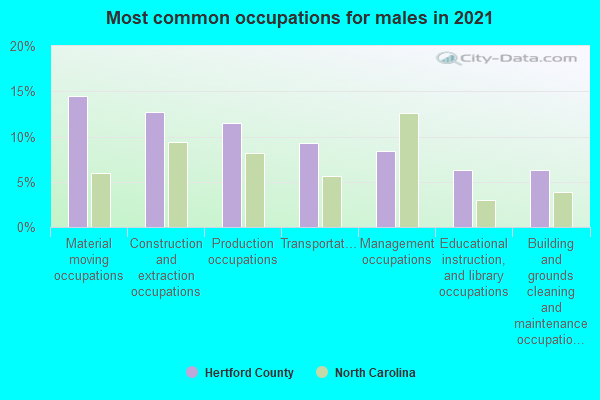
- Material moving occupations (15%)
- Production occupations (13%)
- Transportation occupations (10%)
- Construction and extraction occupations (10%)
- Building and grounds cleaning and maintenance occupations (8%)
- Management occupations (7%)
- Installation, maintenance, and repair occupations (7%)
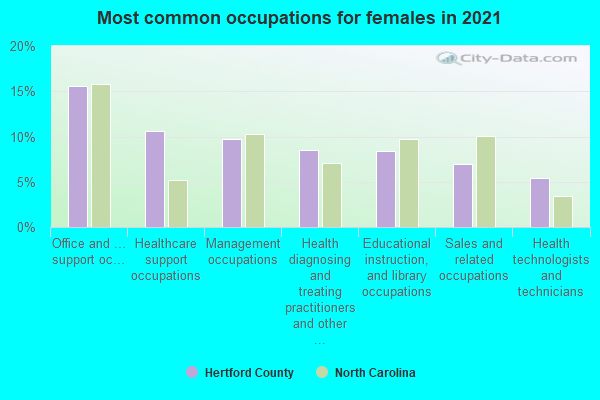
- Office and administrative support occupations (20%)
- Healthcare support occupations (10%)
- Educational instruction, and library occupations (9%)
- Management occupations (9%)
- Sales and related occupations (8%)
- Health diagnosing and treating practitioners and other technical occupations (7%)
- Health technologists and technicians (5%)
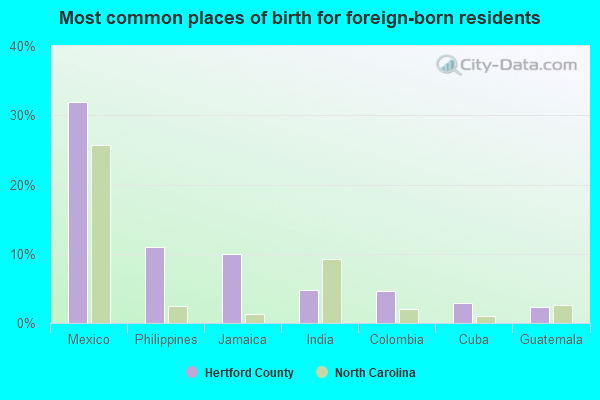
- Mexico (28%)
- Jamaica (17%)
- India (9%)
- Guatemala (8%)
- Philippines (8%)
- Colombia (4%)
- Burma (Myanmar) (3%)
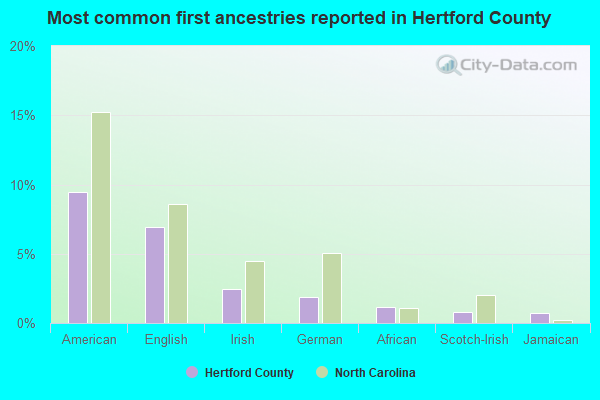
- American (10%)
- English (7%)
- Irish (2%)
- German (2%)
- Jamaican (1%)
- African (1%)
- European (1%)
People in group quarters in Hertford County, North Carolina in 2010:
- 1,235 people in federal detention centers
- 694 people in college/university student housing
- 262 people in nursing facilities/skilled-nursing facilities
- 64 people in local jails and other municipal confinement facilities
- 25 people in group homes intended for adults
- 17 people in workers' group living quarters and job corps centers
People in group quarters in Hertford County, North Carolina in 2000:
- 175 people in nursing homes
- 105 people in other noninstitutional group quarters
- 68 people in local jails and other confinement facilities (including police lockups)
- 43 people in hospitals/wards and hospices for chronically ill
- 43 people in other hospitals or wards for chronically ill
- 9 people in mental (psychiatric) hospitals or wards
- 8 people in other group homes
- 5 people in orthopedic wards and institutions for the physically handicapped
- 5 people in other nonhousehold living situations
- 2 people in religious group quarters
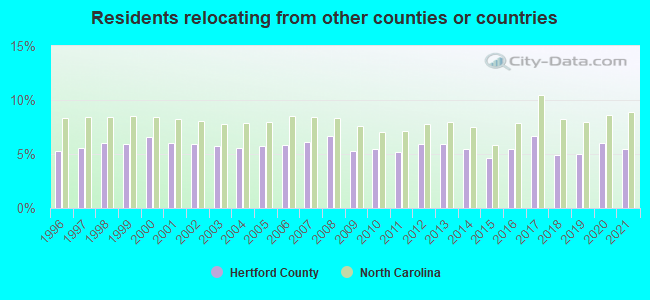
5.44% of this county's 2021 resident taxpayers lived in other counties in 2020 ($41,380 average adjusted gross income)
| Here: | 5.44% |
| North Carolina average: | 8.85% |
10 or fewer of this county's residents moved from foreign countries.
3.69% relocated from other counties in North Carolina ($24,141 average AGI)
1.75% relocated from other states ($17,239 average AGI)
Hertford County: 1.75% North Carolina average: 4.18%
Top counties from which taxpayers relocated into this county between 2020 and 2021:
| from Bertie County, NC | |
| from Northampton County, NC |
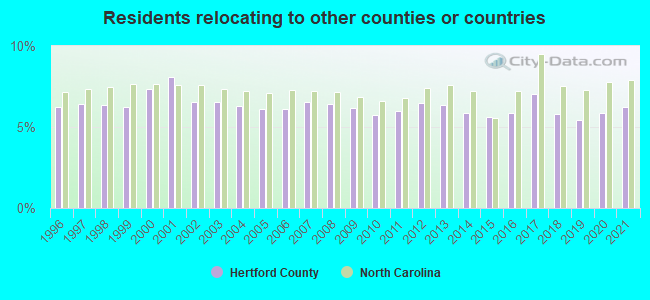
6.22% of this county's 2020 resident taxpayers moved to other counties in 2021 ($36,148 average adjusted gross income)
| Here: | 6.22% |
| North Carolina average: | 7.89% |
10 or fewer of this county's residents moved to foreign countries.
3.94% relocated to other counties in North Carolina ($25,626 average AGI)
2.28% relocated to other states ($10,522 average AGI)
Hertford County: 2.28% North Carolina average: 3.18%
Top counties to which taxpayers relocated from this county between 2020 and 2021:
| to Bertie County, NC | |
| to Pitt County, NC | |
| to Northampton County, NC | |
| to Wake County, NC |
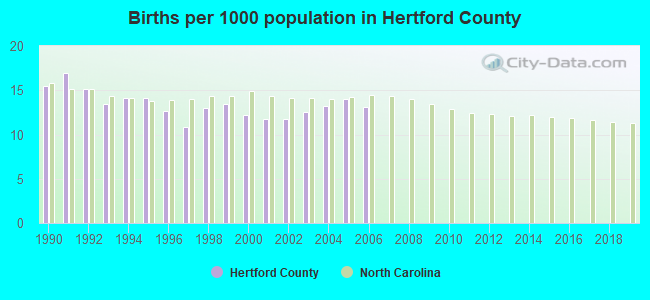
Births per 1000 population from 1990 to 1999: 13.9
Births per 1000 population from 2000 to 2006: 12.6
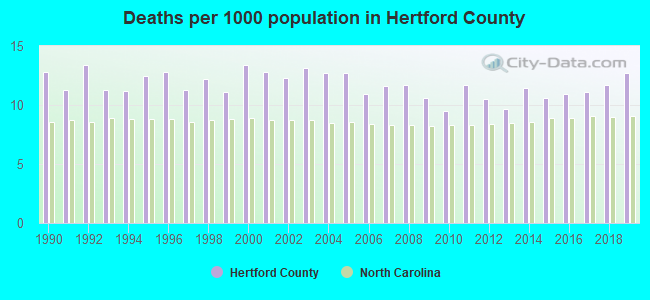
Deaths per 1000 population from 1990 to 1999: 12.0
Deaths per 1000 population from 2000 to 2009: 12.2
Deaths per 1000 population from 2010 to 2020: 11.4
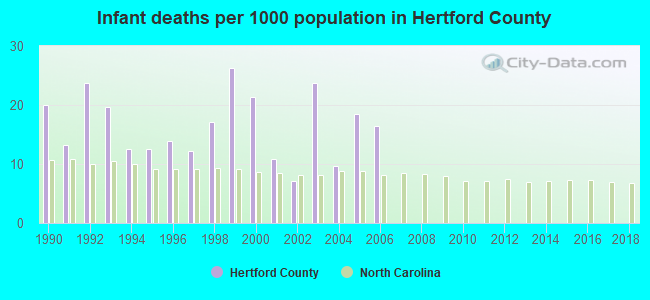
Infant deaths per 1000 live births from 1990 to 1999: 17.1
Infant deaths per 1000 live births from 2000 to 2006: 15.4
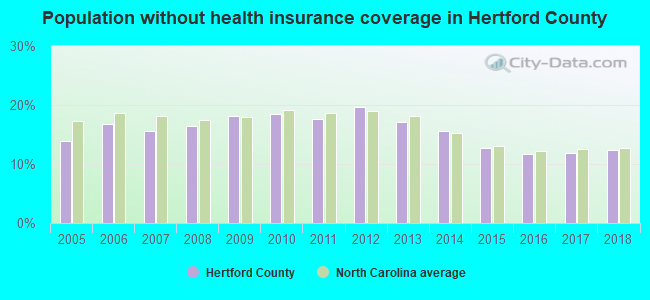
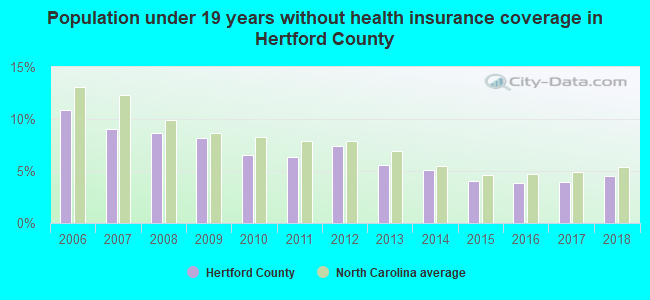
Persons under 19 years old without health insurance coverage in 2018: 4.5%
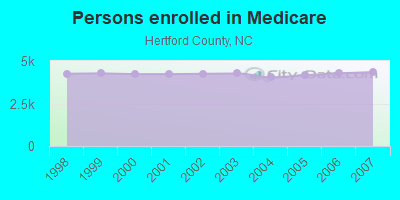
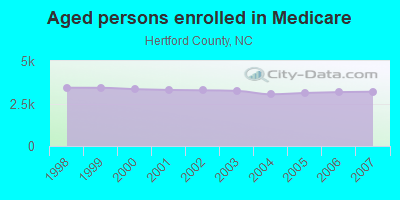
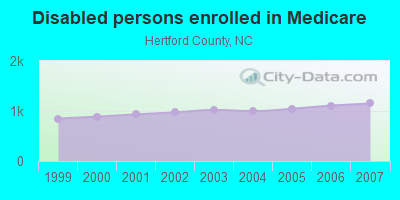
Persons enrolled in hospital insurance and/or supplemental medical insurance (Medicare) in July 1, 2007: 4,345 (3,194 aged, 1,151 disabled)
Children under 18 without health insurance coverage in 2007: 646 (13%)
Most common underlying causes of death in Hertford County, North Carolina in 1999 - 2019:
- Atherosclerotic heart disease (425)
- Bronchus or lung, unspecified - Malignant neoplasms (334)
- Alzheimer disease, unspecified (152)
- Acute myocardial infarction, unspecified (141)
- Unspecified dementia (119)
- Unspecified diabetes mellitus, without complications (118)
- Chronic obstructive pulmonary disease, unspecified (96)
- Stroke, not specified as haemorrhage or infarction (75)
- Colon, unspecified - Malignant neoplasms (33)
- Pneumonia, unspecified (21)
Population without health insurance coverage in 2000: 19%
Children under 18 without health insurance coverage in 2000: 15%
Short term general hospital admissions per 100,000 population in 2004: 21,031
Short term general hospital beds per 100,000 population in 2004: 446
Emergency room visits per 100,000 population in 2004: 74,430
General practice office based MDs per 100,000 population in 2005: 1,315
Medical specialist MDs per 100,000 population in 2005: 1,290
Dentists per 100,000 population in 1998: 13
Total births per 100,000 population, July 2005 - July 2006 : 27
Total deaths per 100,000 population, July 2005 - July 2006: 85
Limited-service eating places per 100,000 population in 2005 : 13
EPA green book nonattainment status in 2004-2006: 1
Crimes per 100,000 population in 1996: 1
Household type by relationship:
Households: 22,105- Male householders: 3,734 (1,332 living alone), Female householders: 5,024 (1,719 living alone)
3,339 spouses (3,278 opposite-sex spouses), 457 unmarried partners, (373 opposite-sex unmarried partners), 5,069 children (4,712 natural, 147 adopted, 207 stepchildren), 862 grandchildren, 367 brothers or sisters, 303 parents, 0 foster children, 400 other relatives, 404 non-relatives
- In group quarters: 2,146
Size of family households: 2,846 2-persons, 1,043 3-persons, 794 4-persons, 406 5-persons, 182 6-persons, 81 7-or-more-persons.
Size of nonfamily households: 3,052 1-person, 307 2-persons, 31 3-persons, 6 4-persons.
1,507 married couples with children.
1,577 single-parent households (104 men, 1,473 women).
94.9% of residents of Hertford speak English at home.
3.5% of residents speak Spanish at home (49% speak English very well, 36% speak English well, 7% speak English not well, 8% don't speak English at all).
0.5% of residents speak other Indo-European language at home (83% speak English very well, 17% speak English well).
0.7% of residents speak Asian or Pacific Island language at home (67% speak English very well, 23% speak English well, 5% speak English not well, 5% don't speak English at all).
0.2% of residents speak other language at home (96% speak English very well, 4% speak English not well).
In fiscal year 2004:
Federal Government expenditure: $162,676,000 ($6,907 per capita)
Department of Defense expenditure: $3,670,000
Federal direct payments to individuals for retirement and disability: $67,286,000
Federal other direct payments to individuals: $34,037,000
Federal direct payments not to individuals: $5,865,000
Federal grants: $50,145,000
Federal procurement contracts: $1,200,000 ($474,000 Department of Defense)
Federal salaries and wages: $4,144,000 ($366,000 Department of Defense)
Federal Government direct loans: $4,752,000
Federal guaranteed/insured loans: $2,883,000
Federal Government insurance: $31,043,000
Population change from April 1, 2000 to July 1, 2005:
Births: 1,581| Here: | 67 per 1000 residents |
| State: | 72 per 1000 residents |
Deaths: 1,572
| Here: | 67 per 1000 residents |
| State: | 44 per 1000 residents |
Net international migration: +127
| Here: | +5 per 1000 residents |
| State: | +18 per 1000 residents |
Net internal migration: +485
| Here: | +21 per 1000 residents |
| State: | +27 per 1000 residents |
Total withdrawal of fresh water for public supply: 1.68 millions of gallons per day (all from ground)
| Here: | 6.3 |
| State: | 6.4 |
| Here: | 4.8 |
| State: | 4.4 |
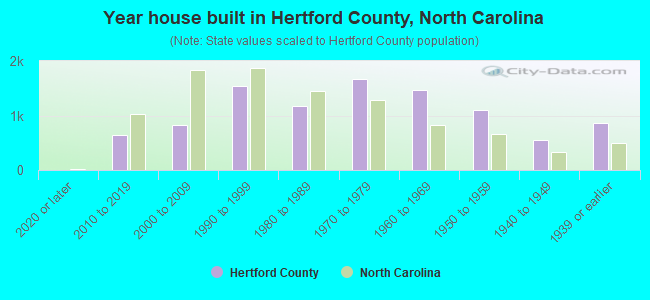
- Year house built in Hertford County, North Carolina
- 182020 or later
- 6832010 to 2019
- 8882000 to 2009
- 1,5061990 to 1999
- 1,1301980 to 1989
- 1,5761970 to 1979
- 1,5241960 to 1969
- 9451950 to 1959
- 5971940 to 1949
- 8161939 or earlier
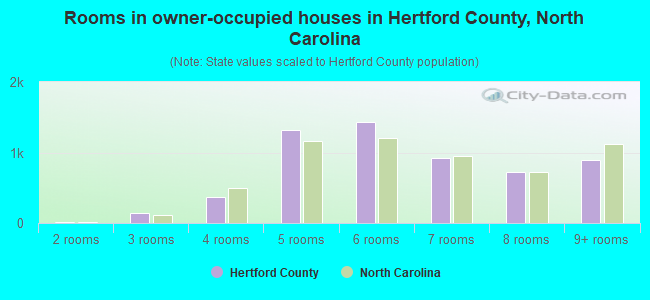
- Rooms in owner-occupied houses in Hertford County, North Carolina
- 91 room
- 302 rooms
- 1253 rooms
- 4004 rooms
- 1,1445 rooms
- 1,4746 rooms
- 1,0107 rooms
- 6728 rooms
- 8959+ rooms
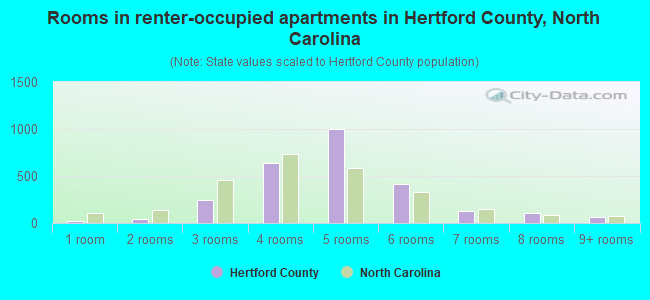
- Rooms in renter-occupied apartments in Hertford County, North Carolina
- 161 room
- 332 rooms
- 3463 rooms
- 7874 rooms
- 9755 rooms
- 4646 rooms
- 1787 rooms
- 1068 rooms
- 509+ rooms
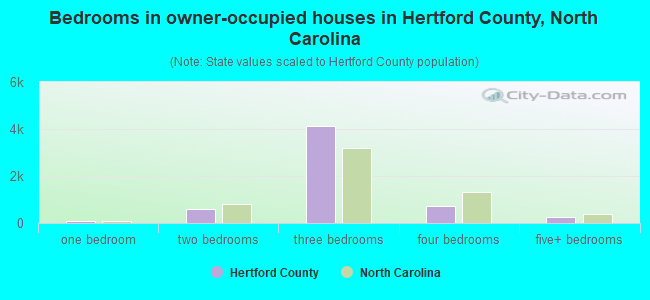
- Bedrooms in owner-occupied houses in Hertford County, North Carolina
- 40no bedroom
- 561 bedroom
- 5812 bedrooms
- 4,0593 bedrooms
- 7524 bedrooms
- 2395+ bedrooms
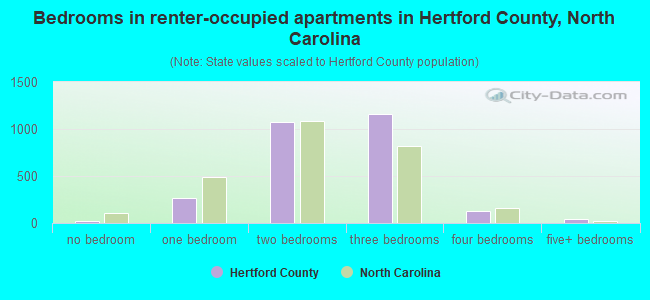
- Bedrooms in renter-occupied apartments in Hertford County, North Carolina
- 21no bedroom
- 2321 bedroom
- 1,3172 bedrooms
- 1,1903 bedrooms
- 1774 bedrooms
- 315+ bedrooms
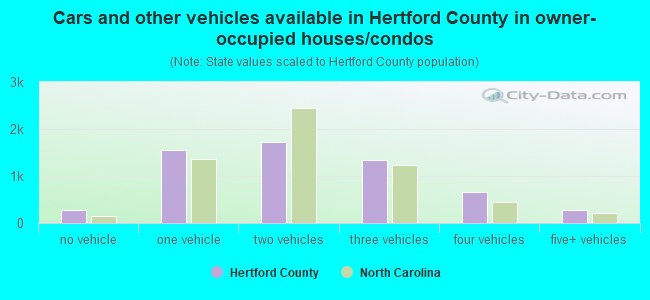
- Cars and other vehicles available in Hertford County in owner-occupied houses/condos
- 178no vehicle
- 1,3681 vehicle
- 1,7252 vehicles
- 1,3293 vehicles
- 8024 vehicles
- 3565+ vehicles
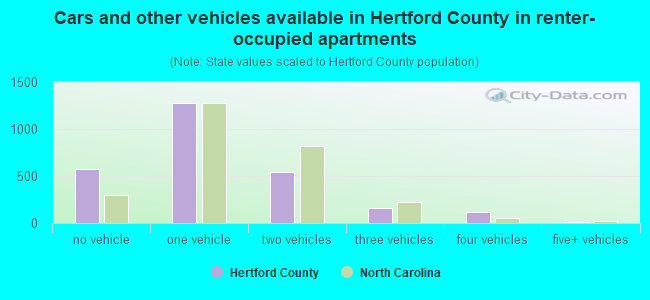
- Cars and other vehicles available in Hertford County in renter-occupied apartments
- 544no vehicle
- 1,4511 vehicle
- 6842 vehicles
- 1573 vehicles
- 954 vehicles
- 225+ vehicles
89.4% of Hertford County residents lived in the same house 1 years ago.
Out of people who lived in different houses, 22% lived in this county.
Out of people who lived in different counties, 44% lived in North Carolina.
| Hertford County: | 89.4% |
| State average: | 87.3% |
Place of birth for U.S.-born residents:
- This state: 15,401
- Other state: 5,463
- Northeast: 1,039
- Midwest: 385
- South: 3,821
- West: 204
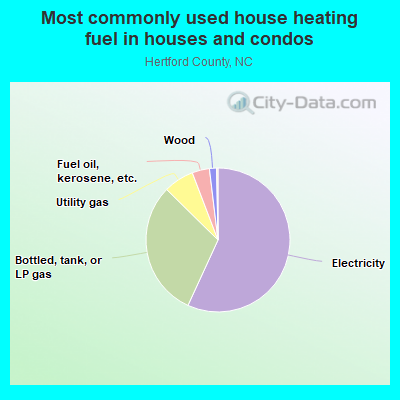
- 54.6%Electricity
- 34.3%Bottled, tank, or LP gas
- 6.2%Utility gas
- 3.0%Fuel oil, kerosene, etc.
- 1.3%Wood
- 0.3%Other fuel
- 0.2%No fuel used
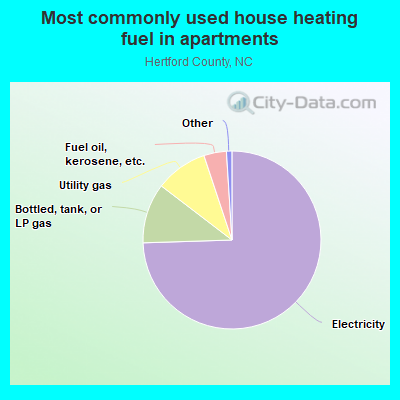
- 72.4%Electricity
- 14.7%Bottled, tank, or LP gas
- 8.0%Utility gas
- 3.8%Fuel oil, kerosene, etc.
- 0.7%No fuel used
- 0.4%Wood
Private vs. public school enrollment:
| Here: | 18.0% |
| North Carolina: | 13.8% |
| Here: | 7.2% |
| North Carolina: | 11.9% |
| Here: | 62.6% |
| North Carolina: | 19.3% |
Hertford County government finances - Expenditure in 2017:
- Assistance and Subsidies - Public Welfare, Cash Assistance Programs - Other: $1,107,000
- Charges - Other: $2,071,000
Solid Waste Management: $1,001,000
Hospital Public: $882,000
Miscellaneous Commercial Activities: $727,000
Higher Education - Other: $332,000
Elementary and Secondary Education - Other: $171,000
Parks and Recreation: $159,000
Elementary and Secondary Education School Lunch: $68,000
Sewerage: $34,000
Higher Education Auxiliary Enterprises: $32,000
Elementary and Secondary Education School Tuition and Transportation: $6,000
- Construction - General - Other: $2,156,000
Elementary and Secondary Education: $897,000
Police Protection: $198,000
- Current Operations - Elementary and Secondary Education: $31,867,000
Other Higher Education: $7,642,000
Health - Other: $5,306,000
Public Welfare - Other: $4,595,000
Police Protection: $3,105,000
Correctional Institutions: $1,746,000
Liquor Stores: $1,744,000
Financial Administration: $1,496,000
Libraries: $1,252,000
Central Staff Services: $1,105,000
Solid Waste Management: $1,100,000
General Public Buildings: $849,000
Water Utilities: $768,000
General - Other: $568,000
Local Fire Protection: $541,000
Housing and Community Development: $422,000
Judicial and Legal Services: $161,000
Protective Inspection and Regulation - Other: $106,000
Natural Resources - Other: $103,000
Transit Utilities: $28,000
Higher Education Auxiliary Enterprises: $21,000
- Federal Intergovernmental - Education: $946,000
- General - Interest on Debt: $479,000
- Intergovernmental to Local - Other - Elementary and Secondary Education: $268,000
Other - Health - Other: $8,000
- Intergovernmental to State - Public Welfare: $514,000
- Local Intergovernmental - Other: $1,157,000
Education: $1,029,000
Health and Hospitals: $349,000
- Long Term Debt - Outstanding Nonguaranteed - Industrial Revenue: $70,000,000
Beginning Outstanding - Public Debt for Private Purpose: $70,000,000
Beginning Outstanding - Unspecified Public Purpose: $13,946,000
Outstanding Unspecified Public Purpose: $13,021,000
Retired Unspecified Public Purpose: $925,000
- Miscellaneous - General Revenue - Other: $328,000
Fines and Forfeits: $150,000
Donations From Private Sources: $129,000
Sale of Property: $125,000
Interest Earnings: $65,000
- Other Capital Outlay - Central Staff Services: $537,000
Elementary and Secondary Education: $530,000
Police Protection: $332,000
General - Other: $265,000
Other Higher Education: $170,000
Health - Other: $92,000
General Public Building: $69,000
Libraries: $19,000
Correctional Institutions: $13,000
- Other Funds - Cash and Securities: $11,093,000
- Revenue - Liquor Stores: $1,794,000
Water Utilities: $1,528,000
- Sinking Funds - Cash and Securities: $70,000,000
- State Intergovernmental - Education: $33,504,000
Public Welfare: $3,996,000
Other: $1,828,000
Health and Hospitals: $1,331,000
General Local Government Support: $106,000
Housing and Community Development: $8,000
- Tax - Property: $13,871,000
General Sales and Gross Receipts: $5,137,000
Occupation and Business License - Other: $78,000
Other License: $62,000
Alcoholic Beverage Sales: $61,000
- Total Salaries and Wages: $22,138,000
- Water Utilities - Interest on Debt: $204,000
Hertford County government finances - Revenue in 2017:
- Assistance and Subsidies - Public Welfare, Cash Assistance Programs - Other: $1,107,000
- Charges - Other: $2,071,000
Solid Waste Management: $1,001,000
Hospital Public: $882,000
Miscellaneous Commercial Activities: $727,000
Higher Education - Other: $332,000
Elementary and Secondary Education - Other: $171,000
Parks and Recreation: $159,000
Elementary and Secondary Education School Lunch: $68,000
Sewerage: $34,000
Higher Education Auxiliary Enterprises: $32,000
Elementary and Secondary Education School Tuition and Transportation: $6,000
- Construction - General - Other: $2,156,000
Elementary and Secondary Education: $897,000
Police Protection: $198,000
- Current Operations - Elementary and Secondary Education: $31,867,000
Other Higher Education: $7,642,000
Health - Other: $5,306,000
Public Welfare - Other: $4,595,000
Police Protection: $3,105,000
Correctional Institutions: $1,746,000
Liquor Stores: $1,744,000
Financial Administration: $1,496,000
Libraries: $1,252,000
Central Staff Services: $1,105,000
Solid Waste Management: $1,100,000
General Public Buildings: $849,000
Water Utilities: $768,000
General - Other: $568,000
Local Fire Protection: $541,000
Housing and Community Development: $422,000
Judicial and Legal Services: $161,000
Protective Inspection and Regulation - Other: $106,000
Natural Resources - Other: $103,000
Transit Utilities: $28,000
Higher Education Auxiliary Enterprises: $21,000
- Federal Intergovernmental - Education: $946,000
- General - Interest on Debt: $479,000
- Intergovernmental to Local - Other - Elementary and Secondary Education: $268,000
Other - Health - Other: $8,000
- Intergovernmental to State - Public Welfare: $514,000
- Local Intergovernmental - Other: $1,157,000
Education: $1,029,000
Health and Hospitals: $349,000
- Long Term Debt - Outstanding Nonguaranteed - Industrial Revenue: $70,000,000
Beginning Outstanding - Public Debt for Private Purpose: $70,000,000
Beginning Outstanding - Unspecified Public Purpose: $13,946,000
Outstanding Unspecified Public Purpose: $13,021,000
Retired Unspecified Public Purpose: $925,000
- Miscellaneous - General Revenue - Other: $328,000
Fines and Forfeits: $150,000
Donations From Private Sources: $129,000
Sale of Property: $125,000
Interest Earnings: $65,000
- Other Capital Outlay - Central Staff Services: $537,000
Elementary and Secondary Education: $530,000
Police Protection: $332,000
General - Other: $265,000
Other Higher Education: $170,000
Health - Other: $92,000
General Public Building: $69,000
Libraries: $19,000
Correctional Institutions: $13,000
- Other Funds - Cash and Securities: $11,093,000
- Revenue - Liquor Stores: $1,794,000
Water Utilities: $1,528,000
- Sinking Funds - Cash and Securities: $70,000,000
- State Intergovernmental - Education: $33,504,000
Public Welfare: $3,996,000
Other: $1,828,000
Health and Hospitals: $1,331,000
General Local Government Support: $106,000
Housing and Community Development: $8,000
- Tax - Property: $13,871,000
General Sales and Gross Receipts: $5,137,000
Occupation and Business License - Other: $78,000
Other License: $62,000
Alcoholic Beverage Sales: $61,000
- Total Salaries and Wages: $22,138,000
- Water Utilities - Interest on Debt: $204,000
Hertford County government finances - Debt in 2017:
- Assistance and Subsidies - Public Welfare, Cash Assistance Programs - Other: $1,107,000
- Charges - Other: $2,071,000
Solid Waste Management: $1,001,000
Hospital Public: $882,000
Miscellaneous Commercial Activities: $727,000
Higher Education - Other: $332,000
Elementary and Secondary Education - Other: $171,000
Parks and Recreation: $159,000
Elementary and Secondary Education School Lunch: $68,000
Sewerage: $34,000
Higher Education Auxiliary Enterprises: $32,000
Elementary and Secondary Education School Tuition and Transportation: $6,000
- Construction - General - Other: $2,156,000
Elementary and Secondary Education: $897,000
Police Protection: $198,000
- Current Operations - Elementary and Secondary Education: $31,867,000
Other Higher Education: $7,642,000
Health - Other: $5,306,000
Public Welfare - Other: $4,595,000
Police Protection: $3,105,000
Correctional Institutions: $1,746,000
Liquor Stores: $1,744,000
Financial Administration: $1,496,000
Libraries: $1,252,000
Central Staff Services: $1,105,000
Solid Waste Management: $1,100,000
General Public Buildings: $849,000
Water Utilities: $768,000
General - Other: $568,000
Local Fire Protection: $541,000
Housing and Community Development: $422,000
Judicial and Legal Services: $161,000
Protective Inspection and Regulation - Other: $106,000
Natural Resources - Other: $103,000
Transit Utilities: $28,000
Higher Education Auxiliary Enterprises: $21,000
- Federal Intergovernmental - Education: $946,000
- General - Interest on Debt: $479,000
- Intergovernmental to Local - Other - Elementary and Secondary Education: $268,000
Other - Health - Other: $8,000
- Intergovernmental to State - Public Welfare: $514,000
- Local Intergovernmental - Other: $1,157,000
Education: $1,029,000
Health and Hospitals: $349,000
- Long Term Debt - Outstanding Nonguaranteed - Industrial Revenue: $70,000,000
Beginning Outstanding - Public Debt for Private Purpose: $70,000,000
Beginning Outstanding - Unspecified Public Purpose: $13,946,000
Outstanding Unspecified Public Purpose: $13,021,000
Retired Unspecified Public Purpose: $925,000
- Miscellaneous - General Revenue - Other: $328,000
Fines and Forfeits: $150,000
Donations From Private Sources: $129,000
Sale of Property: $125,000
Interest Earnings: $65,000
- Other Capital Outlay - Central Staff Services: $537,000
Elementary and Secondary Education: $530,000
Police Protection: $332,000
General - Other: $265,000
Other Higher Education: $170,000
Health - Other: $92,000
General Public Building: $69,000
Libraries: $19,000
Correctional Institutions: $13,000
- Other Funds - Cash and Securities: $11,093,000
- Revenue - Liquor Stores: $1,794,000
Water Utilities: $1,528,000
- Sinking Funds - Cash and Securities: $70,000,000
- State Intergovernmental - Education: $33,504,000
Public Welfare: $3,996,000
Other: $1,828,000
Health and Hospitals: $1,331,000
General Local Government Support: $106,000
Housing and Community Development: $8,000
- Tax - Property: $13,871,000
General Sales and Gross Receipts: $5,137,000
Occupation and Business License - Other: $78,000
Other License: $62,000
Alcoholic Beverage Sales: $61,000
- Total Salaries and Wages: $22,138,000
- Water Utilities - Interest on Debt: $204,000
Hertford County government finances - Cash and Securities in 2017:
- Assistance and Subsidies - Public Welfare, Cash Assistance Programs - Other: $1,107,000
- Charges - Other: $2,071,000
Solid Waste Management: $1,001,000
Hospital Public: $882,000
Miscellaneous Commercial Activities: $727,000
Higher Education - Other: $332,000
Elementary and Secondary Education - Other: $171,000
Parks and Recreation: $159,000
Elementary and Secondary Education School Lunch: $68,000
Sewerage: $34,000
Higher Education Auxiliary Enterprises: $32,000
Elementary and Secondary Education School Tuition and Transportation: $6,000
- Construction - General - Other: $2,156,000
Elementary and Secondary Education: $897,000
Police Protection: $198,000
- Current Operations - Elementary and Secondary Education: $31,867,000
Other Higher Education: $7,642,000
Health - Other: $5,306,000
Public Welfare - Other: $4,595,000
Police Protection: $3,105,000
Correctional Institutions: $1,746,000
Liquor Stores: $1,744,000
Financial Administration: $1,496,000
Libraries: $1,252,000
Central Staff Services: $1,105,000
Solid Waste Management: $1,100,000
General Public Buildings: $849,000
Water Utilities: $768,000
General - Other: $568,000
Local Fire Protection: $541,000
Housing and Community Development: $422,000
Judicial and Legal Services: $161,000
Protective Inspection and Regulation - Other: $106,000
Natural Resources - Other: $103,000
Transit Utilities: $28,000
Higher Education Auxiliary Enterprises: $21,000
- Federal Intergovernmental - Education: $946,000
- General - Interest on Debt: $479,000
- Intergovernmental to Local - Other - Elementary and Secondary Education: $268,000
Other - Health - Other: $8,000
- Intergovernmental to State - Public Welfare: $514,000
- Local Intergovernmental - Other: $1,157,000
Education: $1,029,000
Health and Hospitals: $349,000
- Long Term Debt - Outstanding Nonguaranteed - Industrial Revenue: $70,000,000
Beginning Outstanding - Public Debt for Private Purpose: $70,000,000
Beginning Outstanding - Unspecified Public Purpose: $13,946,000
Outstanding Unspecified Public Purpose: $13,021,000
Retired Unspecified Public Purpose: $925,000
- Miscellaneous - General Revenue - Other: $328,000
Fines and Forfeits: $150,000
Donations From Private Sources: $129,000
Sale of Property: $125,000
Interest Earnings: $65,000
- Other Capital Outlay - Central Staff Services: $537,000
Elementary and Secondary Education: $530,000
Police Protection: $332,000
General - Other: $265,000
Other Higher Education: $170,000
Health - Other: $92,000
General Public Building: $69,000
Libraries: $19,000
Correctional Institutions: $13,000
- Other Funds - Cash and Securities: $11,093,000
- Revenue - Liquor Stores: $1,794,000
Water Utilities: $1,528,000
- Sinking Funds - Cash and Securities: $70,000,000
- State Intergovernmental - Education: $33,504,000
Public Welfare: $3,996,000
Other: $1,828,000
Health and Hospitals: $1,331,000
General Local Government Support: $106,000
Housing and Community Development: $8,000
- Tax - Property: $13,871,000
General Sales and Gross Receipts: $5,137,000
Occupation and Business License - Other: $78,000
Other License: $62,000
Alcoholic Beverage Sales: $61,000
- Total Salaries and Wages: $22,138,000
- Water Utilities - Interest on Debt: $204,000
Supplemental Security Income (SSI) in 2006:
- Total number of recipients: 1,337
- Number of aged recipients: 216
- Number of blind and disabled recipients: 1,121
- Number of recipients under 18: 239
- Number of recipients between 18 and 64: 690
- Number of recipients older than 64: 408
- Number of recipients also receiving OASDI: 594
- Amount of payments (thousands of dollars): 567
| Most common first names in Hertford County, NC among deceased individuals | ||
| Name | Count | Lived (average) |
|---|---|---|
| William | 239 | 71.7 years |
| James | 237 | 70.9 years |
| Mary | 159 | 77.7 years |
| John | 155 | 72.4 years |
| George | 102 | 72.3 years |
| Willie | 101 | 70.9 years |
| Robert | 93 | 68.9 years |
| Annie | 93 | 81.1 years |
| Joseph | 68 | 72.9 years |
| Thomas | 58 | 68.7 years |
| Most common last names in Hertford County, NC among deceased individuals | ||
| Last name | Count | Lived (average) |
|---|---|---|
| Parker | 160 | 75.3 years |
| Vaughan | 117 | 73.7 years |
| Jones | 102 | 73.1 years |
| Harrell | 96 | 73.5 years |
| Hall | 90 | 74.3 years |
| Williams | 86 | 72.4 years |
| Lassiter | 79 | 73.5 years |
| Askew | 79 | 73.2 years |
| Holloman | 78 | 75.6 years |
| Newsome | 77 | 73.9 years |
| Businesses in Hertford County, NC | ||||
| Name | Count | Name | Count | |
|---|---|---|---|---|
| Ace Hardware | 2 | Lane Furniture | 1 | |
| Advance Auto Parts | 2 | McDonald's | 2 | |
| Burger King | 1 | Nike | 2 | |
| CVS | 1 | Pizza Hut | 1 | |
| Chevrolet | 1 | RadioShack | 1 | |
| Domino's Pizza | 1 | Rite Aid | 1 | |
| Dunkin Donuts | 1 | Subway | 2 | |
| FedEx | 1 | Taco Bell | 1 | |
| Ford | 1 | U-Haul | 3 | |
| H&R Block | 2 | U.S. Cellular | 3 | |
| Jones New York | 2 | UPS | 2 | |
| KFC | 1 | Walmart | 1 | |
| La-Z-Boy | 1 | Wendy's | 1 | |
Hertford County on our top lists:
- #80 on the list of "Top 101 counties with highest percentage of residents voting for Obama (Democrat) in the 2012 Presidential Election"