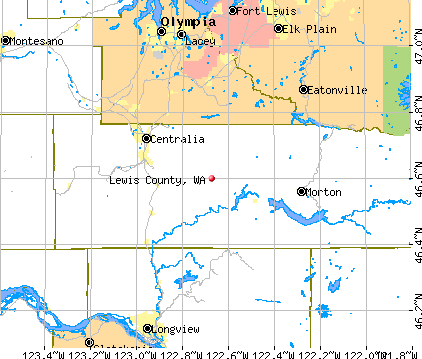
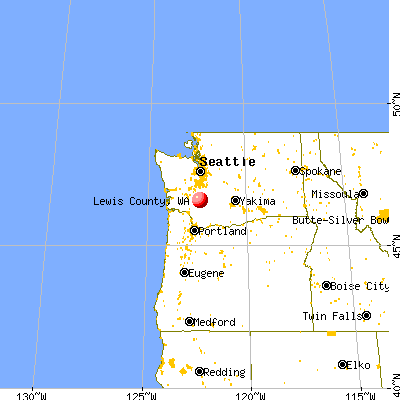
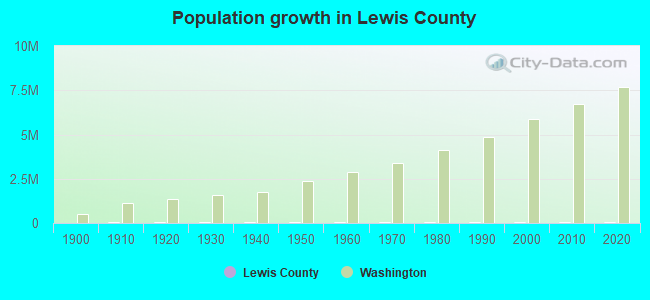
Lewis County, Washington (WA)
County owner-occupied free and clear houses and condos in 2010: 7,553
County owner-occupied houses and condos in 2000: 18,791
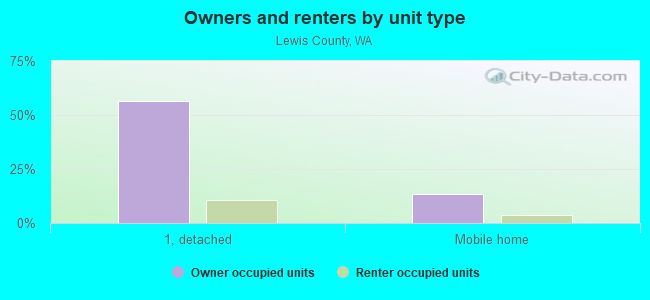
Renter-occupied apartments: 8,950 (it was 7,515 in 2000)
| % of renters here: | 29% |
| State: | 36% |
Land area: 2408 sq. mi.
Water area: 28.6 sq. mi.
Population density: 35 people per square mile (low).
Industries providing employment: Educational, health and social services (21.7%), Retail trade (12.8%).
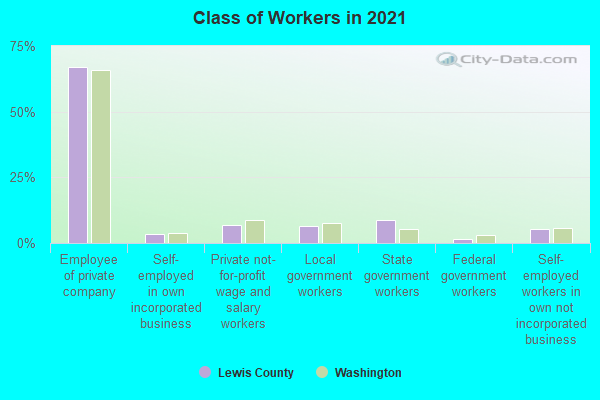
Type of workers:
- Private wage or salary: 74%
- Government: 19%
- Self-employed, not incorporated: 6%
- Unpaid family work: 0%
- OSM Map
- General Map
- Google Map
- MSN Map

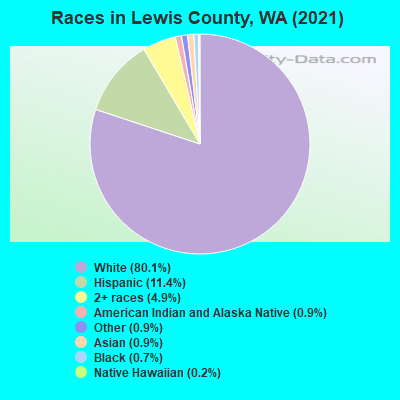
- 67,85979.5%White Non-Hispanic Alone
- 9,97211.7%Hispanic or Latino
- 4,1134.8%Two or more races
- 1,0311.2%American Indian and Alaska Native alone
- 9601.1%Asian alone
- 7060.8%Black Non-Hispanic Alone
- 4930.6%Native Hawaiian and Other
Pacific Islander alone - 2360.3%Some other race alone
| Median resident age: | 42.4 years |
| Washington median age: | 38.4 years |
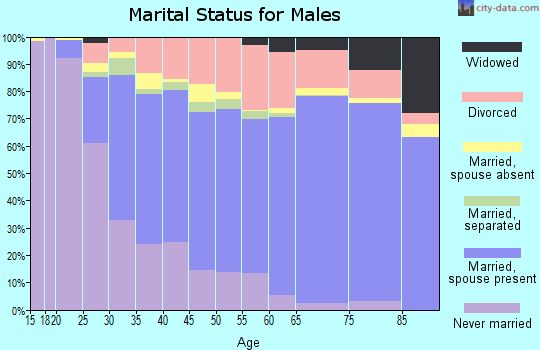
| Males: 43,022 | |
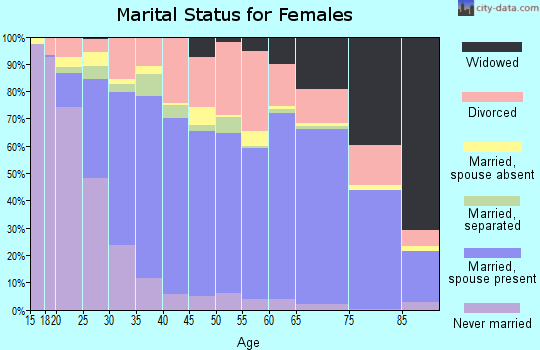
| Females: 42,348 |

 | Washington Weather - Daily Weather pics and reports! (2547 replies) |
| Never-Trump discussion group in South Puget Sound region? (39 replies) |
| Help me narrow down some areas? (91 replies) |
| New airport near Tumwater? (47 replies) |
| Tell me about the weather, please (124 replies) |
| So no masks for the vaccinated (or those pretending)... which are going mask-free? (191 replies) |
| Lewis County: | 2.0 people |
| Washington: | 3 people |
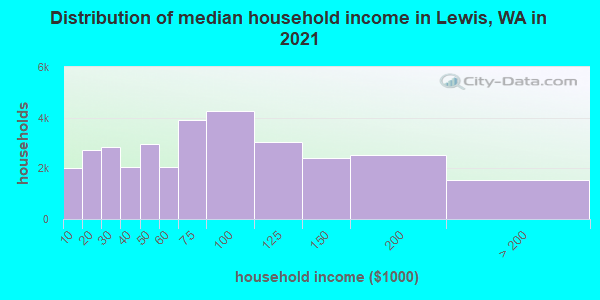
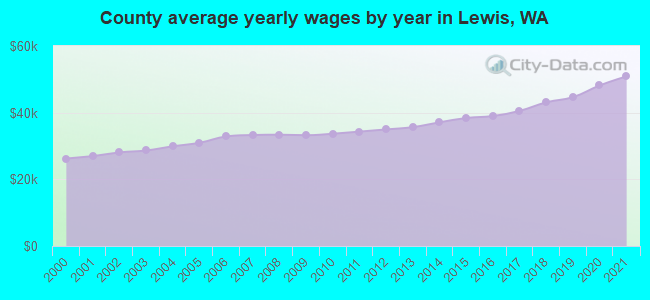
Estimated median household income in 2022: $69,067 ($35,511 in 1999)
| This county: | $69,067 |
| Washington: | $91,306 |
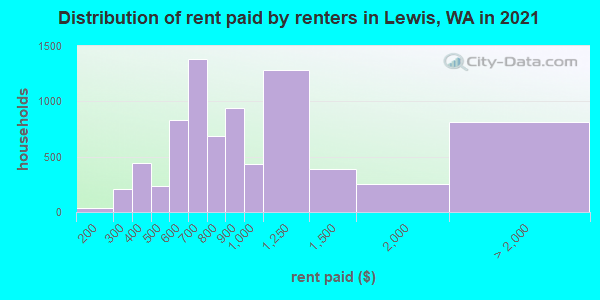
Median contract rent in 2022 for apartments: $857 (lower quartile is $625, upper quartile is $1,103)
| This county: | $857 |
| State: | $1495 |
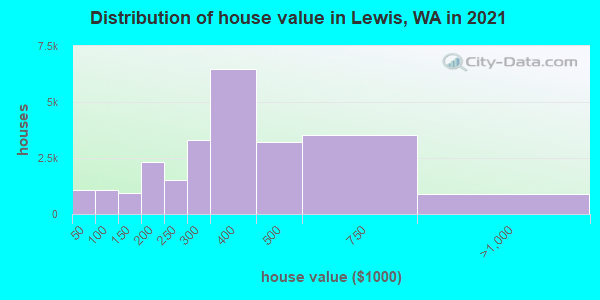
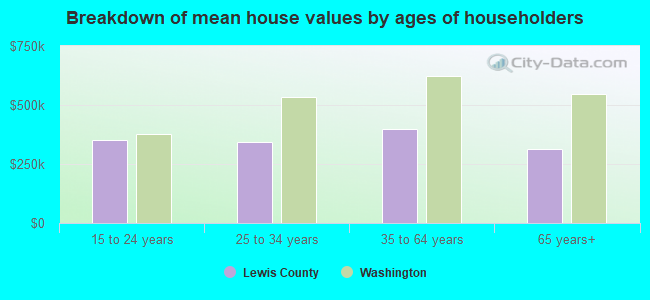
Estimated median house or condo value in 2022: $379,200 (it was $114,200 in 2000)
| Lewis: | $379,200 |
| Washington: | $569,500 |
Mean price in 2022:
Median monthly housing costs for homes and condos with a mortgage: $1,637Detached houses: $412,728
Here: $412,728 State: $734,307 Townhouses or other attached units: $208,842
Here: $208,842 State: $657,697 In 2-unit structures: $276,072
Here: $276,072 State: $534,634 In 3-to-4-unit structures: $295,255
Here: $295,255 State: $510,239 In 5-or-more-unit structures: $233,707
Here: $233,707 State: $503,183 Mobile homes: $266,018
Here: $266,018 State: $218,362 Occupied boats, RVs, vans, etc.: $88,764
Here: $88,764 State: $159,523
Median monthly housing costs for units without a mortgage: $553
Institutionalized population: 689
Crime in 2021 (reported by the sheriff's office or county police, not the county total):
- Murders: 0
- Rapes: 24
- Robberies: 1
- Assaults: 58
- Burglaries: 220
- Thefts: 367
- Auto thefts: 68
Crime in 2020 (reported by the sheriff's office or county police, not the county total):
- Murders: 2
- Rapes: 11
- Robberies: 5
- Assaults: 49
- Burglaries: 133
- Thefts: 223
- Auto thefts: 31
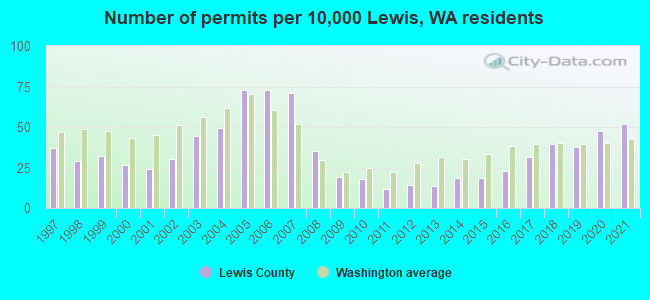
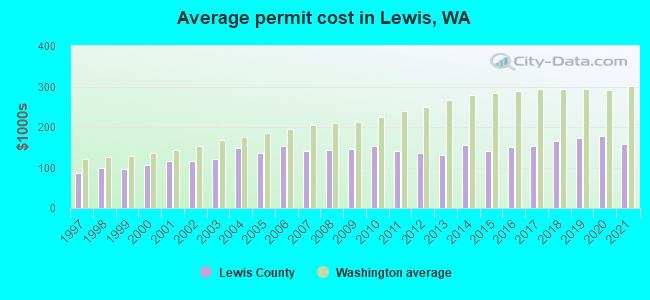
Single-family new house construction building permits:
- 2022: 324 buildings, average cost: $149,800
- 2021: 354 buildings, average cost: $156,900
- 2020: 327 buildings, average cost: $176,900
- 2019: 260 buildings, average cost: $171,500
- 2018: 271 buildings, average cost: $165,400
- 2017: 218 buildings, average cost: $154,100
- 2016: 156 buildings, average cost: $150,800
- 2015: 129 buildings, average cost: $139,800
- 2014: 129 buildings, average cost: $155,400
- 2013: 95 buildings, average cost: $132,100
- 2012: 97 buildings, average cost: $135,300
- 2011: 82 buildings, average cost: $140,800
- 2010: 124 buildings, average cost: $152,500
- 2009: 132 buildings, average cost: $145,600
- 2008: 243 buildings, average cost: $141,800
- 2007: 487 buildings, average cost: $139,900
- 2006: 499 buildings, average cost: $152,500
- 2005: 499 buildings, average cost: $135,800
- 2004: 337 buildings, average cost: $147,300
- 2003: 306 buildings, average cost: $121,600
- 2002: 209 buildings, average cost: $116,900
- 2001: 166 buildings, average cost: $114,700
- 2000: 182 buildings, average cost: $104,700
- 1999: 222 buildings, average cost: $95,500
- 1998: 197 buildings, average cost: $99,900
- 1997: 253 buildings, average cost: $87,400
Median real estate property taxes paid for housing units with mortgages in 2022: $2,508 (0.6%)
Median real estate property taxes paid for housing units with no mortgage in 2022: $2,291 (0.6%)
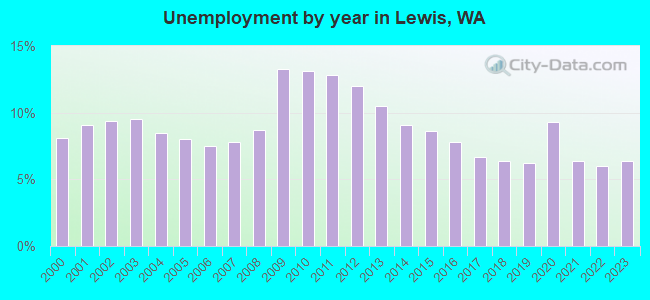
| Lewis County: | 10.4% |
| Washington: | 10.0% |
Median age of residents in 2022: 42.4 years old
(Males: 40.7 years old, Females: 42.9 years old)
(Median age for: White residents: 45.9 years old, Black residents: 62.5 years old, American Indian residents: 51.0 years old, Asian residents: 57.2 years old, Hispanic or Latino residents: 21.8 years old, Other race residents: 23.2 years old)
Fair market rent in 2006 for a 1-bedroom apartment in Lewis County is $522 a month.
Fair market rent for a 2-bedroom apartment is $627 a month.
Fair market rent for a 3-bedroom apartment is $838 a month.
Cities in this county include: Centralia, Chehalis, Boistfort, Jackson Prairie, Mineral, Olequa, Logan Hill, Big Bottom, Ethel, Bunker.
2023 air pollution in Lewis County:
Particulate Matter (PM2.5) Annual: 4.6 µg/m3(standard limit: 15.0 µg/m3). Below U.S. average.
Notable locations in this county outside city limits:
Notable locations in Lewis County: Adamson Ranch (A), Beeker Ranch (B), Blaney Lookout (C), Camp One (D), Grays River State Fish Hatchery (E), Christon Ranch (F), Gile Ranch (G), Goulter Ranch (H), Johnson Ranch (I), Holm Ranch (J), Holton Ranch (K), Hull Creek Lookout (L), Johnson Ranch (M), Kyle Ranch (N), Lagergren Ranch (O), Willapa Harbor Recreation Vehicle Park (P), Forks Creek Hatchery (Q), Nemah Hatchery (R), Loomis Ranch (S), Sunshine (T). Display/hide their locations on the map
Churches in Lewis County include: Saint Mary's Catholic Church (A), Lutheran Church of Twin Harbors (B), Anchor Baptist Mission (C), Kingdom Hall of Jehovahs Witnesses (D), The Church of Jesus Christ of Latter Day Saints (E), New Hope Baptist Church (F), Ocean Park Lutheran Church (G), Willapa Harbor Christian Church (H), Grace Family Fellowship Church (I). Display/hide their locations on the map
Cemeteries: Ilwaco Cemetery (1), Paceful Hill Cemetery (2), Lone Fir Cemetery (3), Fern Hill Cemetery (4). Display/hide their locations on the map
Lakes, reservoirs, and swamps: Litschke Lake (A), Long Lake (B), Loomis Lake (C), Lost Lake (D), Mallard Lake (E), Grays River Salmon Pond (F), Pauls Lake (G), Breaker Lake (H). Display/hide their locations on the map
Streams, rivers, and creeks: Schlick Creek (A), Tarlatt Slough (B), Penny Creek (C), Albers Slough (D), Baldwin Slough (E), Bean Creek (F), Bear Branch (G), Bear River (H), Blaney Creek (I). Display/hide their locations on the map
Parks in Lewis County include: Leadbetter Point State Park (1), Loomis Lake State Park (2), Willie Keils Grave State Park (3), Cape Disappointment State Park (4), Fort Columbia State Park (5), Grayland Beach State Park (6), Palix State Wildlife Recreation Area (7), Willapa National Wildlife Refuge (8), Smith Creek State Wildlife Recreation Area (9). Display/hide their locations on the map
Neighboring counties: Cowlitz County  , Crow Wing County, Minnesota
  , Mercer County, North Dakota .
| Here: | 6.3% |
| Washington: | 4.6% |
Current college students: 2,619
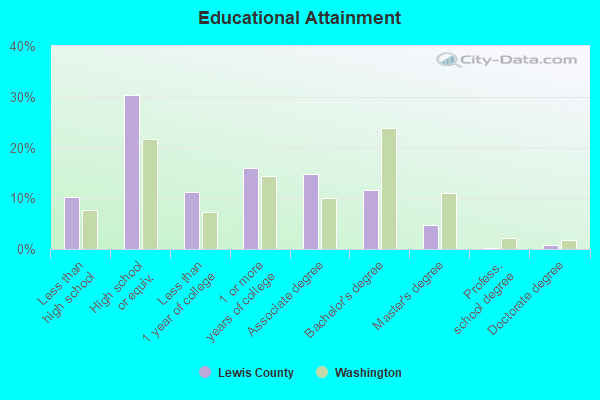
People 25 years of age or older with a high school degree or higher: 89.1%
People 25 years of age or older with a bachelor's degree or higher: 21.3%
Number of foreign born residents: 4,843 (46.3% naturalized citizens)
| Lewis County: | 5.7% |
| Whole state: | 15.3% |
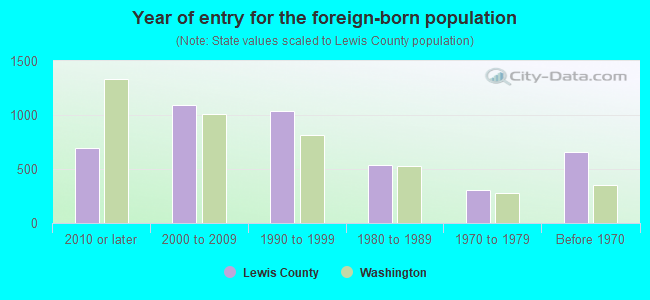
- Year of entry for the foreign-born population
- 6432010 or later
- 1,1582000 to 2009
- 1,1271990 to 1999
- 5391980 to 1989
- 3021970 to 1979
- 654Before 1970
Mean travel time to work (commute): minutes
Percentage of county residents living and working in this county: 98.9%
Housing units in structures:
- One, detached: 26,095
- One, attached: 529
- Two: 803
- 3 or 4: 913
- 5 to 9: 563
- 10 to 19: 715
- 20 to 49: 1,486
- 50 or more: 411
- Mobile homes: 4,535
- Boats, RVs, vans, etc.: 320
Housing units in Lewis County with a mortgage: 14,519 (961 second mortgage, 0 home equity loan, 859 both second mortgage and home equity loan)
Houses without a mortgage: 302
| Here: | 4.4% with mortgage |
| State: | 98.0% with mortgage |
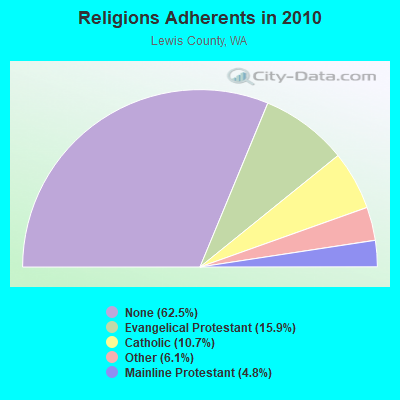
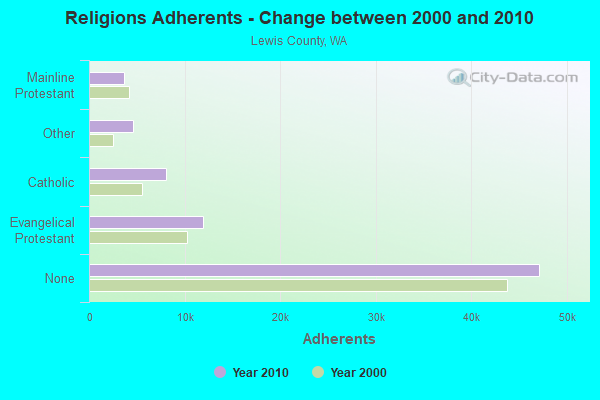
Religion statistics for Lewis County
| Religion | Adherents | Congregations |
|---|---|---|
| Evangelical Protestant | 11,961 | 66 |
| Catholic | 8,102 | 10 |
| Other | 4,637 | 16 |
| Mainline Protestant | 3,621 | 20 |
| None | 47,134 | - |
Source: Clifford Grammich, Kirk Hadaway, Richard Houseal, Dale E.Jones, Alexei Krindatch, Richie Stanley and Richard H.Taylor. 2012. 2010 U.S.Religion Census: Religious Congregations & Membership Study. Association of Statisticians of American Religious Bodies. Jones, Dale E., et al. 2002. Congregations and Membership in the United States 2000. Nashville, TN: Glenmary Research Center.
Food Environment Statistics:
| Lewis County: | 3.54 / 10,000 pop. |
| State: | 2.06 / 10,000 pop. |
| This county: | 1.63 / 10,000 pop. |
| Washington: | 1.18 / 10,000 pop. |
| Lewis County: | 5.17 / 10,000 pop. |
| Washington: | 2.67 / 10,000 pop. |
| This county: | 8.16 / 10,000 pop. |
| State: | 8.26 / 10,000 pop. |
| Lewis County: | 9.8% |
| Washington: | 7.7% |
| Lewis County: | 34.4% |
| State: | 25.7% |
| Here: | 10.0% |
| State: | 13.9% |
Agriculture in Lewis County:
Average size of farms: 93 acresAverage value of agricultural products sold per farm: $63,802
Average value of crops sold per acre for harvested cropland: $550.21
The value of nursery, greenhouse, floriculture, and sod as a percentage of the total market value of agricultural products sold: 9.23%
The value of livestock, poultry, and their products as a percentage of the total market value of agricultural products sold: 76.03%
Average total farm production expenses per farm: $52,468
Harvested cropland as a percentage of land in farms: 29.76%
Irrigated harvested cropland as a percentage of land in farms: 14.47%
Average market value of all machinery and equipment per farm: $34,546
The percentage of farms operated by a family or individual: 93.08%
Average age of principal farm operators: 57 years
Average number of cattle and calves per 100 acres of all land in farms: 24.37
Milk cows as a percentage of all cattle and calves: 28.24%
Vegetables: 2,344 harvested acres
Land in orchards: 257 acres
Earthquake activity:
Lewis County-area historical earthquake activity is significantly above Washington state average. It is 1470% greater than the overall U.S. average.On 4/13/1949 at 19:55:42, a magnitude 7.0 (7.0 UK, Class: Major, Intensity: VIII - XII) earthquake occurred 46.0 miles away from Lewis County center, causing $80,000,000 total damage
On 2/28/2001 at 18:54:32, a magnitude 6.8 (6.5 MB, 6.6 MS, 6.8 MW, Class: Strong, Intensity: VII - IX) earthquake occurred 34.5 miles away from the county center, causing $2,000,000,000 total damage and $305,000,000 insured losses
On 2/28/2001 at 18:54:32, a magnitude 6.8 (6.8 MD, Depth: 32.2 mi) earthquake occurred 38.3 miles away from the county center
On 4/29/1965 at 15:28:43, a magnitude 6.6 (6.6 UK) earthquake occurred 52.5 miles away from the county center, causing $28,000,000 total damage
On 7/3/1999 at 01:43:54, a magnitude 5.8 (5.4 MB, 5.5 MS, 5.8 MW, 5.3 ME, Depth: 25.2 mi, Class: Moderate, Intensity: VI - VII) earthquake occurred 41.5 miles away from Lewis County center
On 1/31/1922 at 13:17:28, a magnitude 7.6 (7.6 UK) earthquake occurred 432.4 miles away from the county center
Magnitude types: body-wave magnitude (MB), duration magnitude (MD), energy magnitude (ME), surface-wave magnitude (MS), moment magnitude (MW)
Most recent natural disasters:
- Washington Covid-19 Pandemic, Incident Period: January 20, 2020, Major Disaster (Presidential) Declared DR-4481-WA: March 22, 2020, FEMA Id: 4481, Natural disaster type: Other
- Washington Severe Storms, Flooding, Landslides, And Mudslides, Incident Period: January 20, 2020 - February 10, 2020, FEMA Id: 4539, Natural disaster type: Storm, Mudslide, Landslide, Flood
- Washington Severe Winter Storms, Flooding, Landslides, And Mudslides, Incident Period: January 30, 2017 - February 22, 2017, FEMA Id: 4309, Natural disaster type: Winter Storm, Mudslide, Landslide, Flood
- Washington Severe Winter Storm, Straight-Line Winds, Flooding, Landslides, Mudslides, and a Tornado, Incident Period: December 01, 2015 to December 14, 2015, Major Disaster (Presidential) Declared DR-4253: February 02, 2016, FEMA Id: 4253, Natural disaster type: Winter Storm, Tornado, Mudslide, Landslide, Flood, Wind
- Washington Severe Storms, Straight-line Winds, Flooding, Landslides, and Mudslides, Incident Period: November 12, 2015 to November 21, 2015, Major Disaster (Presidential) Declared DR-4249: January 15, 2016, FEMA Id: 4249, Natural disaster type: Storm, Mudslide, Landslide, Flood, Wind
- Washington Severe Winter Storm, Flooding, Landslides, and Mudslides, Incident Period: January 14, 2012 to January 23, 2012, Major Disaster (Presidential) Declared DR-4056: March 05, 2012, FEMA Id: 4056, Natural disaster type: Winter Storm, Mudslide, Landslide, Flood
- Washington Severe Winter Storm, Flooding, Landslides, and Mudslides, Incident Period: January 11, 2011 to January 21, 2011, Major Disaster (Presidential) Declared DR-1963: March 25, 2011, FEMA Id: 1963, Natural disaster type: Winter Storm, Mudslide, Landslide, Flood
- Washington Severe Winter Storm, Landslides, Mudslides, and Flooding, Incident Period: January 06, 2009 to January 16, 2009, Major Disaster (Presidential) Declared DR-1817: January 30, 2009, FEMA Id: 1817, Natural disaster type: Winter Storm, Mudslide, Landslide, Flood
- Washington Severe Winter Storm and Record and Near Record Snow, Incident Period: December 12, 2008 to January 05, 2009, Major Disaster (Presidential) Declared DR-1825: March 02, 2009, FEMA Id: 1825, Natural disaster type: Winter Storm, Snow
- Washington Severe Storms, Flooding, Landslides, and Mudslides, Incident Period: December 01, 2007 to December 17, 2007, Major Disaster (Presidential) Declared DR-1734: December 08, 2007, FEMA Id: 1734, Natural disaster type: Storm, Mudslide, Landslide, Flood
- 19 other natural disasters have been reported since 1953.
The number of natural disasters in Lewis County (29) is a lot greater than the US average (15).
Major Disasters (Presidential) Declared: 26
Emergencies Declared: 1
Causes of natural disasters: Floods: 21, Storms: 15, Mudslides: 11, Landslides: 10, Winter Storms: 8, Winds: 4, Snows: 3, Heavy Rains: 2, Earthquake: 1, Hurricane: 1, Tornado: 1, Volcanic Eruption: 1, Other: 1 (Note: some incidents may be assigned to more than one category).
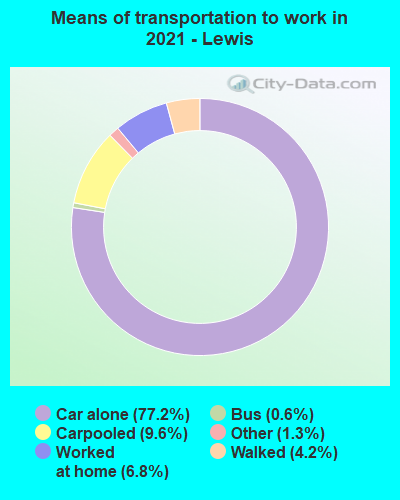
Means of transportation to work:
- Drove a car alone: 22,291 (71.9%)
- Carpooled: 3,049 (9.8%)
- Bus: 112 (0.4%)
- Ferryboat: 2 (0.0%)
- Taxicab, motorcycle, or other means: 363 (1.2%)
- Bicycle: 16 (0.1%)
- Walked: 1,260 (4.1%)
- Worked at home: 3,434 (11.1%)
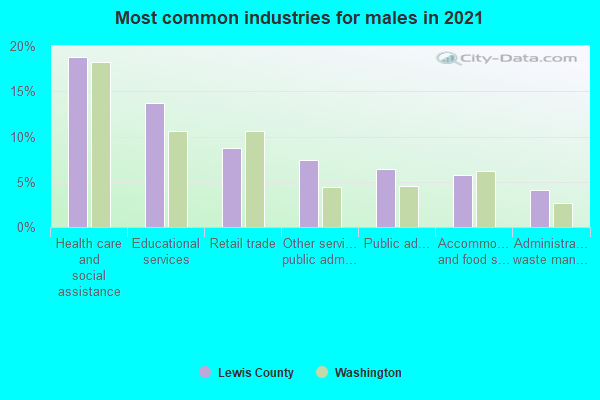
- Health care and social assistance (20%)
- Educational services (9%)
- Public administration (9%)
- Retail trade (8%)
- Accommodation and food services (6%)
- Administrative and support and waste management services (5%)
- Professional, scientific, and technical services (4%)
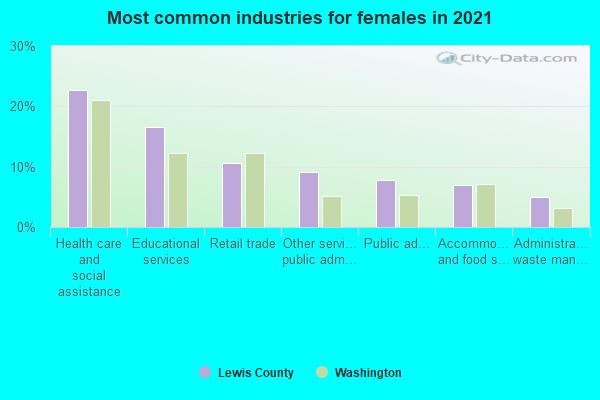
- Health care and social assistance (25%)
- Educational services (12%)
- Public administration (11%)
- Retail trade (10%)
- Accommodation and food services (8%)
- Administrative and support and waste management services (6%)
- Professional, scientific, and technical services (5%)
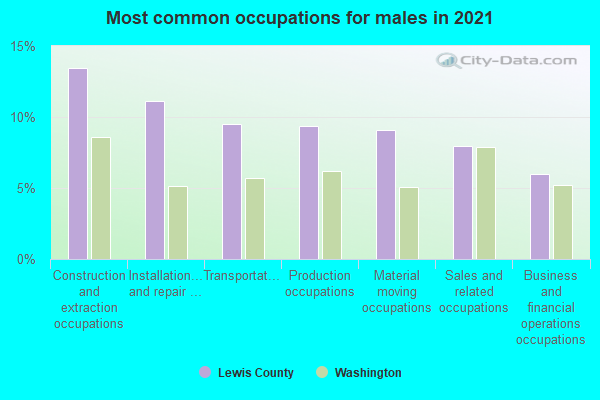
- Construction and extraction occupations (17%)
- Production occupations (12%)
- Transportation occupations (9%)
- Management occupations (7%)
- Installation, maintenance, and repair occupations (6%)
- Material moving occupations (5%)
- Sales and related occupations (5%)
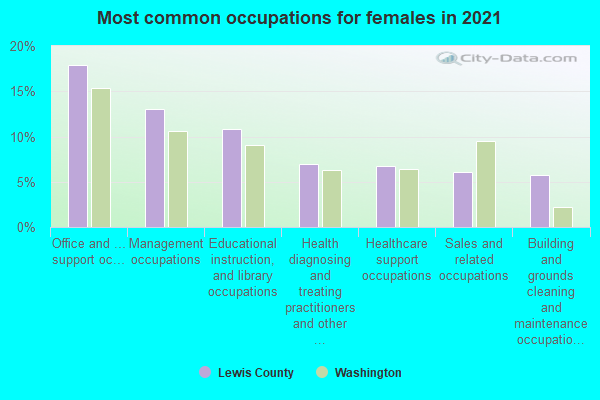
- Office and administrative support occupations (19%)
- Healthcare support occupations (15%)
- Management occupations (10%)
- Sales and related occupations (8%)
- Food preparation and serving related occupations (8%)
- Health diagnosing and treating practitioners and other technical occupations (7%)
- Educational instruction, and library occupations (6%)
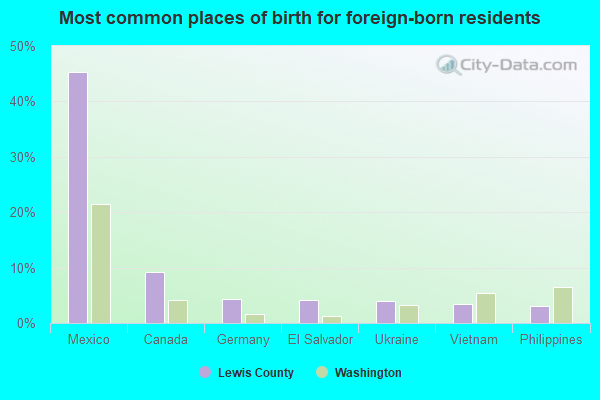
- Mexico (46%)
- Canada (9%)
- Germany (6%)
- Philippines (5%)
- China, excluding Hong Kong and Taiwan (3%)
- Vietnam (3%)
- Korea (3%)
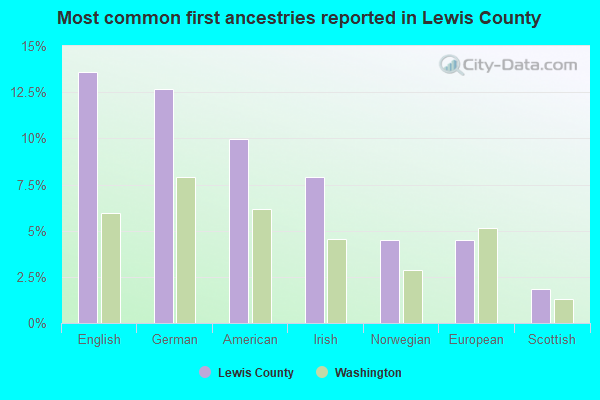
- American (17%)
- English (12%)
- German (12%)
- Irish (7%)
- European (5%)
- Norwegian (4%)
- Scottish (2%)
People in group quarters in Lewis County, Washington in 2010:
- 323 people in nursing facilities/skilled-nursing facilities
- 205 people in correctional facilities intended for juveniles
- 161 people in local jails and other municipal confinement facilities
- 112 people in residential treatment centers for adults
- 73 people in group homes intended for adults
- 37 people in workers' group living quarters and job corps centers
- 24 people in emergency and transitional shelters (with sleeping facilities) for people experiencing homelessness
- 6 people in other noninstitutional facilities
People in group quarters in Lewis County, Washington in 2000:
- 438 people in nursing homes
- 233 people in short-term care, detention or diagnostic centers for delinquent children
- 170 people in local jails and other confinement facilities (including police lockups)
- 130 people in other noninstitutional group quarters
- 44 people in other group homes
- 4 people in mental (psychiatric) hospitals or wards
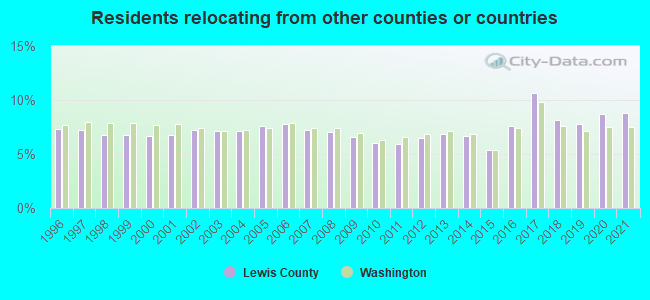
8.79% of this county's 2021 resident taxpayers lived in other counties in 2020 ($59,063 average adjusted gross income)
| Here: | 8.79% |
| Washington average: | 7.53% |
10 or fewer of this county's residents moved from foreign countries.
6.30% relocated from other counties in Washington ($43,508 average AGI)
2.49% relocated from other states ($15,555 average AGI)
Lewis County: 2.49% Washington average: 3.85%
Top counties from which taxpayers relocated into this county between 2020 and 2021:
| from Thurston County, WA | |
| from Pierce County, WA | |
| from King County, WA | |
| from Cowlitz County, WA | |
| from Clark County, WA | |
| from Grays Harbor County, WA | |
| from Snohomish County, WA |
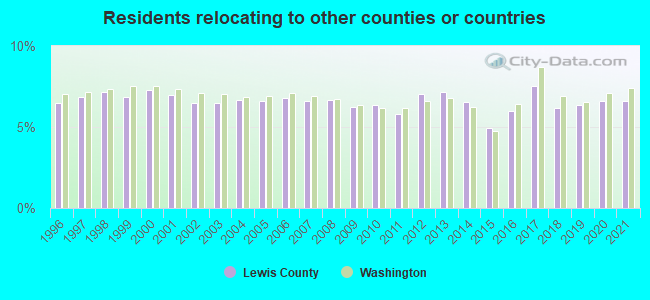
6.63% of this county's 2020 resident taxpayers moved to other counties in 2021 ($51,581 average adjusted gross income)
| Here: | 6.63% |
| Washington average: | 7.40% |
10 or fewer of this county's residents moved to foreign countries.
4.24% relocated to other counties in Washington ($33,011 average AGI)
2.39% relocated to other states ($18,570 average AGI)
Lewis County: 2.39% Washington average: 3.73%
Top counties to which taxpayers relocated from this county between 2020 and 2021:
| to Thurston County, WA | |
| to Pierce County, WA | |
| to Cowlitz County, WA | |
| to King County, WA | |
| to Grays Harbor County, WA | |
| to Clark County, WA | |
| to Snohomish County, WA |
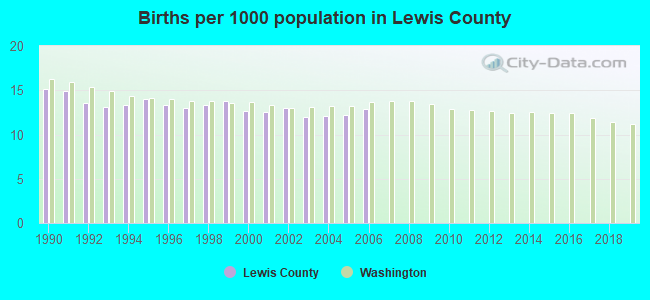
Births per 1000 population from 1990 to 1999: 13.7
Births per 1000 population from 2000 to 2006: 12.5
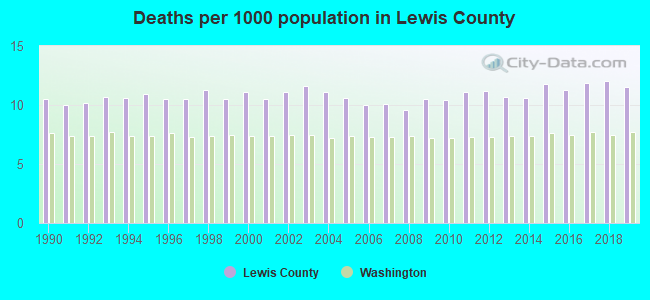
Deaths per 1000 population from 1990 to 1999: 10.6
Deaths per 1000 population from 2000 to 2009: 10.6
Deaths per 1000 population from 2010 to 2020: 11.4
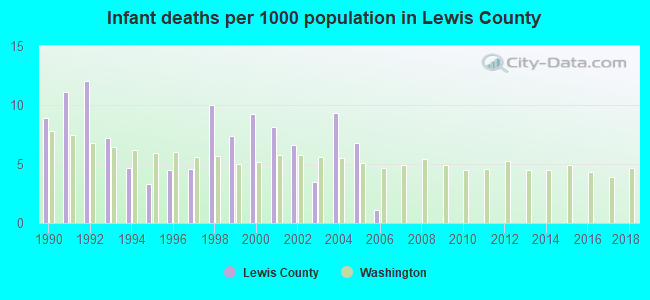
Infant deaths per 1000 live births from 1990 to 1999: 7.4
Infant deaths per 1000 live births from 2000 to 2006: 6.4
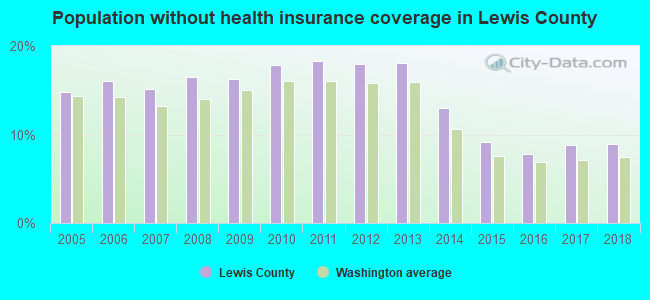
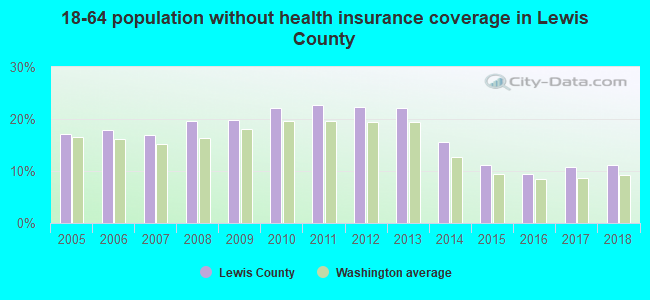
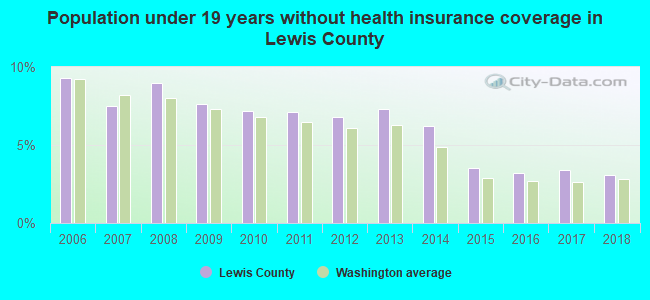
Persons under 19 years old without health insurance coverage in 2018: 3.1%
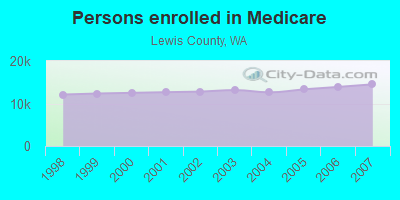
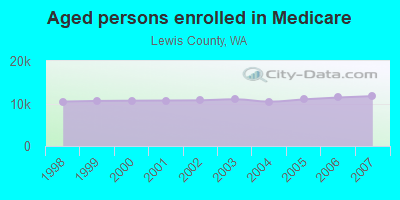
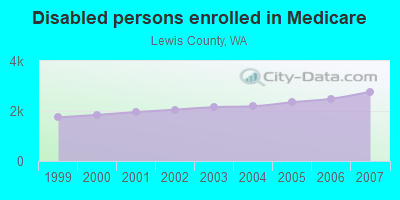
Persons enrolled in hospital insurance and/or supplemental medical insurance (Medicare) in July 1, 2007: 14,511 (11,737 aged, 2,774 disabled)
Children under 18 without health insurance coverage in 2007: 1,653 (9%)
Most common underlying causes of death in Lewis County, Washington in 1999 - 2019:
- Bronchus or lung, unspecified - Malignant neoplasms (1,140)
- Atherosclerotic heart disease (1,074)
- Alzheimer disease, unspecified (998)
- Acute myocardial infarction, unspecified (932)
- Chronic obstructive pulmonary disease, unspecified (847)
- Atherosclerotic cardiovascular disease, so described (793)
- Stroke, not specified as haemorrhage or infarction (422)
- Breast, unspecified - Malignant neoplasms (275)
- Pancreas, unspecified - Malignant neoplasms (239)
- Colon, unspecified - Malignant neoplasms (237)
Population without health insurance coverage in 2000: 16%
Children under 18 without health insurance coverage in 2000: 14%
Short term general hospital admissions per 100,000 population in 2004: 7,895
Short term general hospital beds per 100,000 population in 2004: 203
Emergency room visits per 100,000 population in 2004: 42,085
General practice office based MDs per 100,000 population in 2005: 1,191
Medical specialist MDs per 100,000 population in 2005: 1,118
Dentists per 100,000 population in 1998: 4
Total births per 100,000 population, July 2005 - July 2006 : 32
Total deaths per 100,000 population, July 2005 - July 2006: 84
Limited-service eating places per 100,000 population in 2005 : 10
EPA green book nonattainment status in 2004-2006: 1
Suicides per 1,000,000 population from 2000 to 2006: 201.1. This is more than state average.
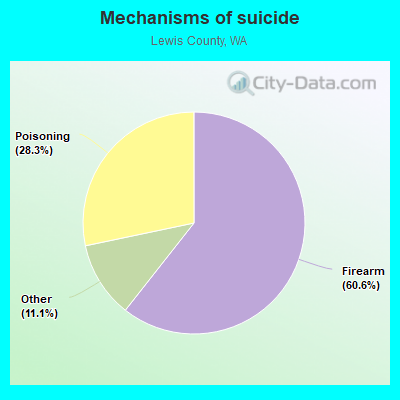
- Firearm - 121.9
- Poisoning - 56.9
- Other - 22.3
Household type by relationship:
Households: 85,370- Male householders: 15,748 (4,872 living alone), Female householders: 16,401 (4,786 living alone)
15,774 spouses (15,713 opposite-sex spouses), 2,699 unmarried partners, (2,338 opposite-sex unmarried partners), 22,808 children (20,651 natural, 808 adopted, 1,349 stepchildren), 3,813 grandchildren, 1,222 brothers or sisters, 692 parents, 453 foster children, 2,336 other relatives, 2,887 non-relatives
- In group quarters: 537
Size of family households: 9,739 2-persons, 3,621 3-persons, 3,631 4-persons, 1,632 5-persons, 1,440 6-persons, 579 7-or-more-persons.
Size of nonfamily households: 9,658 1-person, 1,813 2-persons, 36 3-persons.
9,995 married couples with children.
3,665 single-parent households (1,590 men, 2,075 women).
91.4% of residents of Lewis speak English at home.
6.5% of residents speak Spanish at home (65% speak English very well, 15% speak English well, 12% speak English not well, 8% don't speak English at all).
1.0% of residents speak other Indo-European language at home (78% speak English very well, 19% speak English well, 2% speak English not well, 1% don't speak English at all).
0.8% of residents speak Asian or Pacific Island language at home (59% speak English very well, 23% speak English well, 15% speak English not well, 3% don't speak English at all).
In fiscal year 2004:
Federal Government expenditure: $422,699,000 ($5,909 per capita)
Department of Defense expenditure: $18,183,000
Federal direct payments to individuals for retirement and disability: $215,254,000
Federal other direct payments to individuals: $91,799,000
Federal direct payments not to individuals: $686,000
Federal grants: $90,873,000
Federal procurement contracts: $8,627,000 ($446,000 Department of Defense)
Federal salaries and wages: $15,459,000 ($2,772,000 Department of Defense)
Federal Government direct loans: $1,198,000
Federal guaranteed/insured loans: $59,308,000
Federal Government insurance: $226,836,000
Population change from April 1, 2000 to July 1, 2005:
Births: 4,489| Here: | 62 per 1000 residents |
| State: | 66 per 1000 residents |
Deaths: 4,138
| Here: | 57 per 1000 residents |
| State: | 38 per 1000 residents |
Net international migration: +644
| Here: | +9 per 1000 residents |
| State: | +21 per 1000 residents |
Net internal migration: +2,979
| Here: | +41 per 1000 residents |
| State: | +13 per 1000 residents |
Total withdrawal of fresh water for public supply: 7.05 millions of gallons per day (56% from ground, 44% from surface)
| Here: | 6.1 |
| State: | 6.5 |
| Here: | 4.1 |
| State: | 3.9 |
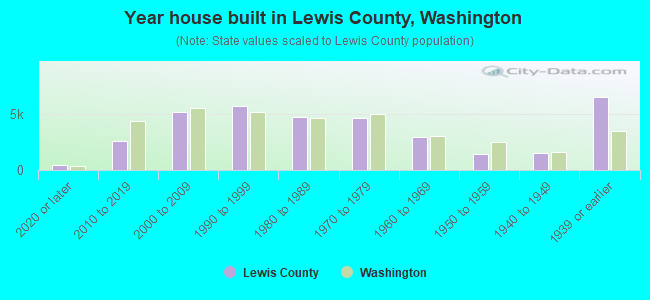
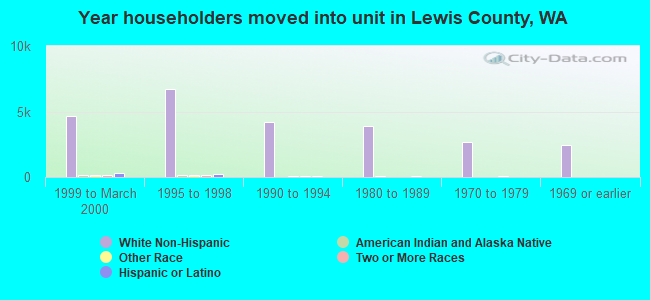
- Year house built in Lewis County, Washington
- 4672020 or later
- 3,1702010 to 2019
- 4,3112000 to 2009
- 6,0521990 to 1999
- 4,8991980 to 1989
- 5,2231970 to 1979
- 2,1241960 to 1969
- 1,8971950 to 1959
- 1,8451940 to 1949
- 6,3821939 or earlier
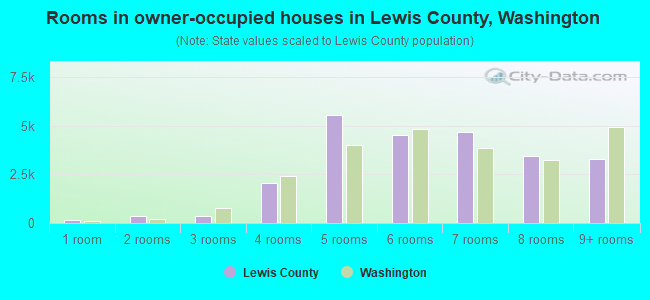
- Rooms in owner-occupied houses in Lewis County, Washington
- 1151 room
- 4902 rooms
- 4463 rooms
- 2,6144 rooms
- 4,6985 rooms
- 6,3086 rooms
- 3,3857 rooms
- 3,6388 rooms
- 3,0949+ rooms
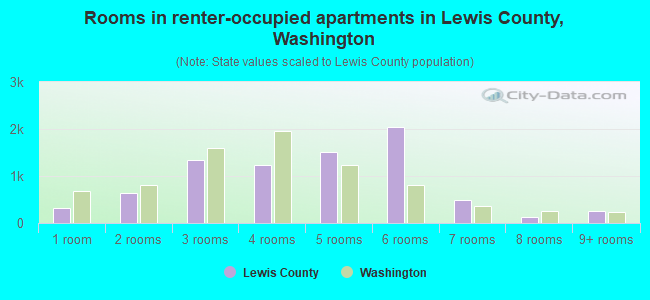
- Rooms in renter-occupied apartments in Lewis County, Washington
- 5451 room
- 6702 rooms
- 1,3683 rooms
- 1,8464 rooms
- 1,8705 rooms
- 4656 rooms
- 747 rooms
- 1998 rooms
- 3249+ rooms
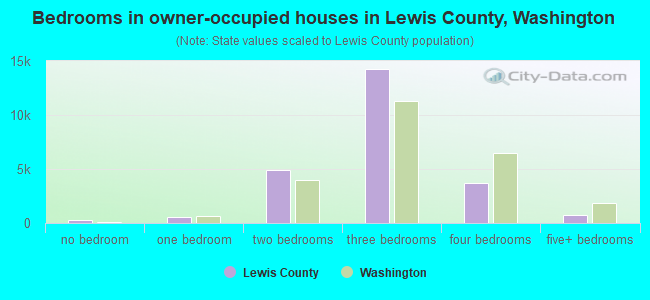
- Bedrooms in owner-occupied houses in Lewis County, Washington
- 171no bedroom
- 9021 bedroom
- 4,0492 bedrooms
- 15,2183 bedrooms
- 3,4374 bedrooms
- 1,0115+ bedrooms
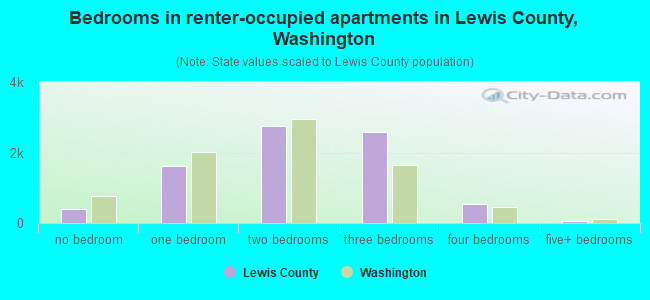
- Bedrooms in renter-occupied apartments in Lewis County, Washington
- 545no bedroom
- 2,2751 bedroom
- 2,8022 bedrooms
- 1,2803 bedrooms
- 2994 bedrooms
- 1605+ bedrooms
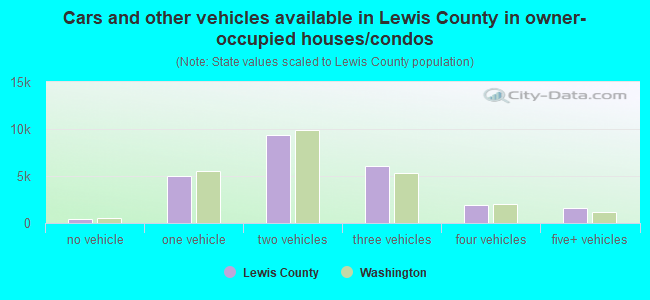
- Cars and other vehicles available in Lewis County in owner-occupied houses/condos
- 547no vehicle
- 4,8121 vehicle
- 7,3602 vehicles
- 6,3733 vehicles
- 3,9254 vehicles
- 1,7715+ vehicles
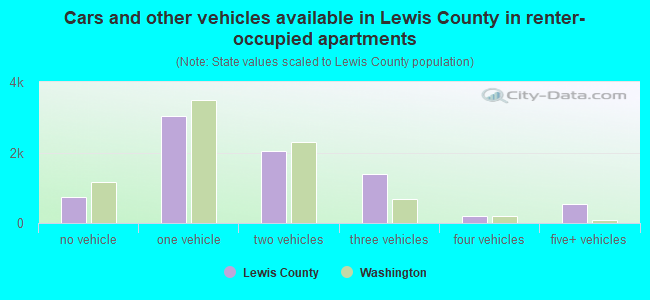
- Cars and other vehicles available in Lewis County in renter-occupied apartments
- 855no vehicle
- 3,3871 vehicle
- 2,3162 vehicles
- 6423 vehicles
- 1164 vehicles
- 455+ vehicles
87.7% of Lewis County residents lived in the same house 1 years ago.
Out of people who lived in different houses, 33% lived in this county.
Out of people who lived in different counties, 65% lived in Washington.
| Lewis County: | 87.7% |
| State average: | 85.2% |
Place of birth for U.S.-born residents:
- This state: 51,833
- Other state: 27,989
- Northeast: 2,280
- Midwest: 3,900
- South: 4,467
- West: 17,342
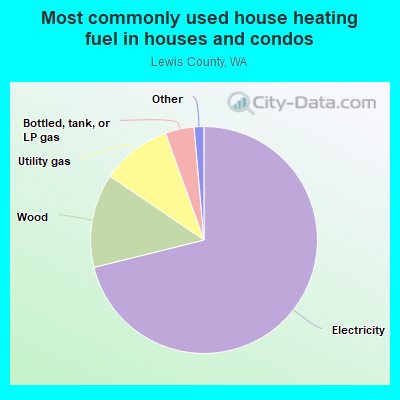
- 71.2%Electricity
- 13.2%Wood
- 10.0%Utility gas
- 3.9%Bottled, tank, or LP gas
- 0.7%Fuel oil, kerosene, etc.
- 0.5%Other fuel
- 0.4%No fuel used
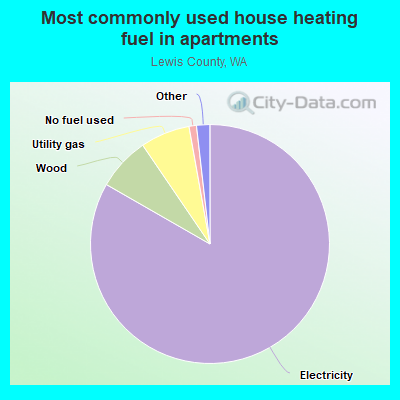
- 85.2%Electricity
- 6.6%Wood
- 5.9%Utility gas
- 0.8%Bottled, tank, or LP gas
- 0.8%No fuel used
- 0.7%Other fuel
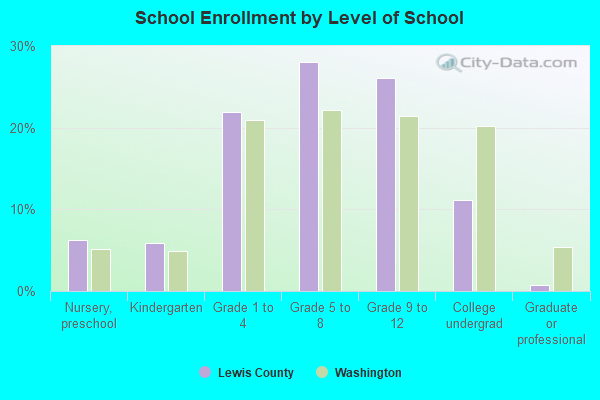
Private vs. public school enrollment:
| Here: | 6.4% |
| Washington: | 12.4% |
| Here: | 9.0% |
| Washington: | 9.2% |
| Here: | 4.8% |
| Washington: | 16.5% |

Lewis County government finances - Expenditure in 2020:
- Charges - Solid Waste Management: $9,715,000
Other: $9,123,000
Other: $8,834,000
Solid Waste Management: $8,774,000
Air Transportation: $1,827,000
Regular Highways: $864,000
Parks and Recreation: $717,000
Parks and Recreation: $671,000
Regular Highways: $353,000
Natural Resources - Other: $21,000
Natural Resources - Other: $18,000
- Construction - Regular Highways: $9,097,000
Regular Highways: $9,006,000
Air Transportation: $2,796,000
Financial Administration: $813,000
General Public Buildings: $688,000
Natural Resources - Other: $445,000
Correctional Institutions: $412,000
General - Other: $396,000
Financial Administration: $330,000
General Public Buildings: $295,000
Natural Resources - Other: $281,000
Correctional Institutions: $206,000
Parks and Recreation: $188,000
Parks and Recreation: $180,000
Health - Other: $165,000
General - Other: $113,000
Police Protection: $2,000
- Current Operations - Regular Highways: $18,931,000
Regular Highways: $17,336,000
Correctional Institutions: $12,445,000
Correctional Institutions: $11,049,000
Solid Waste Management: $9,799,000
Judicial and Legal Services: $9,451,000
Judicial and Legal Services: $9,434,000
Police Protection: $8,716,000
Solid Waste Management: $8,377,000
Police Protection: $7,610,000
Health - Other: $4,976,000
General - Other: $4,520,000
Financial Administration: $4,510,000
Financial Administration: $4,455,000
Health - Other: $4,269,000
General - Other: $4,214,000
Natural Resources - Other: $3,061,000
Central Staff Services: $1,978,000
Natural Resources - Other: $1,848,000
Air Transportation: $1,628,000
Housing and Community Development: $1,498,000
Public Welfare - Other: $1,444,000
Public Welfare - Other: $1,264,000
Protective Inspection and Regulation - Other: $901,000
Housing and Community Development: $806,000
Protective Inspection and Regulation - Other: $751,000
Parks and Recreation: $470,000
Parks and Recreation: $408,000
Water Utilities: $280,000
Water Utilities: $223,000
Air Transportation: $160,000
Corrections - Other: $128,000
Libraries: $40,000
Libraries: $37,000
Central Staff Services: $27,000
Local Fire Protection: $15,000
- Federal Intergovernmental - Air Transportation: $2,404,000
General Local Government Support: $1,250,000
Other: $476,000
Natural Resources: $453,000
General Local Government Support: $430,000
Housing and Community Development: $167,000
Housing and Community Development: $140,000
Highways: $37,000
Natural Resources: $24,000
Other: $17,000
- General - Interest on Debt: $1,909,000
Interest on Debt: $1,843,000
- Intergovernmental to Local - Other - Housing and Community Development: $543,000
Other - Natural Resources - Other: $144,000
Other - Regular Highways: $66,000
Other - Financial Administration: $39,000
Other - Local Fire Protection: $19,000
Other - Health - Other: $12,000
Other - Water Utilities: $10,000
Other - Solid Waste Management: $10,000
Other - Air Transportation: $8,000
Other - General - Other: $6,000
Other - Public Welfare - Other: $3,000
Other - Judicial and Legal Services: $2,000
Other - Police Protection: $1,000
Other - Correctional Institutions: $1,000
- Intergovernmental to State - Natural Resources - Other: $4,000
- Local Intergovernmental - Other: $2,339,000
Other: $2,300,000
- Long Term Debt - Beginning Outstanding - Unspecified Public Purpose: $49,055,000
Beginning Outstanding - Unspecified Public Purpose: $48,224,000
Outstanding Unspecified Public Purpose: $46,291,000
Outstanding Unspecified Public Purpose: $40,394,000
Retired Unspecified Public Purpose: $9,284,000
Retired Unspecified Public Purpose: $5,418,000
Issue, Unspecified Public Purpose: $3,485,000
Issue, Unspecified Public Purpose: $623,000
- Miscellaneous - Sale of Property: $4,405,000
Sale of Property: $1,948,000
General Revenue - Other: $1,925,000
Fines and Forfeits: $1,589,000
Fines and Forfeits: $1,364,000
Interest Earnings: $1,345,000
Rents: $1,062,000
Rents: $1,045,000
General Revenue - Other: $749,000
Special Assessments: $381,000
Donations From Private Sources: $223,000
Donations From Private Sources: $199,000
Special Assessments: $42,000
Interest Earnings: $-1,000
- Other Capital Outlay - Regular Highways: $1,175,000
Regular Highways: $682,000
General - Other: $292,000
Health - Other: $132,000
Natural Resources - Other: $103,000
Financial Administration: $75,000
Air Transportation: $70,000
Judicial and Legal Services: $57,000
General - Other: $57,000
Protective Inspection and Regulation - Other: $54,000
Natural Resources - Other: $47,000
Judicial and Legal Services: $35,000
Financial Administration: $32,000
Correctional Institutions: $31,000
Police Protection: $24,000
Police Protection: $22,000
Health - Other: $14,000
Central Staff Services: $13,000
- Other Funds - Cash and Securities: $1,465,000
Cash and Securities: $474,000
- Revenue - Water Utilities: $325,000
Water Utilities: $286,000
- State Intergovernmental - Other: $10,998,000
Other: $10,060,000
Highways: $9,006,000
Highways: $4,528,000
Health and Hospitals: $2,381,000
Health and Hospitals: $1,783,000
General Local Government Support: $350,000
General Local Government Support: $302,000
Housing and Community Development: $116,000
Housing and Community Development: $35,000
Education: $2,000
- Tax - Property: $25,252,000
Property: $24,072,000
General Sales and Gross Receipts: $14,615,000
General Sales and Gross Receipts: $11,155,000
Severance: $2,504,000
Severance: $2,201,000
Documentary and Stock Transfer: $1,724,000
Documentary and Stock Transfer: $1,681,000
Other License: $1,473,000
Public Utilities Sales: $979,000
Other License: $966,000
Public Utilities Sales: $921,000
Other Selective Sales: $613,000
Motor Vehicle License: $534,000
Other Selective Sales: $477,000
Motor Vehicle License: $438,000
Occupation and Business License - Other: $223,000
Occupation and Business License - Other: $194,000
Other: $152,000
- Total Salaries and Wages: $34,941,000
: $33,179,000
- Water Utilities - Interest on Debt: $86,000
Interest on Debt: $53,000
Lewis County government finances - Revenue in 2020:
- Charges - Solid Waste Management: $9,715,000
Other: $9,123,000
Other: $8,834,000
Solid Waste Management: $8,774,000
Air Transportation: $1,827,000
Regular Highways: $864,000
Parks and Recreation: $717,000
Parks and Recreation: $671,000
Regular Highways: $353,000
Natural Resources - Other: $21,000
Natural Resources - Other: $18,000
- Construction - Regular Highways: $9,097,000
Regular Highways: $9,006,000
Air Transportation: $2,796,000
Financial Administration: $813,000
General Public Buildings: $688,000
Natural Resources - Other: $445,000
Correctional Institutions: $412,000
General - Other: $396,000
Financial Administration: $330,000
General Public Buildings: $295,000
Natural Resources - Other: $281,000
Correctional Institutions: $206,000
Parks and Recreation: $188,000
Parks and Recreation: $180,000
Health - Other: $165,000
General - Other: $113,000
Police Protection: $2,000
- Current Operations - Regular Highways: $18,931,000
Regular Highways: $17,336,000
Correctional Institutions: $12,445,000
Correctional Institutions: $11,049,000
Solid Waste Management: $9,799,000
Judicial and Legal Services: $9,451,000
Judicial and Legal Services: $9,434,000
Police Protection: $8,716,000
Solid Waste Management: $8,377,000
Police Protection: $7,610,000
Health - Other: $4,976,000
General - Other: $4,520,000
Financial Administration: $4,510,000
Financial Administration: $4,455,000
Health - Other: $4,269,000
General - Other: $4,214,000
Natural Resources - Other: $3,061,000
Central Staff Services: $1,978,000
Natural Resources - Other: $1,848,000
Air Transportation: $1,628,000
Housing and Community Development: $1,498,000
Public Welfare - Other: $1,444,000
Public Welfare - Other: $1,264,000
Protective Inspection and Regulation - Other: $901,000
Housing and Community Development: $806,000
Protective Inspection and Regulation - Other: $751,000
Parks and Recreation: $470,000
Parks and Recreation: $408,000
Water Utilities: $280,000
Water Utilities: $223,000
Air Transportation: $160,000
Corrections - Other: $128,000
Libraries: $40,000
Libraries: $37,000
Central Staff Services: $27,000
Local Fire Protection: $15,000
- Federal Intergovernmental - Air Transportation: $2,404,000
General Local Government Support: $1,250,000
Other: $476,000
Natural Resources: $453,000
General Local Government Support: $430,000
Housing and Community Development: $167,000
Housing and Community Development: $140,000
Highways: $37,000
Natural Resources: $24,000
Other: $17,000
- General - Interest on Debt: $1,909,000
Interest on Debt: $1,843,000
- Intergovernmental to Local - Other - Housing and Community Development: $543,000
Other - Natural Resources - Other: $144,000
Other - Regular Highways: $66,000
Other - Financial Administration: $39,000
Other - Local Fire Protection: $19,000
Other - Health - Other: $12,000
Other - Water Utilities: $10,000
Other - Solid Waste Management: $10,000
Other - Air Transportation: $8,000
Other - General - Other: $6,000
Other - Public Welfare - Other: $3,000
Other - Judicial and Legal Services: $2,000
Other - Police Protection: $1,000
Other - Correctional Institutions: $1,000
- Intergovernmental to State - Natural Resources - Other: $4,000
- Local Intergovernmental - Other: $2,339,000
Other: $2,300,000
- Long Term Debt - Beginning Outstanding - Unspecified Public Purpose: $49,055,000
Beginning Outstanding - Unspecified Public Purpose: $48,224,000
Outstanding Unspecified Public Purpose: $46,291,000
Outstanding Unspecified Public Purpose: $40,394,000
Retired Unspecified Public Purpose: $9,284,000
Retired Unspecified Public Purpose: $5,418,000
Issue, Unspecified Public Purpose: $3,485,000
Issue, Unspecified Public Purpose: $623,000
- Miscellaneous - Sale of Property: $4,405,000
Sale of Property: $1,948,000
General Revenue - Other: $1,925,000
Fines and Forfeits: $1,589,000
Fines and Forfeits: $1,364,000
Interest Earnings: $1,345,000
Rents: $1,062,000
Rents: $1,045,000
General Revenue - Other: $749,000
Special Assessments: $381,000
Donations From Private Sources: $223,000
Donations From Private Sources: $199,000
Special Assessments: $42,000
Interest Earnings: $-1,000
- Other Capital Outlay - Regular Highways: $1,175,000
Regular Highways: $682,000
General - Other: $292,000
Health - Other: $132,000
Natural Resources - Other: $103,000
Financial Administration: $75,000
Air Transportation: $70,000
Judicial and Legal Services: $57,000
General - Other: $57,000
Protective Inspection and Regulation - Other: $54,000
Natural Resources - Other: $47,000
Judicial and Legal Services: $35,000
Financial Administration: $32,000
Correctional Institutions: $31,000
Police Protection: $24,000
Police Protection: $22,000
Health - Other: $14,000
Central Staff Services: $13,000
- Other Funds - Cash and Securities: $1,465,000
Cash and Securities: $474,000
- Revenue - Water Utilities: $325,000
Water Utilities: $286,000
- State Intergovernmental - Other: $10,998,000
Other: $10,060,000
Highways: $9,006,000
Highways: $4,528,000
Health and Hospitals: $2,381,000
Health and Hospitals: $1,783,000
General Local Government Support: $350,000
General Local Government Support: $302,000
Housing and Community Development: $116,000
Housing and Community Development: $35,000
Education: $2,000
- Tax - Property: $25,252,000
Property: $24,072,000
General Sales and Gross Receipts: $14,615,000
General Sales and Gross Receipts: $11,155,000
Severance: $2,504,000
Severance: $2,201,000
Documentary and Stock Transfer: $1,724,000
Documentary and Stock Transfer: $1,681,000
Other License: $1,473,000
Public Utilities Sales: $979,000
Other License: $966,000
Public Utilities Sales: $921,000
Other Selective Sales: $613,000
Motor Vehicle License: $534,000
Other Selective Sales: $477,000
Motor Vehicle License: $438,000
Occupation and Business License - Other: $223,000
Occupation and Business License - Other: $194,000
Other: $152,000
- Total Salaries and Wages: $34,941,000
: $33,179,000
- Water Utilities - Interest on Debt: $86,000
Interest on Debt: $53,000
Lewis County government finances - Debt in 2020:
- Charges - Solid Waste Management: $9,715,000
Other: $9,123,000
Other: $8,834,000
Solid Waste Management: $8,774,000
Air Transportation: $1,827,000
Regular Highways: $864,000
Parks and Recreation: $717,000
Parks and Recreation: $671,000
Regular Highways: $353,000
Natural Resources - Other: $21,000
Natural Resources - Other: $18,000
- Construction - Regular Highways: $9,097,000
Regular Highways: $9,006,000
Air Transportation: $2,796,000
Financial Administration: $813,000
General Public Buildings: $688,000
Natural Resources - Other: $445,000
Correctional Institutions: $412,000
General - Other: $396,000
Financial Administration: $330,000
General Public Buildings: $295,000
Natural Resources - Other: $281,000
Correctional Institutions: $206,000
Parks and Recreation: $188,000
Parks and Recreation: $180,000
Health - Other: $165,000
General - Other: $113,000
Police Protection: $2,000
- Current Operations - Regular Highways: $18,931,000
Regular Highways: $17,336,000
Correctional Institutions: $12,445,000
Correctional Institutions: $11,049,000
Solid Waste Management: $9,799,000
Judicial and Legal Services: $9,451,000
Judicial and Legal Services: $9,434,000
Police Protection: $8,716,000
Solid Waste Management: $8,377,000
Police Protection: $7,610,000
Health - Other: $4,976,000
General - Other: $4,520,000
Financial Administration: $4,510,000
Financial Administration: $4,455,000
Health - Other: $4,269,000
General - Other: $4,214,000
Natural Resources - Other: $3,061,000
Central Staff Services: $1,978,000
Natural Resources - Other: $1,848,000
Air Transportation: $1,628,000
Housing and Community Development: $1,498,000
Public Welfare - Other: $1,444,000
Public Welfare - Other: $1,264,000
Protective Inspection and Regulation - Other: $901,000
Housing and Community Development: $806,000
Protective Inspection and Regulation - Other: $751,000
Parks and Recreation: $470,000
Parks and Recreation: $408,000
Water Utilities: $280,000
Water Utilities: $223,000
Air Transportation: $160,000
Corrections - Other: $128,000
Libraries: $40,000
Libraries: $37,000
Central Staff Services: $27,000
Local Fire Protection: $15,000
- Federal Intergovernmental - Air Transportation: $2,404,000
General Local Government Support: $1,250,000
Other: $476,000
Natural Resources: $453,000
General Local Government Support: $430,000
Housing and Community Development: $167,000
Housing and Community Development: $140,000
Highways: $37,000
Natural Resources: $24,000
Other: $17,000
- General - Interest on Debt: $1,909,000
Interest on Debt: $1,843,000
- Intergovernmental to Local - Other - Housing and Community Development: $543,000
Other - Natural Resources - Other: $144,000
Other - Regular Highways: $66,000
Other - Financial Administration: $39,000
Other - Local Fire Protection: $19,000
Other - Health - Other: $12,000
Other - Water Utilities: $10,000
Other - Solid Waste Management: $10,000
Other - Air Transportation: $8,000
Other - General - Other: $6,000
Other - Public Welfare - Other: $3,000
Other - Judicial and Legal Services: $2,000
Other - Police Protection: $1,000
Other - Correctional Institutions: $1,000
- Intergovernmental to State - Natural Resources - Other: $4,000
- Local Intergovernmental - Other: $2,339,000
Other: $2,300,000
- Long Term Debt - Beginning Outstanding - Unspecified Public Purpose: $49,055,000
Beginning Outstanding - Unspecified Public Purpose: $48,224,000
Outstanding Unspecified Public Purpose: $46,291,000
Outstanding Unspecified Public Purpose: $40,394,000
Retired Unspecified Public Purpose: $9,284,000
Retired Unspecified Public Purpose: $5,418,000
Issue, Unspecified Public Purpose: $3,485,000
Issue, Unspecified Public Purpose: $623,000
- Miscellaneous - Sale of Property: $4,405,000
Sale of Property: $1,948,000
General Revenue - Other: $1,925,000
Fines and Forfeits: $1,589,000
Fines and Forfeits: $1,364,000
Interest Earnings: $1,345,000
Rents: $1,062,000
Rents: $1,045,000
General Revenue - Other: $749,000
Special Assessments: $381,000
Donations From Private Sources: $223,000
Donations From Private Sources: $199,000
Special Assessments: $42,000
Interest Earnings: $-1,000
- Other Capital Outlay - Regular Highways: $1,175,000
Regular Highways: $682,000
General - Other: $292,000
Health - Other: $132,000
Natural Resources - Other: $103,000
Financial Administration: $75,000
Air Transportation: $70,000
Judicial and Legal Services: $57,000
General - Other: $57,000
Protective Inspection and Regulation - Other: $54,000
Natural Resources - Other: $47,000
Judicial and Legal Services: $35,000
Financial Administration: $32,000
Correctional Institutions: $31,000
Police Protection: $24,000
Police Protection: $22,000
Health - Other: $14,000
Central Staff Services: $13,000
- Other Funds - Cash and Securities: $1,465,000
Cash and Securities: $474,000
- Revenue - Water Utilities: $325,000
Water Utilities: $286,000
- State Intergovernmental - Other: $10,998,000
Other: $10,060,000
Highways: $9,006,000
Highways: $4,528,000
Health and Hospitals: $2,381,000
Health and Hospitals: $1,783,000
General Local Government Support: $350,000
General Local Government Support: $302,000
Housing and Community Development: $116,000
Housing and Community Development: $35,000
Education: $2,000
- Tax - Property: $25,252,000
Property: $24,072,000
General Sales and Gross Receipts: $14,615,000
General Sales and Gross Receipts: $11,155,000
Severance: $2,504,000
Severance: $2,201,000
Documentary and Stock Transfer: $1,724,000
Documentary and Stock Transfer: $1,681,000
Other License: $1,473,000
Public Utilities Sales: $979,000
Other License: $966,000
Public Utilities Sales: $921,000
Other Selective Sales: $613,000
Motor Vehicle License: $534,000
Other Selective Sales: $477,000
Motor Vehicle License: $438,000
Occupation and Business License - Other: $223,000
Occupation and Business License - Other: $194,000
Other: $152,000
- Total Salaries and Wages: $34,941,000
: $33,179,000
- Water Utilities - Interest on Debt: $86,000
Interest on Debt: $53,000
Lewis County government finances - Cash and Securities in 2020:
- Charges - Solid Waste Management: $9,715,000
Other: $9,123,000
Other: $8,834,000
Solid Waste Management: $8,774,000
Air Transportation: $1,827,000
Regular Highways: $864,000
Parks and Recreation: $717,000
Parks and Recreation: $671,000
Regular Highways: $353,000
Natural Resources - Other: $21,000
Natural Resources - Other: $18,000
- Construction - Regular Highways: $9,097,000
Regular Highways: $9,006,000
Air Transportation: $2,796,000
Financial Administration: $813,000
General Public Buildings: $688,000
Natural Resources - Other: $445,000
Correctional Institutions: $412,000
General - Other: $396,000
Financial Administration: $330,000
General Public Buildings: $295,000
Natural Resources - Other: $281,000
Correctional Institutions: $206,000
Parks and Recreation: $188,000
Parks and Recreation: $180,000
Health - Other: $165,000
General - Other: $113,000
Police Protection: $2,000
- Current Operations - Regular Highways: $18,931,000
Regular Highways: $17,336,000
Correctional Institutions: $12,445,000
Correctional Institutions: $11,049,000
Solid Waste Management: $9,799,000
Judicial and Legal Services: $9,451,000
Judicial and Legal Services: $9,434,000
Police Protection: $8,716,000
Solid Waste Management: $8,377,000
Police Protection: $7,610,000
Health - Other: $4,976,000
General - Other: $4,520,000
Financial Administration: $4,510,000
Financial Administration: $4,455,000
Health - Other: $4,269,000
General - Other: $4,214,000
Natural Resources - Other: $3,061,000
Central Staff Services: $1,978,000
Natural Resources - Other: $1,848,000
Air Transportation: $1,628,000
Housing and Community Development: $1,498,000
Public Welfare - Other: $1,444,000
Public Welfare - Other: $1,264,000
Protective Inspection and Regulation - Other: $901,000
Housing and Community Development: $806,000
Protective Inspection and Regulation - Other: $751,000
Parks and Recreation: $470,000
Parks and Recreation: $408,000
Water Utilities: $280,000
Water Utilities: $223,000
Air Transportation: $160,000
Corrections - Other: $128,000
Libraries: $40,000
Libraries: $37,000
Central Staff Services: $27,000
Local Fire Protection: $15,000
- Federal Intergovernmental - Air Transportation: $2,404,000
General Local Government Support: $1,250,000
Other: $476,000
Natural Resources: $453,000
General Local Government Support: $430,000
Housing and Community Development: $167,000
Housing and Community Development: $140,000
Highways: $37,000
Natural Resources: $24,000
Other: $17,000
- General - Interest on Debt: $1,909,000
Interest on Debt: $1,843,000
- Intergovernmental to Local - Other - Housing and Community Development: $543,000
Other - Natural Resources - Other: $144,000
Other - Regular Highways: $66,000
Other - Financial Administration: $39,000
Other - Local Fire Protection: $19,000
Other - Health - Other: $12,000
Other - Water Utilities: $10,000
Other - Solid Waste Management: $10,000
Other - Air Transportation: $8,000
Other - General - Other: $6,000
Other - Public Welfare - Other: $3,000
Other - Judicial and Legal Services: $2,000
Other - Police Protection: $1,000
Other - Correctional Institutions: $1,000
- Intergovernmental to State - Natural Resources - Other: $4,000
- Local Intergovernmental - Other: $2,339,000
Other: $2,300,000
- Long Term Debt - Beginning Outstanding - Unspecified Public Purpose: $49,055,000
Beginning Outstanding - Unspecified Public Purpose: $48,224,000
Outstanding Unspecified Public Purpose: $46,291,000
Outstanding Unspecified Public Purpose: $40,394,000
Retired Unspecified Public Purpose: $9,284,000
Retired Unspecified Public Purpose: $5,418,000
Issue, Unspecified Public Purpose: $3,485,000
Issue, Unspecified Public Purpose: $623,000
- Miscellaneous - Sale of Property: $4,405,000
Sale of Property: $1,948,000
General Revenue - Other: $1,925,000
Fines and Forfeits: $1,589,000
Fines and Forfeits: $1,364,000
Interest Earnings: $1,345,000
Rents: $1,062,000
Rents: $1,045,000
General Revenue - Other: $749,000
Special Assessments: $381,000
Donations From Private Sources: $223,000
Donations From Private Sources: $199,000
Special Assessments: $42,000
Interest Earnings: $-1,000
- Other Capital Outlay - Regular Highways: $1,175,000
Regular Highways: $682,000
General - Other: $292,000
Health - Other: $132,000
Natural Resources - Other: $103,000
Financial Administration: $75,000
Air Transportation: $70,000
Judicial and Legal Services: $57,000
General - Other: $57,000
Protective Inspection and Regulation - Other: $54,000
Natural Resources - Other: $47,000
Judicial and Legal Services: $35,000
Financial Administration: $32,000
Correctional Institutions: $31,000
Police Protection: $24,000
Police Protection: $22,000
Health - Other: $14,000
Central Staff Services: $13,000
- Other Funds - Cash and Securities: $1,465,000
Cash and Securities: $474,000
- Revenue - Water Utilities: $325,000
Water Utilities: $286,000
- State Intergovernmental - Other: $10,998,000
Other: $10,060,000
Highways: $9,006,000
Highways: $4,528,000
Health and Hospitals: $2,381,000
Health and Hospitals: $1,783,000
General Local Government Support: $350,000
General Local Government Support: $302,000
Housing and Community Development: $116,000
Housing and Community Development: $35,000
Education: $2,000
- Tax - Property: $25,252,000
Property: $24,072,000
General Sales and Gross Receipts: $14,615,000
General Sales and Gross Receipts: $11,155,000
Severance: $2,504,000
Severance: $2,201,000
Documentary and Stock Transfer: $1,724,000
Documentary and Stock Transfer: $1,681,000
Other License: $1,473,000
Public Utilities Sales: $979,000
Other License: $966,000
Public Utilities Sales: $921,000
Other Selective Sales: $613,000
Motor Vehicle License: $534,000
Other Selective Sales: $477,000
Motor Vehicle License: $438,000
Occupation and Business License - Other: $223,000
Occupation and Business License - Other: $194,000
Other: $152,000
- Total Salaries and Wages: $34,941,000
: $33,179,000
- Water Utilities - Interest on Debt: $86,000
Interest on Debt: $53,000
Supplemental Security Income (SSI) in 2006:
- Total number of recipients: 1,890
- Number of aged recipients: 85
- Number of blind and disabled recipients: 1,805
- Number of recipients under 18: 280
- Number of recipients between 18 and 64: 1,380
- Number of recipients older than 64: 230
- Number of recipients also receiving OASDI: 649
- Amount of payments (thousands of dollars): 998
| Most common first names in Lewis County, WA among deceased individuals | ||
| Name | Count | Lived (average) |
|---|---|---|
| John | 438 | 76.3 years |
| William | 384 | 75.4 years |
| Robert | 320 | 73.4 years |
| James | 315 | 74.4 years |
| Mary | 292 | 81.0 years |
| George | 253 | 77.0 years |
| Charles | 236 | 77.3 years |
| Frank | 156 | 79.0 years |
| Donald | 155 | 72.0 years |
| Helen | 151 | 81.7 years |
| Most common last names in Lewis County, WA among deceased individuals | ||
| Last name | Count | Lived (average) |
|---|---|---|
| Smith | 205 | 77.4 years |
| Johnson | 192 | 78.1 years |
| Anderson | 121 | 78.7 years |
| Miller | 114 | 76.5 years |
| Davis | 101 | 76.8 years |
| Jones | 90 | 78.2 years |
| Brown | 85 | 74.4 years |
| Clark | 72 | 76.1 years |
| Taylor | 69 | 75.8 years |
| Wilson | 69 | 76.1 years |
| Businesses in Lewis County, WA | ||||
| Name | Count | Name | Count | |
|---|---|---|---|---|
| AT&T | 1 | Lane Furniture | 2 | |
| Ace Hardware | 4 | Little Caesars Pizza | 1 | |
| Aeropostale | 1 | MasterBrand Cabinets | 4 | |
| Applebee's | 1 | Maurices | 1 | |
| Arby's | 1 | McDonald's | 5 | |
| Baskin-Robbins | 1 | Motel 6 | 1 | |
| Bath & Body Works | 1 | New Balance | 2 | |
| Best Western | 1 | Nike | 4 | |
| Burger King | 2 | Payless | 1 | |
| Chevrolet | 1 | Penske | 1 | |
| Cold Stone Creamery | 1 | Pizza Hut | 1 | |
| Curves | 1 | Quiznos | 1 | |
| DHL | 1 | RadioShack | 2 | |
| Dairy Queen | 1 | Rite Aid | 2 | |
| Dennys | 2 | Rue21 | 1 | |
| DressBarn | 1 | SAS Shoes | 1 | |
| Dressbarn | 1 | Sears | 1 | |
| Eddie Bauer | 1 | Staples | 1 | |
| Famous Footwear | 1 | Starbucks | 4 | |
| FedEx | 9 | Subway | 7 | |
| Ford | 2 | Taco Bell | 1 | |
| GNC | 2 | The Room Place | 1 | |
| GameStop | 1 | Toys"R"Us | 1 | |
| Goodwill | 5 | True Value | 5 | |
| Gymboree | 1 | U-Haul | 5 | |
| H&R Block | 4 | U.S. Cellular | 3 | |
| Holiday Inn | 1 | UPS | 11 | |
| Home Depot | 1 | Vans | 1 | |
| Jack In The Box | 2 | Vons | 2 | |
| KFC | 1 | Walgreens | 1 | |
| Kmart | 1 | Walmart | 1 | |
| La-Z-Boy | 1 | Wendy's | 2 | |
| Lane Bryant | 1 | |||