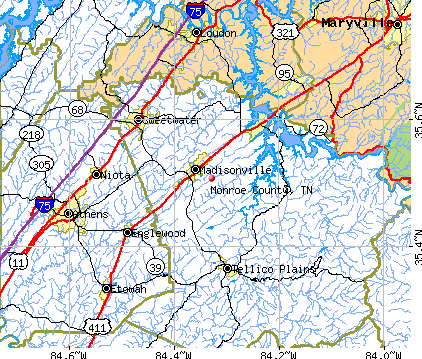
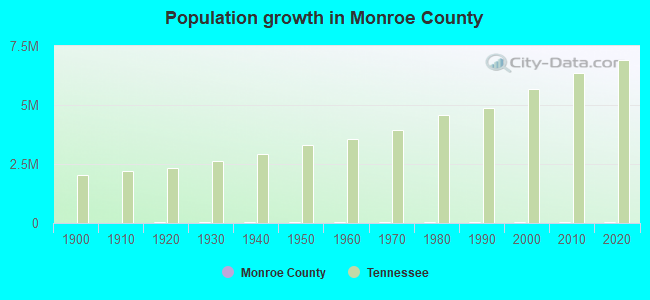
Monroe County, Tennessee (TN)
County owner-occupied free and clear houses and condos in 2010: 5,732
County owner-occupied houses and condos in 2000: 12,009
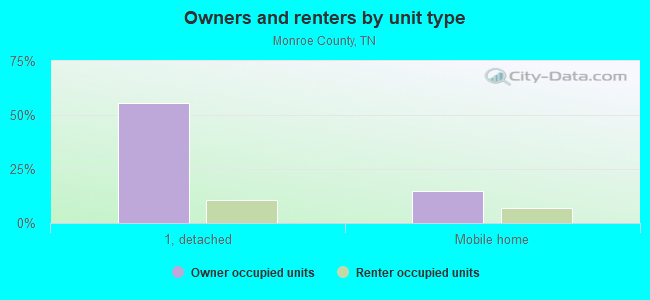
Renter-occupied apartments: 4,405 (it was 3,320 in 2000)
| % of renters here: | 22% |
| State: | 32% |
Land area: 635 sq. mi.
Water area: 17.7 sq. mi.
Population density: 75 people per square mile (average).
Industries providing employment: Manufacturing (25.8%), Educational, health and social services (19.4%), Retail trade (12.7%).
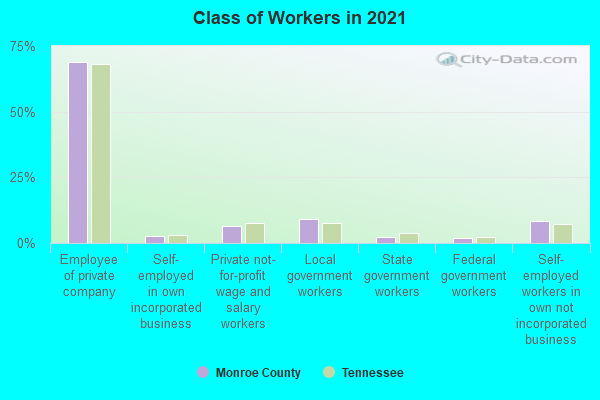
Type of workers:
- Private wage or salary: 79%
- Government: 13%
- Self-employed, not incorporated: 8%
- Unpaid family work: 0%
- OSM Map
- General Map
- Google Map
- MSN Map

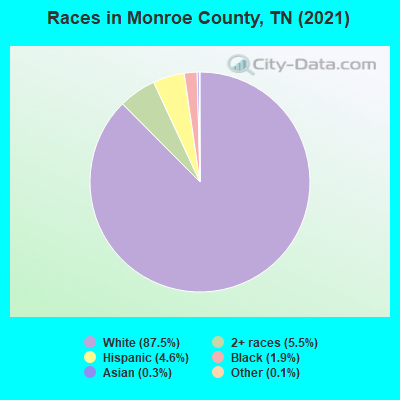
- 41,27586.4%White Non-Hispanic Alone
- 3,0886.5%Two or more races
- 2,2784.8%Hispanic or Latino
- 8051.7%Black Non-Hispanic Alone
- 2000.4%Asian alone
- 1140.2%Some other race alone
- 350.07%American Indian and Alaska Native alone
| Median resident age: | 44.9 years |
| Tennessee median age: | 39.2 years |
| Males: 23,562 | |
| Females: 23,783 |

 | COVID-19 in Tennessee (237 replies) |
| Info on rural areas around Knox please (15 replies) |
| Time to move,considering NE Tenn (55 replies) |
| eastern part of the state (5 replies) |
| Rarity Bay Master Thread (263 replies) |
| Tennessee Population Estimates 2016 (28 replies) |
| Monroe County: | 2.0 people |
| Tennessee: | 2 people |
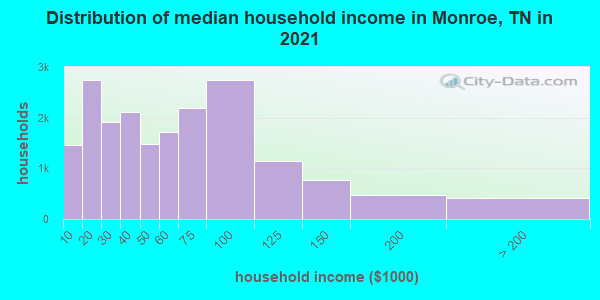
Estimated median household income in 2022: $53,115 ($30,337 in 1999)
| This county: | $53,115 |
| Tennessee: | $65,254 |
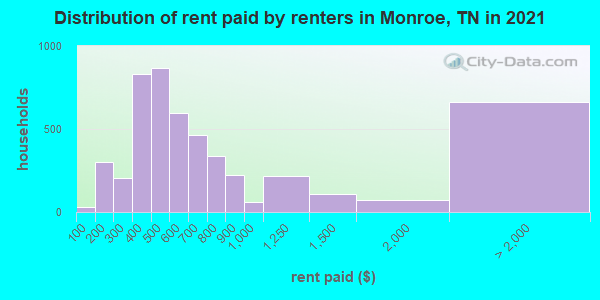
Median contract rent in 2022 for apartments: $529 (lower quartile is $404, upper quartile is $727)
| This county: | $529 |
| State: | $884 |
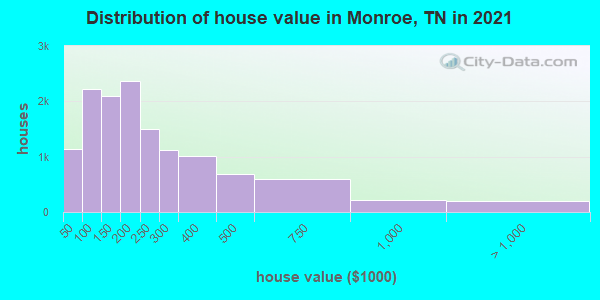
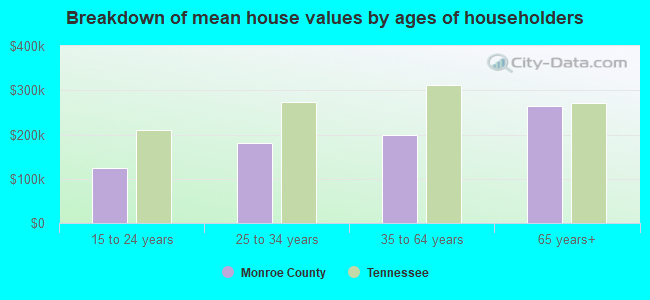
Estimated median house or condo value in 2022: $214,490 (it was $71,900 in 2000)
| Monroe: | $214,490 |
| Tennessee: | $284,800 |
Median monthly housing costs for homes and condos with a mortgage: $1,167
Median monthly housing costs for units without a mortgage: $354
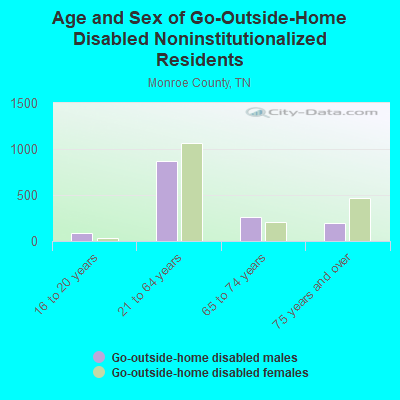
Institutionalized population: 429
Crime in 2021 (reported by the sheriff's office or county police, not the county total):
- Murders: 2
- Rapes: 22
- Robberies: 1
- Assaults: 122
- Burglaries: 158
- Thefts: 338
- Auto thefts: 132
Crime in 2020 (reported by the sheriff's office or county police, not the county total):
- Murders: 2
- Rapes: 19
- Robberies: 4
- Assaults: 168
- Burglaries: 221
- Thefts: 453
- Auto thefts: 139
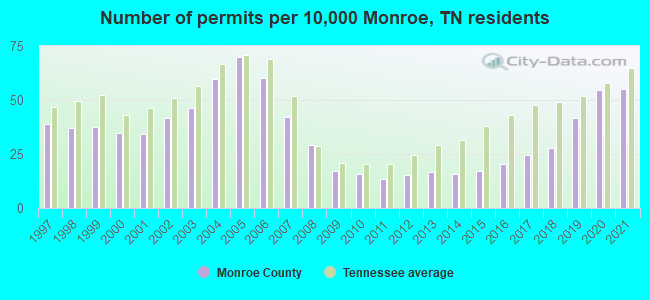
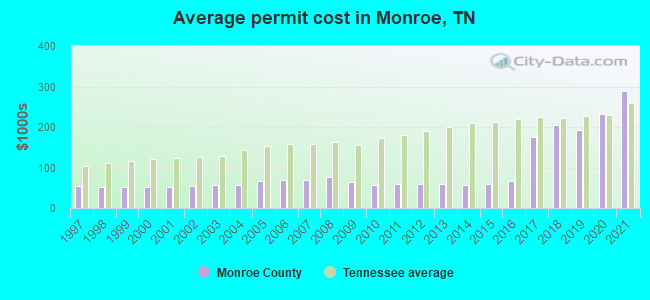
Single-family new house construction building permits:
- 2022: 178 buildings, average cost: $274,400
- 2021: 215 buildings, average cost: $288,000
- 2020: 212 buildings, average cost: $231,000
- 2019: 163 buildings, average cost: $192,700
- 2018: 109 buildings, average cost: $205,800
- 2017: 95 buildings, average cost: $174,600
- 2016: 80 buildings, average cost: $67,300
- 2015: 66 buildings, average cost: $59,700
- 2014: 61 buildings, average cost: $58,400
- 2013: 65 buildings, average cost: $59,200
- 2012: 59 buildings, average cost: $59,800
- 2011: 53 buildings, average cost: $59,000
- 2010: 62 buildings, average cost: $55,800
- 2009: 67 buildings, average cost: $64,500
- 2008: 114 buildings, average cost: $76,800
- 2007: 164 buildings, average cost: $68,400
- 2006: 234 buildings, average cost: $69,600
- 2005: 272 buildings, average cost: $66,900
- 2004: 232 buildings, average cost: $57,900
- 2003: 180 buildings, average cost: $58,400
- 2002: 162 buildings, average cost: $55,000
- 2001: 133 buildings, average cost: $52,800
- 2000: 136 buildings, average cost: $53,200
- 1999: 146 buildings, average cost: $51,600
- 1998: 145 buildings, average cost: $52,000
- 1997: 151 buildings, average cost: $53,800
Median real estate property taxes paid for housing units with mortgages in 2022: $842 (0.4%)
Median real estate property taxes paid for housing units with no mortgage in 2022: $841 (0.4%)
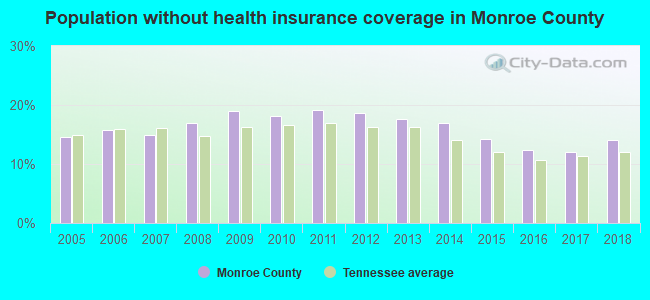
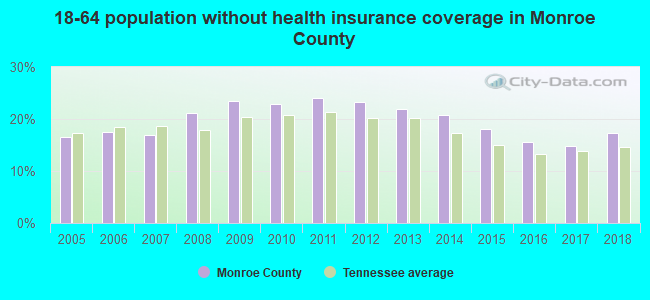
| Monroe County: | 15.2% |
| Tennessee: | 13.3% |
Median age of residents in 2022: 44.9 years old
(Males: 43.5 years old, Females: 46.4 years old)
(Median age for: White residents: 46.9 years old, Black residents: 40.5 years old, American Indian residents: 61.5 years old, Asian residents: 50.0 years old, Hispanic or Latino residents: 22.3 years old, Other race residents: 35.6 years old)
Fair market rent in 2006 for a 1-bedroom apartment in Monroe County is $364 a month.
Fair market rent for a 2-bedroom apartment is $462 a month.
Fair market rent for a 3-bedroom apartment is $553 a month.
Cities in this county include: Sweetwater, Madisonville, Vonore, Tellico Plains.
Notable locations in this county outside city limits:
Notable locations in Monroe County: Irad (A), Swan Valley Overlook (B), Lewis Park (C). Display/hide their locations on the map
Churches in Monroe County include: Buffalo Valley United Methodist Church (A), Pineview Church (B), Loveless Church (C), Springer Ridge Church (D), Flat Rock Church (E), Slippery Church (F), Little Swan Church (G), Haley Chapel (H), Liberty Church (I). Display/hide their locations on the map
Cemeteries: Johnson Cemetery (1), Vincent Cemetery (2), Voorhies Cemetery (3), Walker Cemetery (4), Pioneer Cemetery (5), Kittrell Cemetery (6), Ledbetter Cemetery (7). Display/hide their locations on the map
Lakes and reservoirs: Green Pond (A), Slag Pile Pond (B), Dan Maddox Fishing Lake (C), Highland Lake (D), Lake Highland (E), Napier Lake (F), Dan Maddox Lake (G), Jackson Lake (H). Display/hide their locations on the map
Streams, rivers, and creeks: Little Swan Creek (A), Little Buffalo River (B), Langford Branch (C), Kittrell Branch (D), Kelly Branch (E), Keg Spring Branch (F), Keeling Branch (G), Hurricane Branch (H), Hunt Branch (I). Display/hide their locations on the map
Parks in Monroe County include: Meriwether Lewis National Monument (1), Napier Furnaces Historic District (2). Display/hide their locations on the map
Neighboring counties: Craighead County, Arkansas  , Decatur County , Haskell County, Oklahoma , Henderson County, North Carolina
  , Warren County .
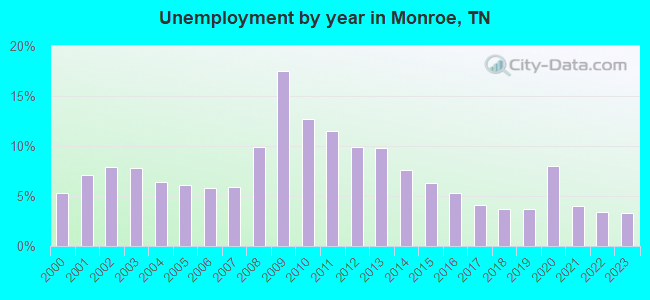
| Here: | 3.2% |
| Tennessee: | 3.0% |
Current college students: 1,196
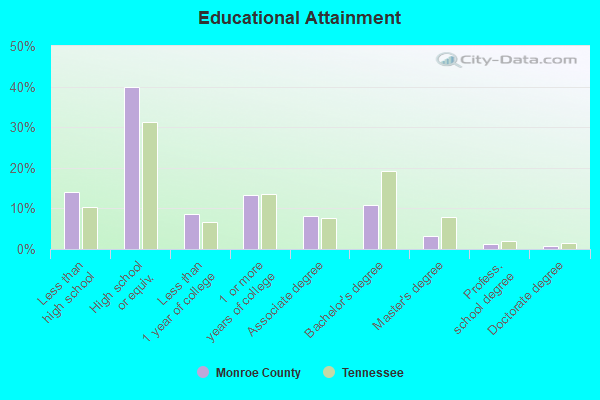
People 25 years of age or older with a high school degree or higher: 85.7%
People 25 years of age or older with a bachelor's degree or higher: 15.6%
Number of foreign born residents: 1,222 (40.7% naturalized citizens)
| Monroe County: | 2.6% |
| Whole state: | 5.6% |
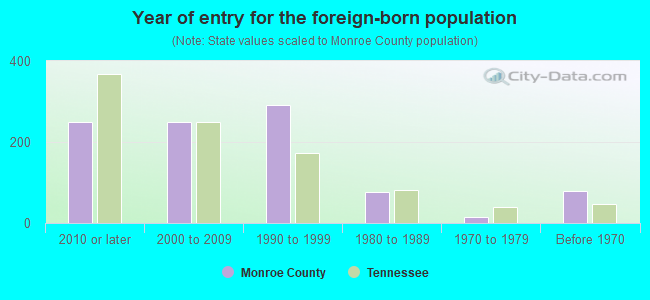
- Year of entry for the foreign-born population
- 3902010 or later
- 3712000 to 2009
- 2031990 to 1999
- 761980 to 1989
- 151970 to 1979
- 80Before 1970
Mean travel time to work (commute): minutes
Percentage of county residents living and working in this county: 98.9%
Housing units in structures:
- One, detached: 14,657
- One, attached: 124
- Two: 487
- 3 or 4: 673
- 5 to 9: 286
- 10 to 19: 179
- 20 to 49: 229
- 50 or more: 10
- Mobile homes: 4,930
- Boats, RVs, vans, etc.: 265
Housing units in Monroe County with a mortgage: 6,315 (371 second mortgage, 0 home equity loan, 253 both second mortgage and home equity loan)
Houses without a mortgage: 126
| Here: | 4.5% with mortgage |
| State: | 97.8% with mortgage |
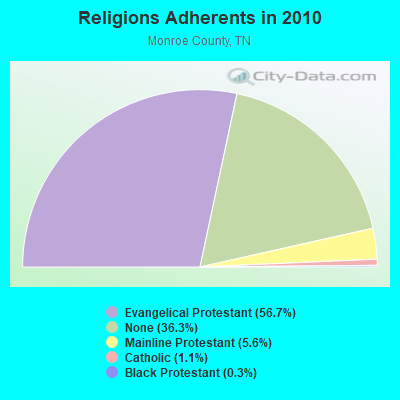
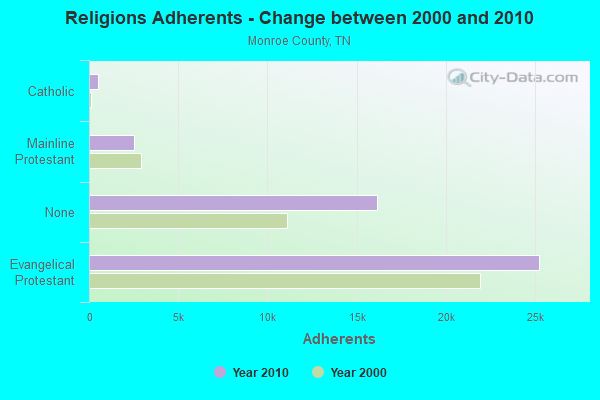
Religion statistics for Monroe County
| Religion | Adherents | Congregations |
|---|---|---|
| Evangelical Protestant | 25,241 | 88 |
| Mainline Protestant | 2,506 | 19 |
| Catholic | 500 | 1 |
| Black Protestant | 121 | 3 |
| Other | 1 | 1 |
| None | 16,150 | - |
Source: Clifford Grammich, Kirk Hadaway, Richard Houseal, Dale E.Jones, Alexei Krindatch, Richie Stanley and Richard H.Taylor. 2012. 2010 U.S.Religion Census: Religious Congregations & Membership Study. Association of Statisticians of American Religious Bodies. Jones, Dale E., et al. 2002. Congregations and Membership in the United States 2000. Nashville, TN: Glenmary Research Center.
Food Environment Statistics:
| Monroe County: | 1.56 / 10,000 pop. |
| State: | 1.99 / 10,000 pop. |
| Here: | 0.22 / 10,000 pop. |
| Tennessee: | 0.17 / 10,000 pop. |
| This county: | 0.89 / 10,000 pop. |
| Tennessee: | 0.65 / 10,000 pop. |
| Monroe County: | 6.04 / 10,000 pop. |
| Tennessee: | 5.16 / 10,000 pop. |
| This county: | 6.48 / 10,000 pop. |
| State: | 6.56 / 10,000 pop. |
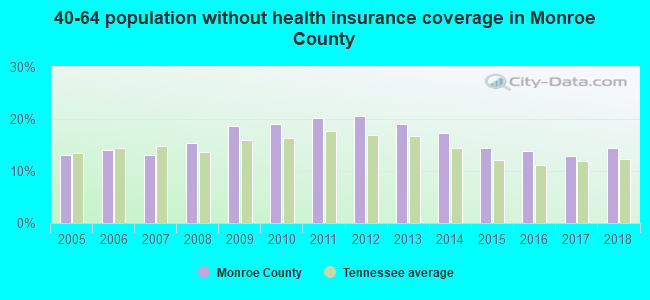
| Monroe County: | 12.8% |
| Tennessee: | 11.4% |
| Monroe County: | 31.1% |
| State: | 30.2% |
| Here: | 8.7% |
| State: | 13.5% |
Agriculture in Monroe County:
Average size of farms: 104 acresAverage value of agricultural products sold per farm: $22,712
Average value of crops sold per acre for harvested cropland: $78.41
The value of nursery, greenhouse, floriculture, and sod as a percentage of the total market value of agricultural products sold: 0.53%
The value of livestock, poultry, and their products as a percentage of the total market value of agricultural products sold: 88.35%
Average total farm production expenses per farm: $18,724
Harvested cropland as a percentage of land in farms: 32.40%
Irrigated harvested cropland as a percentage of land in farms: 0.11%
Average market value of all machinery and equipment per farm: $37,582
The percentage of farms operated by a family or individual: 94.87%
Average age of principal farm operators: 57 years
Average number of cattle and calves per 100 acres of all land in farms: 38.66
Milk cows as a percentage of all cattle and calves: 10.16%
Corn for grain: 901 harvested acres
All wheat for grain: 1238 harvested acres
Soybeans for beans: 3344 harvested acres
Vegetables: 19 harvested acres
Land in orchards: 34 acres
Tornado activity:
Monroe County historical area-adjusted tornado activity is significantly below Tennessee state average. It is 10771551.3 times below overall U.S. average.Tornadoes in this county have caused one fatality and 16 injuries recorded between 1950 and 2004.
On 3/22/1991, a category 2 (max. wind speeds 113-157 mph) tornado killed one person and injured 14 people and caused between $5,000,000 and $50,000,000 in damages.
Earthquake activity:
Monroe County-area historical earthquake activity is significantly above Tennessee state average. It is 90% greater than the overall U.S. average.On 11/30/1973 at 07:48:41, a magnitude 4.7 (4.7 MB, 4.6 ML, Class: Light, Intensity: IV - V) earthquake occurred 29.0 miles away from Monroe County center
On 4/29/2003 at 08:59:39, a magnitude 4.9 (4.4 MB, 4.6 MW, 4.9 LG) earthquake occurred 101.6 miles away from the county center
On 7/27/1980 at 18:52:21, a magnitude 5.2 (5.1 MB, 4.7 MS, 5.0 UK, 5.2 UK, Class: Moderate, Intensity: VI - VII) earthquake occurred 187.9 miles away from the county center
On 12/12/2018 at 09:14:43, a magnitude 4.4 (4.4 MW, Depth: 4.9 mi) earthquake occurred 23.8 miles away from the county center
On 8/9/2020 at 12:07:37, a magnitude 5.1 (5.1 MW, Depth: 4.7 mi) earthquake occurred 193.1 miles away from Monroe County center
On 8/2/1974 at 08:52:09, a magnitude 4.9 (4.3 MB, 4.9 LG) earthquake occurred 154.1 miles away from the county center
Magnitude types: regional Lg-wave magnitude (LG), body-wave magnitude (MB), local magnitude (ML), surface-wave magnitude (MS), moment magnitude (MW)
Most recent natural disasters:
- Tennessee Severe Storms, Tornadoes, Straight-line Winds, And Flooding, Incident Period: April 12, 2020 - April 13, 2020, FEMA Id: 4541, Natural disaster type: Storm, Tornado, Flood, Wind
- Tennessee Covid-19 Pandemic, Incident Period: January 20, 2020, FEMA Id: 4514, Natural disaster type: Other
- Tennessee Severe Winter Storm and Flooding, Incident Period: February 15, 2015 to February 23, 2015, Major Disaster (Presidential) Declared DR-4211: April 02, 2015, FEMA Id: 4211, Natural disaster type: Winter Storm, Flood
- Tennessee Severe Storms, Tornadoes, Straight-line Winds, and Flooding, Incident Period: February 29, 2012 to March 02, 2012, Major Disaster (Presidential) Declared DR-4060: March 16, 2012, FEMA Id: 4060, Natural disaster type: Storm, Tornado, Flood, Wind
- Tennessee Severe Storms, Tornadoes, Straight-line Winds, and Associated Flooding, Incident Period: April 25, 2011 to April 28, 2011, Major Disaster (Presidential) Declared DR-1974: May 01, 2011, FEMA Id: 1974, Natural disaster type: Storm, Tornado, Flood, Wind
- Tennessee Hurricane Katrina Evacuation, Incident Period: August 29, 2005 to October 01, 2005, Emergency Declared EM-3217: September 05, 2005, FEMA Id: 3217, Natural disaster type: Hurricane
- Tennessee Severe Storms, Tornadoes and Flooding, Incident Period: May 04, 2003 to May 30, 2003, Major Disaster (Presidential) Declared DR-1464: May 08, 2003, FEMA Id: 1464, Natural disaster type: Storm, Tornado, Flood
- Tennessee Winter Storm, Incident Period: December 23, 1998 to December 29, 1998, Major Disaster (Presidential) Declared DR-1260: January 15, 1999, FEMA Id: 1260, Natural disaster type: Winter Storm
- Tennessee Severe Storms, Tornadoes and Flooding, Incident Period: April 16, 1998 to May 18, 1998, Major Disaster (Presidential) Declared DR-1215: April 20, 1998, FEMA Id: 1215, Natural disaster type: Storm, Tornado, Flood
- Tennessee Heavy Rain, Flash Flooding, Incident Period: March 25, 1994 to April 03, 1994, Major Disaster (Presidential) Declared DR-1022: April 14, 1994, FEMA Id: 1022, Natural disaster type: Flash Flood, Heavy Rain
- 3 other natural disasters have been reported since 1953.
The number of natural disasters in Monroe County (13) is near the US average (15).
Major Disasters (Presidential) Declared: 9
Emergencies Declared: 2
Causes of natural disasters: Floods: 7, Tornadoes: 6, Storms: 5, Winds: 3, Winter Storms: 3, Heavy Rains: 2, Flash Flood: 1, Hurricane: 1, Snowfall: 1, Other: 1 (Note: some incidents may be assigned to more than one category).
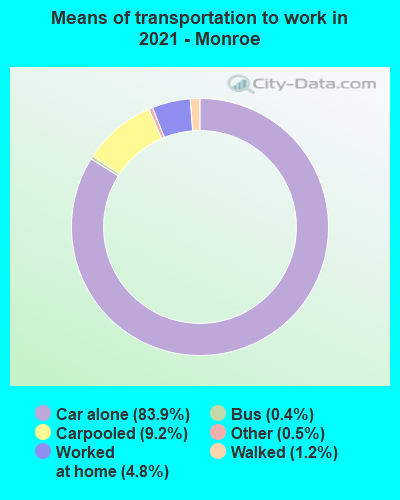
Means of transportation to work:
- Drove a car alone: 13,266 (77.5%)
- Carpooled: 1,883 (11.0%)
- Bus: 54 (0.3%)
- Ferryboat: 12 (0.1%)
- Taxicab, motorcycle, or other means: 98 (0.6%)
- Bicycle: 24 (0.1%)
- Walked: 307 (1.8%)
- Worked at home: 1,123 (6.6%)
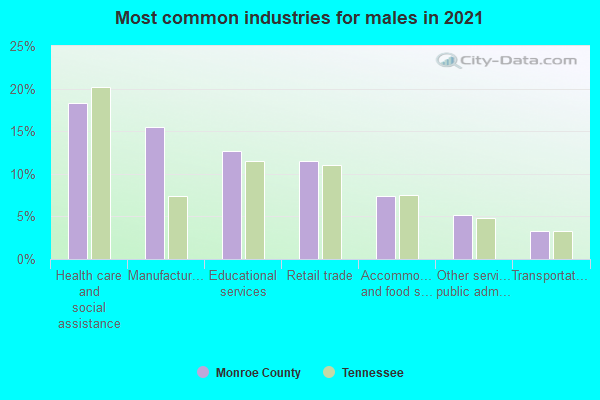
- Health care and social assistance (16%)
- Manufacturing (12%)
- Educational services (12%)
- Retail trade (12%)
- Accommodation and food services (6%)
- Other services, except public administration (4%)
- Professional, scientific, and technical services (3%)
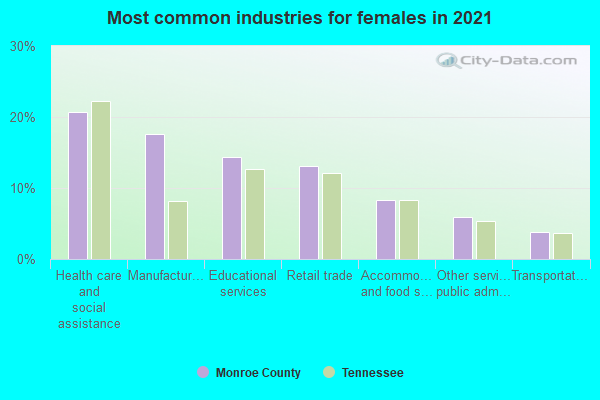
- Health care and social assistance (20%)
- Manufacturing (15%)
- Educational services (15%)
- Retail trade (15%)
- Accommodation and food services (7%)
- Other services, except public administration (5%)
- Professional, scientific, and technical services (4%)
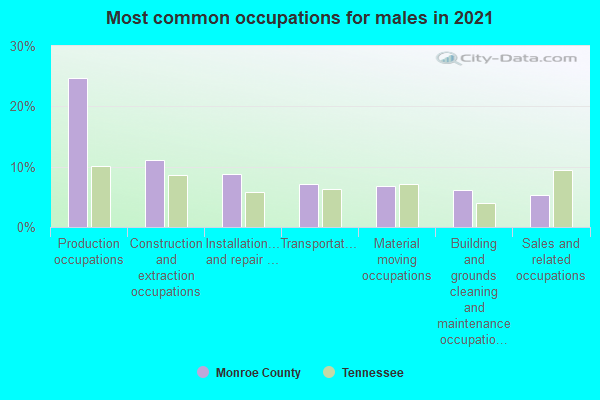
- Production occupations (25%)
- Construction and extraction occupations (11%)
- Installation, maintenance, and repair occupations (10%)
- Transportation occupations (8%)
- Sales and related occupations (7%)
- Building and grounds cleaning and maintenance occupations (6%)
- Material moving occupations (5%)
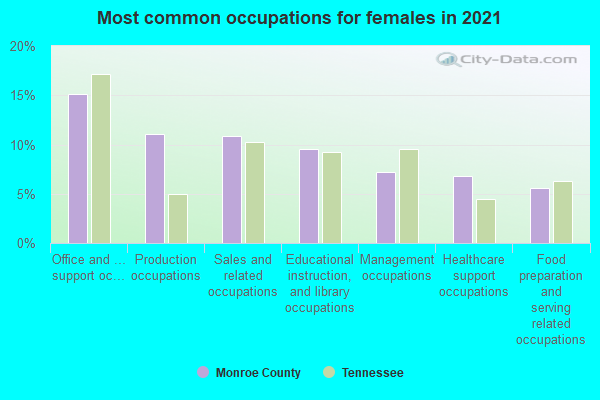
- Office and administrative support occupations (19%)
- Sales and related occupations (11%)
- Production occupations (11%)
- Educational instruction, and library occupations (10%)
- Management occupations (8%)
- Food preparation and serving related occupations (5%)
- Health technologists and technicians (5%)
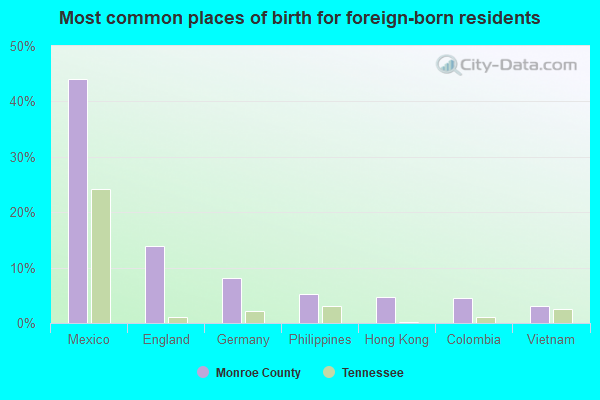
- Mexico (42%)
- England (13%)
- Germany (6%)
- Belgium (6%)
- Philippines (5%)
- Hong Kong (5%)
- Colombia (5%)
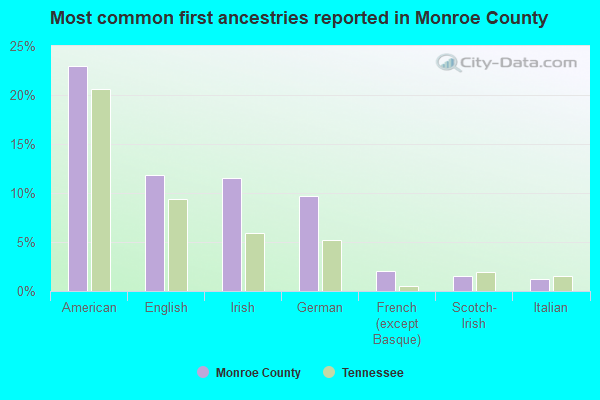
- American (25%)
- English (13%)
- Irish (9%)
- German (8%)
- French (except Basque) (3%)
- Scotch-Irish (2%)
- Italian (2%)
People in group quarters in Monroe County, Tennessee in 2010:
- 253 people in nursing facilities/skilled-nursing facilities
- 156 people in local jails and other municipal confinement facilities
- 50 people in college/university student housing
- 14 people in other noninstitutional facilities
- 13 people in hospitals with patients who have no usual home elsewhere
- 7 people in correctional facilities intended for juveniles
- 7 people in group homes intended for adults
People in group quarters in Monroe County, Tennessee in 2000:
- 249 people in nursing homes
- 175 people in college dormitories (includes college quarters off campus)
- 71 people in local jails and other confinement facilities (including police lockups)
- 27 people in wards in general hospitals for patients who have no usual home elsewhere
- 12 people in other types of correctional institutions
- 7 people in other group homes
- 5 people in other noninstitutional group quarters
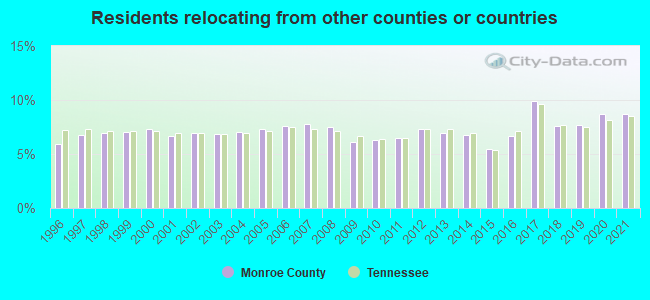
8.71% of this county's 2021 resident taxpayers lived in other counties in 2020 ($69,762 average adjusted gross income)
| Here: | 8.71% |
| Tennessee average: | 8.49% |
10 or fewer of this county's residents moved from foreign countries.
4.76% relocated from other counties in Tennessee ($27,151 average AGI)
3.95% relocated from other states ($42,611 average AGI)
Monroe County: 3.95% Tennessee average: 4.34%
Top counties from which taxpayers relocated into this county between 2020 and 2021:
| from Loudon County, TN | |
| from McMinn County, TN | |
| from Knox County, TN | |
| from Blount County, TN | |
| from Roane County, TN | |
| from Bradley County, TN | |
| from Meigs County, TN |
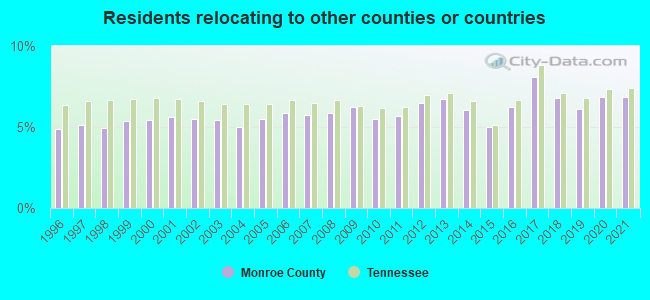
6.88% of this county's 2020 resident taxpayers moved to other counties in 2021 ($46,987 average adjusted gross income)
| Here: | 6.88% |
| Tennessee average: | 7.40% |
10 or fewer of this county's residents moved to foreign countries.
5.15% relocated to other counties in Tennessee ($33,689 average AGI)
1.73% relocated to other states ($13,298 average AGI)
Monroe County: 1.73% Tennessee average: 3.20%
Top counties to which taxpayers relocated from this county between 2020 and 2021:
| to McMinn County, TN | |
| to Loudon County, TN | |
| to Blount County, TN | |
| to Knox County, TN | |
| to Roane County, TN | |
| to Bradley County, TN | |
| to Hamilton County, TN |
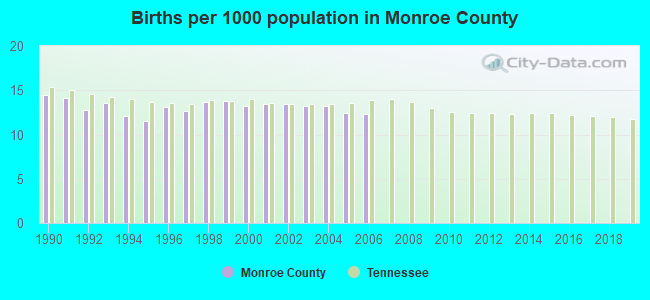
Births per 1000 population from 1990 to 1999: 13.2
Births per 1000 population from 2000 to 2006: 13.0
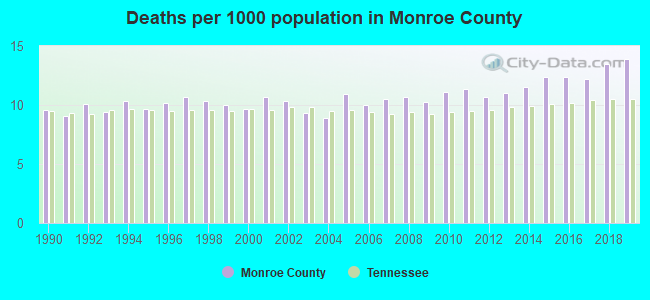
Deaths per 1000 population from 1990 to 1999: 9.9
Deaths per 1000 population from 2000 to 2009: 10.1
Deaths per 1000 population from 2010 to 2020: 12.3
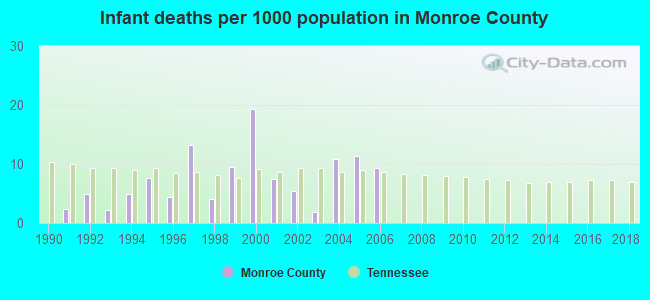
Infant deaths per 1000 live births from 1990 to 1999: 5.3
Infant deaths per 1000 live births from 2000 to 2006: 9.4
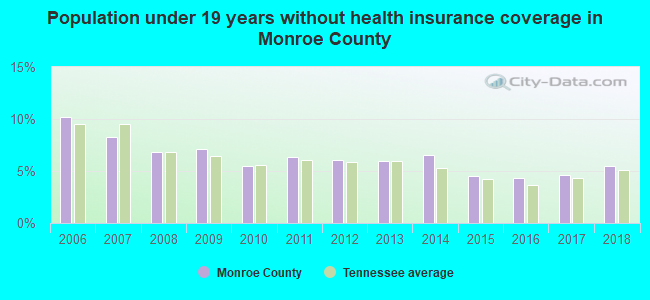
Persons under 19 years old without health insurance coverage in 2018: 5.5%
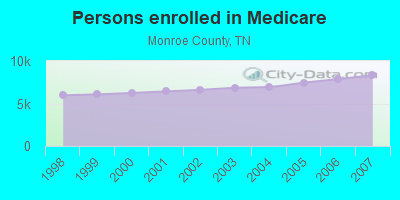
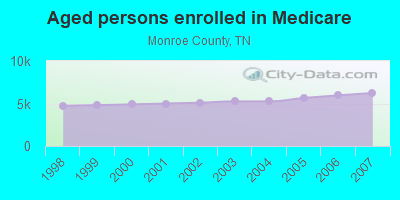
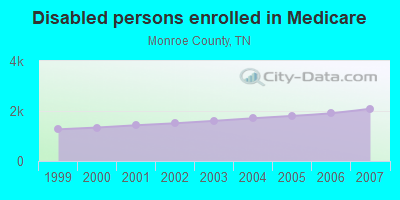
Persons enrolled in hospital insurance and/or supplemental medical insurance (Medicare) in July 1, 2007: 8,334 (6,242 aged, 2,092 disabled)
Children under 18 without health insurance coverage in 2007: 1,096 (10%)
Most common underlying causes of death in Monroe County, Tennessee in 1999 - 2019:
- Acute myocardial infarction, unspecified (880)
- Bronchus or lung, unspecified - Malignant neoplasms (839)
- Atherosclerotic heart disease (428)
- Chronic obstructive pulmonary disease, unspecified (423)
- Alzheimer disease, unspecified (348)
- Stroke, not specified as haemorrhage or infarction (344)
- Unspecified dementia (224)
- Pneumonia, unspecified (154)
- Unspecified diabetes mellitus, without complications (57)
- Colon, unspecified - Malignant neoplasms (51)
Population without health insurance coverage in 2000: 14%
Children under 18 without health insurance coverage in 2000: 9%
Short term general hospital admissions per 100,000 population in 2004: 6,439
Short term general hospital beds per 100,000 population in 2004: 140
Emergency room visits per 100,000 population in 2004: 42,829
General practice office based MDs per 100,000 population in 2005: 1,253
Medical specialist MDs per 100,000 population in 2005: 956
Total births per 100,000 population, July 2005 - July 2006 : 20
Total deaths per 100,000 population, July 2005 - July 2006: 63
Limited-service eating places per 100,000 population in 2005 : 7
Crimes per 100,000 population in 1996: 1
Homicides per 1,000,000 population from 2000 to 2006: 72.9. This is less than state average.
Suicides per 1,000,000 population from 2000 to 2006: 131.9. This is less than state average.
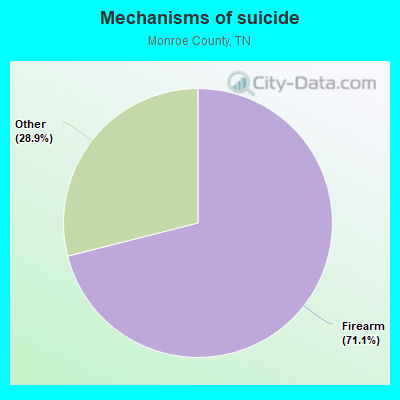
- Firearm - 93.7
- Other - 38.2
Household type by relationship:
Households: 47,345- Male householders: 9,526 (2,590 living alone), Female householders: 10,380 (2,864 living alone)
10,098 spouses (10,026 opposite-sex spouses), 1,433 unmarried partners, (1,386 opposite-sex unmarried partners), 11,683 children (10,486 natural, 392 adopted, 791 stepchildren), 1,330 grandchildren, 381 brothers or sisters, 513 parents, 376 foster children, 512 other relatives, 740 non-relatives
- In group quarters: 553
Size of family households: 6,532 2-persons, 3,439 3-persons, 1,938 4-persons, 1,121 5-persons, 300 6-persons, 180 7-or-more-persons.
Size of nonfamily households: 5,451 1-person, 696 2-persons, 154 3-persons, 32 4-persons, 7 5-persons, 42 7-or-more-persons.
5,358 married couples with children.
2,466 single-parent households (945 men, 1,521 women).
95.8% of residents of Monroe speak English at home.
3.0% of residents speak Spanish at home (68% speak English very well, 12% speak English well, 17% speak English not well, 3% don't speak English at all).
0.6% of residents speak other Indo-European language at home (97% speak English very well, 3% speak English well).
0.4% of residents speak Asian or Pacific Island language at home (65% speak English very well, 35% speak English well).
0.3% of residents speak other language at home (100% speak English very well).
In fiscal year 2004:
Federal Government expenditure: $223,775,000 ($5,319 per capita)
Department of Defense expenditure: $5,150,000
Federal direct payments to individuals for retirement and disability: $113,029,000
Federal other direct payments to individuals: $45,216,000
Federal direct payments not to individuals: $671,000
Federal grants: $56,531,000
Federal procurement contracts: $2,589,000 ($21,000 Department of Defense)
Federal salaries and wages: $5,738,000 ($609,000 Department of Defense)
Federal Government direct loans: $636,000
Federal guaranteed/insured loans: $4,834,000
Federal Government insurance: $3,727,000
Population change from April 1, 2000 to July 1, 2005:
Births: 2,763| Here: | 64 per 1000 residents |
| State: | 69 per 1000 residents |
Deaths: 2,088
| Here: | 48 per 1000 residents |
| State: | 50 per 1000 residents |
Net international migration: +182
| Here: | +4 per 1000 residents |
| State: | +8 per 1000 residents |
Net internal migration: +3,431
| Here: | +79 per 1000 residents |
| State: | +18 per 1000 residents |
Total withdrawal of fresh water for public supply: 5.58 millions of gallons per day (10% from ground, 90% from surface)
| Here: | 6.0 |
| State: | 6.5 |
| Here: | 4.3 |
| State: | 4.4 |
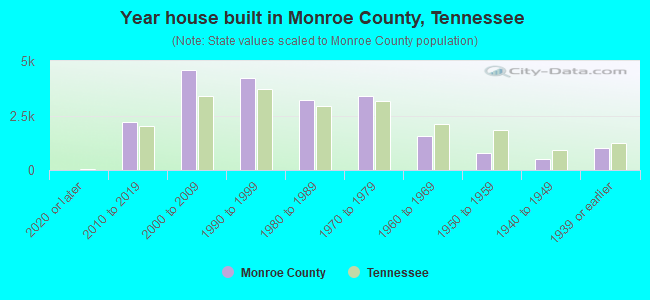
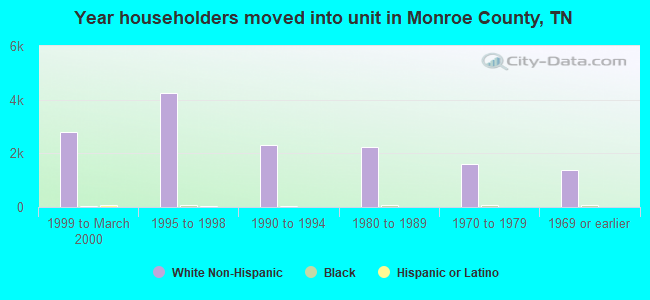
- Year house built in Monroe County, Tennessee
- 1672020 or later
- 2,1762010 to 2019
- 4,7072000 to 2009
- 4,0361990 to 1999
- 3,4181980 to 1989
- 3,5151970 to 1979
- 1,3891960 to 1969
- 8231950 to 1959
- 4881940 to 1949
- 8151939 or earlier
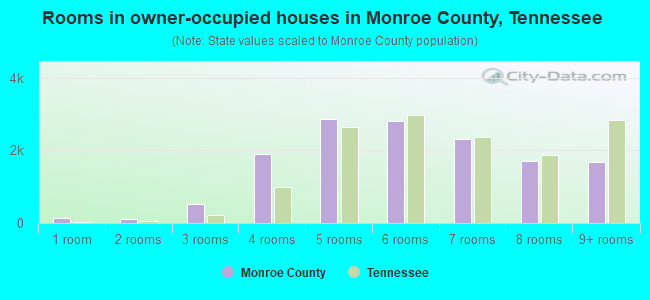
- Rooms in owner-occupied houses in Monroe County, Tennessee
- 541 room
- 1022 rooms
- 7963 rooms
- 1,8384 rooms
- 3,3365 rooms
- 2,5006 rooms
- 2,2607 rooms
- 1,8578 rooms
- 1,7439+ rooms
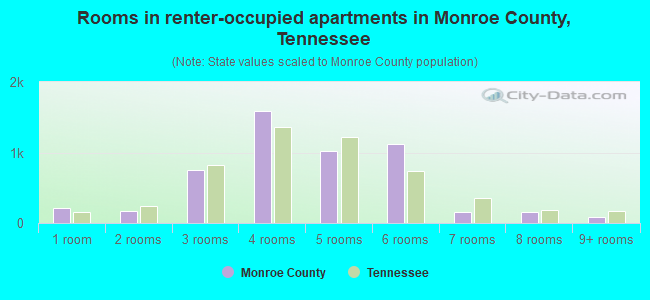
- Rooms in renter-occupied apartments in Monroe County, Tennessee
- 2091 room
- 2802 rooms
- 8003 rooms
- 1,7144 rooms
- 8925 rooms
- 1,1446 rooms
- 1777 rooms
- 2128 rooms
- 969+ rooms
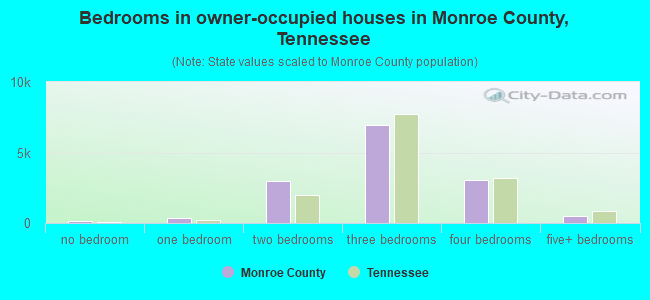
- Bedrooms in owner-occupied houses in Monroe County, Tennessee
- 74no bedroom
- 3891 bedroom
- 2,9872 bedrooms
- 7,4183 bedrooms
- 2,9724 bedrooms
- 5085+ bedrooms

- Bedrooms in renter-occupied apartments in Monroe County, Tennessee
- 236no bedroom
- 8951 bedroom
- 2,1232 bedrooms
- 1,8303 bedrooms
- 2854 bedrooms
- 1455+ bedrooms
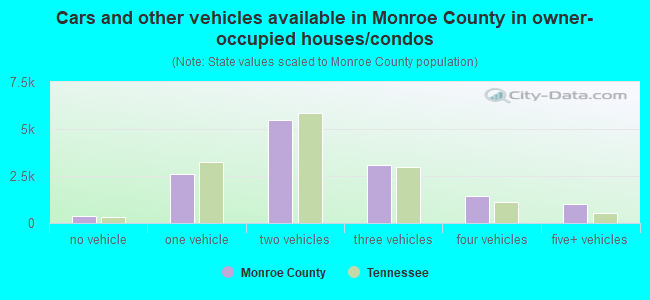
- Cars and other vehicles available in Monroe County in owner-occupied houses/condos
- 418no vehicle
- 2,6471 vehicle
- 5,6862 vehicles
- 3,1113 vehicles
- 1,4914 vehicles
- 1,0195+ vehicles
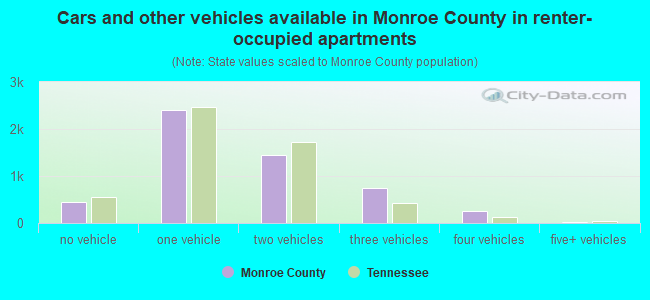
- Cars and other vehicles available in Monroe County in renter-occupied apartments
- 523no vehicle
- 2,7711 vehicle
- 1,2272 vehicles
- 7563 vehicles
- 2764 vehicles
- 215+ vehicles
87.1% of Monroe County residents lived in the same house 1 years ago.
Out of people who lived in different houses, 31% lived in this county.
Out of people who lived in different counties, 51% lived in Tennessee.
| Monroe County: | 87.1% |
| State average: | 87.0% |
Place of birth for U.S.-born residents:
- This state: 29,074
- Other state: 16,691
- Northeast: 2,614
- Midwest: 4,779
- South: 7,199
- West: 2,132
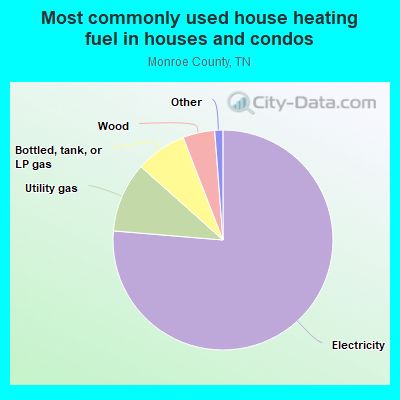
- 76.7%Electricity
- 10.3%Utility gas
- 6.9%Bottled, tank, or LP gas
- 5.0%Wood
- 0.8%No fuel used
- 0.3%Other fuel
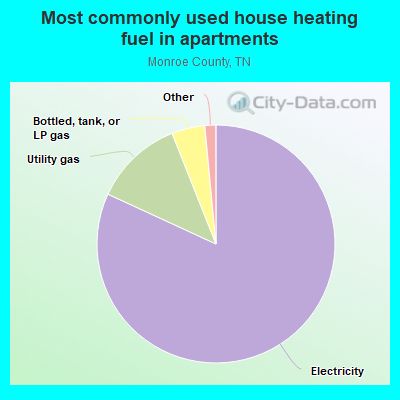
- 81.6%Electricity
- 11.8%Utility gas
- 4.8%Bottled, tank, or LP gas
- 1.1%Wood
- 0.7%Fuel oil, kerosene, etc.
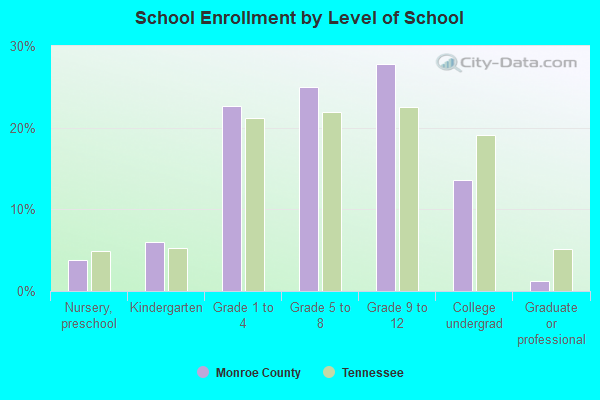
Private vs. public school enrollment:
| Here: | 9.4% |
| Tennessee: | 15.0% |
| Here: | 6.9% |
| Tennessee: | 16.2% |
| Here: | 25.6% |
| Tennessee: | 23.5% |
Monroe County government finances - Expenditure in 2018:
- Bond Funds - Cash and Securities: $34,696,000
Cash and Securities: $24,320,000
- Charges - Other: $6,047,000
Other: $5,534,000
Elementary and Secondary Education - Other: $2,226,000
Elementary and Secondary Education - Other: $2,008,000
Elementary and Secondary Education School Lunch: $497,000
Elementary and Secondary Education School Lunch: $401,000
Air Transportation: $266,000
Regular Highways: $252,000
Air Transportation: $243,000
Regular Highways: $231,000
Solid Waste Management: $72,000
Solid Waste Management: $66,000
Parks and Recreation: $47,000
Parks and Recreation: $43,000
- Construction - Police Protection: $24,893,000
Police Protection: $11,438,000
Regular Highways: $3,299,000
Regular Highways: $1,516,000
- Current Operations - Elementary and Secondary Education: $49,635,000
Elementary and Secondary Education: $48,568,000
Health - Other: $5,063,000
Health - Other: $4,770,000
Police Protection: $3,772,000
Regular Highways: $3,601,000
Police Protection: $3,554,000
Regular Highways: $3,392,000
Correctional Institutions: $2,834,000
Correctional Institutions: $2,670,000
General - Other: $2,309,000
General - Other: $2,175,000
Judicial and Legal Services: $1,967,000
Financial Administration: $1,921,000
Judicial and Legal Services: $1,854,000
Financial Administration: $1,810,000
Central Staff Services: $1,447,000
Central Staff Services: $1,363,000
Solid Waste Management: $1,351,000
Solid Waste Management: $1,273,000
General Public Buildings: $793,000
General Public Buildings: $747,000
Air Transportation: $520,000
Local Fire Protection: $504,000
Parks and Recreation: $495,000
Air Transportation: $490,000
Local Fire Protection: $475,000
Parks and Recreation: $466,000
Natural Resources - Other: $145,000
Natural Resources - Other: $137,000
Libraries: $129,000
Libraries: $121,000
Public Welfare - Other: $96,000
Public Welfare - Other: $90,000
- Federal Intergovernmental - Other: $588,000
Other: $299,000
Highways: $161,000
Education: $117,000
Highways: $82,000
Education: $82,000
- General - Interest on Debt: $3,674,000
Interest on Debt: $2,201,000
- Intergovernmental to Local - Other - General - Other: $8,000
Other - General - Other: $5,000
- Local Intergovernmental - Education: $392,000
Education: $333,000
- Long Term Debt - Beginning Outstanding - Unspecified Public Purpose: $84,020,000
Outstanding Unspecified Public Purpose: $82,170,000
Beginning Outstanding - Unspecified Public Purpose: $70,595,000
Outstanding Unspecified Public Purpose: $59,020,000
Retired Unspecified Public Purpose: $11,575,000
Retired Unspecified Public Purpose: $11,575,000
Issue, Unspecified Public Purpose: $9,725,000
- Miscellaneous - General Revenue - Other: $887,000
General Revenue - Other: $618,000
Fines and Forfeits: $537,000
Donations From Private Sources: $509,000
Interest Earnings: $466,000
Fines and Forfeits: $374,000
Donations From Private Sources: $354,000
Interest Earnings: $325,000
Sale of Property: $14,000
Rents: $8,000
Sale of Property: $8,000
Rents: $6,000
- Other Capital Outlay - Elementary and Secondary Education: $822,000
Elementary and Secondary Education: $688,000
- Other Funds - Cash and Securities: $14,052,000
Cash and Securities: $9,850,000
- Sinking Funds - Cash and Securities: $18,016,000
Cash and Securities: $12,628,000
- State Intergovernmental - Education: $37,796,000
Education: $35,826,000
Highways: $3,671,000
Highways: $3,329,000
Other: $1,646,000
Other: $1,493,000
General Local Government Support: $357,000
General Local Government Support: $324,000
Public Welfare: $12,000
Public Welfare: $11,000
- Tax - Property: $19,774,000
Property: $15,737,000
General Sales and Gross Receipts: $1,307,000
Motor Vehicle License: $1,259,000
General Sales and Gross Receipts: $1,040,000
Motor Vehicle License: $1,002,000
Other Selective Sales: $593,000
Other Selective Sales: $472,000
Alcoholic Beverage Sales: $132,000
Alcoholic Beverage License: $127,000
Alcoholic Beverage Sales: $105,000
Alcoholic Beverage License: $101,000
Other License: $101,000
Public Utilities Sales: $91,000
Other License: $80,000
Public Utilities Sales: $73,000
Severance: $30,000
- Total Salaries and Wages: $27,929,000
: $26,809,000
Monroe County government finances - Revenue in 2018:
- Bond Funds - Cash and Securities: $34,696,000
Cash and Securities: $24,320,000
- Charges - Other: $6,047,000
Other: $5,534,000
Elementary and Secondary Education - Other: $2,226,000
Elementary and Secondary Education - Other: $2,008,000
Elementary and Secondary Education School Lunch: $497,000
Elementary and Secondary Education School Lunch: $401,000
Air Transportation: $266,000
Regular Highways: $252,000
Air Transportation: $243,000
Regular Highways: $231,000
Solid Waste Management: $72,000
Solid Waste Management: $66,000
Parks and Recreation: $47,000
Parks and Recreation: $43,000
- Construction - Police Protection: $24,893,000
Police Protection: $11,438,000
Regular Highways: $3,299,000
Regular Highways: $1,516,000
- Current Operations - Elementary and Secondary Education: $49,635,000
Elementary and Secondary Education: $48,568,000
Health - Other: $5,063,000
Health - Other: $4,770,000
Police Protection: $3,772,000
Regular Highways: $3,601,000
Police Protection: $3,554,000
Regular Highways: $3,392,000
Correctional Institutions: $2,834,000
Correctional Institutions: $2,670,000
General - Other: $2,309,000
General - Other: $2,175,000
Judicial and Legal Services: $1,967,000
Financial Administration: $1,921,000
Judicial and Legal Services: $1,854,000
Financial Administration: $1,810,000
Central Staff Services: $1,447,000
Central Staff Services: $1,363,000
Solid Waste Management: $1,351,000
Solid Waste Management: $1,273,000
General Public Buildings: $793,000
General Public Buildings: $747,000
Air Transportation: $520,000
Local Fire Protection: $504,000
Parks and Recreation: $495,000
Air Transportation: $490,000
Local Fire Protection: $475,000
Parks and Recreation: $466,000
Natural Resources - Other: $145,000
Natural Resources - Other: $137,000
Libraries: $129,000
Libraries: $121,000
Public Welfare - Other: $96,000
Public Welfare - Other: $90,000
- Federal Intergovernmental - Other: $588,000
Other: $299,000
Highways: $161,000
Education: $117,000
Highways: $82,000
Education: $82,000
- General - Interest on Debt: $3,674,000
Interest on Debt: $2,201,000
- Intergovernmental to Local - Other - General - Other: $8,000
Other - General - Other: $5,000
- Local Intergovernmental - Education: $392,000
Education: $333,000
- Long Term Debt - Beginning Outstanding - Unspecified Public Purpose: $84,020,000
Outstanding Unspecified Public Purpose: $82,170,000
Beginning Outstanding - Unspecified Public Purpose: $70,595,000
Outstanding Unspecified Public Purpose: $59,020,000
Retired Unspecified Public Purpose: $11,575,000
Retired Unspecified Public Purpose: $11,575,000
Issue, Unspecified Public Purpose: $9,725,000
- Miscellaneous - General Revenue - Other: $887,000
General Revenue - Other: $618,000
Fines and Forfeits: $537,000
Donations From Private Sources: $509,000
Interest Earnings: $466,000
Fines and Forfeits: $374,000
Donations From Private Sources: $354,000
Interest Earnings: $325,000
Sale of Property: $14,000
Rents: $8,000
Sale of Property: $8,000
Rents: $6,000
- Other Capital Outlay - Elementary and Secondary Education: $822,000
Elementary and Secondary Education: $688,000
- Other Funds - Cash and Securities: $14,052,000
Cash and Securities: $9,850,000
- Sinking Funds - Cash and Securities: $18,016,000
Cash and Securities: $12,628,000
- State Intergovernmental - Education: $37,796,000
Education: $35,826,000
Highways: $3,671,000
Highways: $3,329,000
Other: $1,646,000
Other: $1,493,000
General Local Government Support: $357,000
General Local Government Support: $324,000
Public Welfare: $12,000
Public Welfare: $11,000
- Tax - Property: $19,774,000
Property: $15,737,000
General Sales and Gross Receipts: $1,307,000
Motor Vehicle License: $1,259,000
General Sales and Gross Receipts: $1,040,000
Motor Vehicle License: $1,002,000
Other Selective Sales: $593,000
Other Selective Sales: $472,000
Alcoholic Beverage Sales: $132,000
Alcoholic Beverage License: $127,000
Alcoholic Beverage Sales: $105,000
Alcoholic Beverage License: $101,000
Other License: $101,000
Public Utilities Sales: $91,000
Other License: $80,000
Public Utilities Sales: $73,000
Severance: $30,000
- Total Salaries and Wages: $27,929,000
: $26,809,000
Monroe County government finances - Debt in 2018:
- Bond Funds - Cash and Securities: $34,696,000
Cash and Securities: $24,320,000
- Charges - Other: $6,047,000
Other: $5,534,000
Elementary and Secondary Education - Other: $2,226,000
Elementary and Secondary Education - Other: $2,008,000
Elementary and Secondary Education School Lunch: $497,000
Elementary and Secondary Education School Lunch: $401,000
Air Transportation: $266,000
Regular Highways: $252,000
Air Transportation: $243,000
Regular Highways: $231,000
Solid Waste Management: $72,000
Solid Waste Management: $66,000
Parks and Recreation: $47,000
Parks and Recreation: $43,000
- Construction - Police Protection: $24,893,000
Police Protection: $11,438,000
Regular Highways: $3,299,000
Regular Highways: $1,516,000
- Current Operations - Elementary and Secondary Education: $49,635,000
Elementary and Secondary Education: $48,568,000
Health - Other: $5,063,000
Health - Other: $4,770,000
Police Protection: $3,772,000
Regular Highways: $3,601,000
Police Protection: $3,554,000
Regular Highways: $3,392,000
Correctional Institutions: $2,834,000
Correctional Institutions: $2,670,000
General - Other: $2,309,000
General - Other: $2,175,000
Judicial and Legal Services: $1,967,000
Financial Administration: $1,921,000
Judicial and Legal Services: $1,854,000
Financial Administration: $1,810,000
Central Staff Services: $1,447,000
Central Staff Services: $1,363,000
Solid Waste Management: $1,351,000
Solid Waste Management: $1,273,000
General Public Buildings: $793,000
General Public Buildings: $747,000
Air Transportation: $520,000
Local Fire Protection: $504,000
Parks and Recreation: $495,000
Air Transportation: $490,000
Local Fire Protection: $475,000
Parks and Recreation: $466,000
Natural Resources - Other: $145,000
Natural Resources - Other: $137,000
Libraries: $129,000
Libraries: $121,000
Public Welfare - Other: $96,000
Public Welfare - Other: $90,000
- Federal Intergovernmental - Other: $588,000
Other: $299,000
Highways: $161,000
Education: $117,000
Highways: $82,000
Education: $82,000
- General - Interest on Debt: $3,674,000
Interest on Debt: $2,201,000
- Intergovernmental to Local - Other - General - Other: $8,000
Other - General - Other: $5,000
- Local Intergovernmental - Education: $392,000
Education: $333,000
- Long Term Debt - Beginning Outstanding - Unspecified Public Purpose: $84,020,000
Outstanding Unspecified Public Purpose: $82,170,000
Beginning Outstanding - Unspecified Public Purpose: $70,595,000
Outstanding Unspecified Public Purpose: $59,020,000
Retired Unspecified Public Purpose: $11,575,000
Retired Unspecified Public Purpose: $11,575,000
Issue, Unspecified Public Purpose: $9,725,000
- Miscellaneous - General Revenue - Other: $887,000
General Revenue - Other: $618,000
Fines and Forfeits: $537,000
Donations From Private Sources: $509,000
Interest Earnings: $466,000
Fines and Forfeits: $374,000
Donations From Private Sources: $354,000
Interest Earnings: $325,000
Sale of Property: $14,000
Rents: $8,000
Sale of Property: $8,000
Rents: $6,000
- Other Capital Outlay - Elementary and Secondary Education: $822,000
Elementary and Secondary Education: $688,000
- Other Funds - Cash and Securities: $14,052,000
Cash and Securities: $9,850,000
- Sinking Funds - Cash and Securities: $18,016,000
Cash and Securities: $12,628,000
- State Intergovernmental - Education: $37,796,000
Education: $35,826,000
Highways: $3,671,000
Highways: $3,329,000
Other: $1,646,000
Other: $1,493,000
General Local Government Support: $357,000
General Local Government Support: $324,000
Public Welfare: $12,000
Public Welfare: $11,000
- Tax - Property: $19,774,000
Property: $15,737,000
General Sales and Gross Receipts: $1,307,000
Motor Vehicle License: $1,259,000
General Sales and Gross Receipts: $1,040,000
Motor Vehicle License: $1,002,000
Other Selective Sales: $593,000
Other Selective Sales: $472,000
Alcoholic Beverage Sales: $132,000
Alcoholic Beverage License: $127,000
Alcoholic Beverage Sales: $105,000
Alcoholic Beverage License: $101,000
Other License: $101,000
Public Utilities Sales: $91,000
Other License: $80,000
Public Utilities Sales: $73,000
Severance: $30,000
- Total Salaries and Wages: $27,929,000
: $26,809,000
Monroe County government finances - Cash and Securities in 2018:
- Bond Funds - Cash and Securities: $34,696,000
Cash and Securities: $24,320,000
- Charges - Other: $6,047,000
Other: $5,534,000
Elementary and Secondary Education - Other: $2,226,000
Elementary and Secondary Education - Other: $2,008,000
Elementary and Secondary Education School Lunch: $497,000
Elementary and Secondary Education School Lunch: $401,000
Air Transportation: $266,000
Regular Highways: $252,000
Air Transportation: $243,000
Regular Highways: $231,000
Solid Waste Management: $72,000
Solid Waste Management: $66,000
Parks and Recreation: $47,000
Parks and Recreation: $43,000
- Construction - Police Protection: $24,893,000
Police Protection: $11,438,000
Regular Highways: $3,299,000
Regular Highways: $1,516,000
- Current Operations - Elementary and Secondary Education: $49,635,000
Elementary and Secondary Education: $48,568,000
Health - Other: $5,063,000
Health - Other: $4,770,000
Police Protection: $3,772,000
Regular Highways: $3,601,000
Police Protection: $3,554,000
Regular Highways: $3,392,000
Correctional Institutions: $2,834,000
Correctional Institutions: $2,670,000
General - Other: $2,309,000
General - Other: $2,175,000
Judicial and Legal Services: $1,967,000
Financial Administration: $1,921,000
Judicial and Legal Services: $1,854,000
Financial Administration: $1,810,000
Central Staff Services: $1,447,000
Central Staff Services: $1,363,000
Solid Waste Management: $1,351,000
Solid Waste Management: $1,273,000
General Public Buildings: $793,000
General Public Buildings: $747,000
Air Transportation: $520,000
Local Fire Protection: $504,000
Parks and Recreation: $495,000
Air Transportation: $490,000
Local Fire Protection: $475,000
Parks and Recreation: $466,000
Natural Resources - Other: $145,000
Natural Resources - Other: $137,000
Libraries: $129,000
Libraries: $121,000
Public Welfare - Other: $96,000
Public Welfare - Other: $90,000
- Federal Intergovernmental - Other: $588,000
Other: $299,000
Highways: $161,000
Education: $117,000
Highways: $82,000
Education: $82,000
- General - Interest on Debt: $3,674,000
Interest on Debt: $2,201,000
- Intergovernmental to Local - Other - General - Other: $8,000
Other - General - Other: $5,000
- Local Intergovernmental - Education: $392,000
Education: $333,000
- Long Term Debt - Beginning Outstanding - Unspecified Public Purpose: $84,020,000
Outstanding Unspecified Public Purpose: $82,170,000
Beginning Outstanding - Unspecified Public Purpose: $70,595,000
Outstanding Unspecified Public Purpose: $59,020,000
Retired Unspecified Public Purpose: $11,575,000
Retired Unspecified Public Purpose: $11,575,000
Issue, Unspecified Public Purpose: $9,725,000
- Miscellaneous - General Revenue - Other: $887,000
General Revenue - Other: $618,000
Fines and Forfeits: $537,000
Donations From Private Sources: $509,000
Interest Earnings: $466,000
Fines and Forfeits: $374,000
Donations From Private Sources: $354,000
Interest Earnings: $325,000
Sale of Property: $14,000
Rents: $8,000
Sale of Property: $8,000
Rents: $6,000
- Other Capital Outlay - Elementary and Secondary Education: $822,000
Elementary and Secondary Education: $688,000
- Other Funds - Cash and Securities: $14,052,000
Cash and Securities: $9,850,000
- Sinking Funds - Cash and Securities: $18,016,000
Cash and Securities: $12,628,000
- State Intergovernmental - Education: $37,796,000
Education: $35,826,000
Highways: $3,671,000
Highways: $3,329,000
Other: $1,646,000
Other: $1,493,000
General Local Government Support: $357,000
General Local Government Support: $324,000
Public Welfare: $12,000
Public Welfare: $11,000
- Tax - Property: $19,774,000
Property: $15,737,000
General Sales and Gross Receipts: $1,307,000
Motor Vehicle License: $1,259,000
General Sales and Gross Receipts: $1,040,000
Motor Vehicle License: $1,002,000
Other Selective Sales: $593,000
Other Selective Sales: $472,000
Alcoholic Beverage Sales: $132,000
Alcoholic Beverage License: $127,000
Alcoholic Beverage Sales: $105,000
Alcoholic Beverage License: $101,000
Other License: $101,000
Public Utilities Sales: $91,000
Other License: $80,000
Public Utilities Sales: $73,000
Severance: $30,000
- Total Salaries and Wages: $27,929,000
: $26,809,000
Supplemental Security Income (SSI) in 2006:
- Total number of recipients: 1,649
- Number of aged recipients: 237
- Number of blind and disabled recipients: 1,412
- Number of recipients under 18: 146
- Number of recipients between 18 and 64: 1,059
- Number of recipients older than 64: 444
- Number of recipients also receiving OASDI: 792
- Amount of payments (thousands of dollars): 651
| Most common first names in Monroe County, TN among deceased individuals | ||
| Name | Count | Lived (average) |
|---|---|---|
| James | 314 | 71.6 years |
| John | 260 | 75.7 years |
| William | 258 | 74.3 years |
| Mary | 211 | 78.4 years |
| Charles | 174 | 69.7 years |
| Robert | 172 | 72.7 years |
| George | 91 | 72.6 years |
| Margaret | 87 | 74.9 years |
| Fred | 85 | 74.9 years |
| Thomas | 74 | 74.5 years |
| Most common last names in Monroe County, TN among deceased individuals | ||
| Last name | Count | Lived (average) |
|---|---|---|
| Watson | 171 | 74.6 years |
| Smith | 100 | 71.7 years |
| Miller | 100 | 73.3 years |
| Williams | 98 | 75.3 years |
| Harris | 91 | 73.2 years |
| Thomas | 77 | 74.4 years |
| White | 77 | 77.3 years |
| Johnson | 74 | 73.6 years |
| Hicks | 72 | 75.5 years |
| Davis | 70 | 72.1 years |
| Businesses in Monroe County, TN | ||||
| Name | Count | Name | Count | |
|---|---|---|---|---|
| Ace Hardware | 1 | Little Caesars Pizza | 2 | |
| Advance Auto Parts | 2 | Long John Silver's | 1 | |
| Burger King | 1 | MasterBrand Cabinets | 2 | |
| CVS | 2 | McDonald's | 2 | |
| Circle K | 1 | Nike | 1 | |
| Comfort Inn | 1 | Pizza Hut | 2 | |
| Days Inn | 1 | Quality | 1 | |
| Domino's Pizza | 2 | RadioShack | 1 | |
| Econo Lodge | 1 | SONIC Drive-In | 2 | |
| FedEx | 5 | Sears | 1 | |
| Ford | 1 | Subway | 5 | |
| H&R Block | 4 | Taco Bell | 1 | |
| Jimmy John's | 1 | U-Haul | 3 | |
| Jones New York | 2 | U.S. Cellular | 4 | |
| KFC | 2 | UPS | 2 | |
| Kmart | 1 | Walgreens | 2 | |
| La-Z-Boy | 1 | Walmart | 1 | |
| Lane Furniture | 1 | Wendy's | 1 | |