Nevada County, Arkansas (AR)
County owner-occupied free and clear houses and condos in 2010: 1,418
County owner-occupied houses and condos in 2000: 2,912
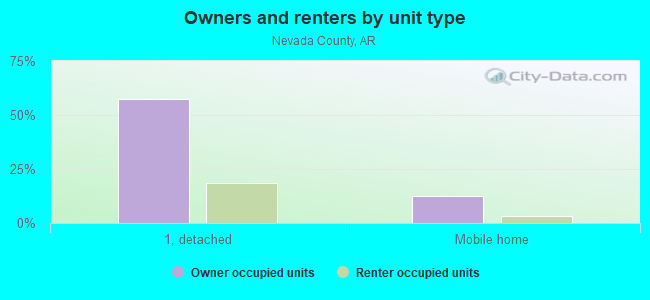
Renter-occupied apartments: 1,037 (it was 981 in 2000)
| % of renters here: | 25% |
| State: | 33% |
Land area: 620 sq. mi.
Water area: 0.8 sq. mi.
Population density: 13 people per square mile (low).
Industries providing employment: Educational, health and social services (25.2%), Manufacturing (19.7%), Arts, entertainment, recreation, accommodation and food services (16.5%).
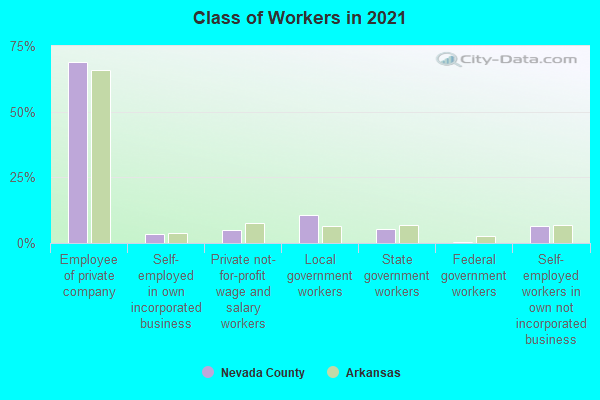
Type of workers:
- Private wage or salary: 80%
- Government: 15%
- Self-employed, not incorporated: 5%
- Unpaid family work: 0%
- OSM Map
- General Map
- Google Map
- MSN Map

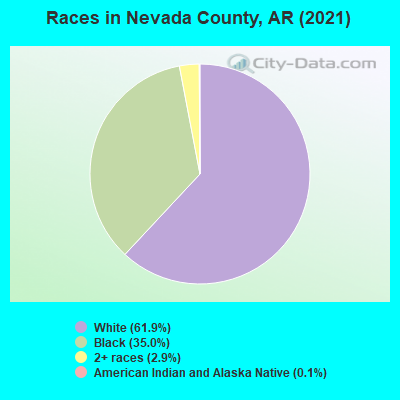
- 5,08162.5%White Non-Hispanic Alone
- 2,68033.0%Black Non-Hispanic Alone
- 2082.6%Two or more races
- 1281.6%Hispanic or Latino
- 130.2%Asian alone
- 100.1%American Indian and Alaska Native alone
- 100.1%Native Hawaiian and Other
Pacific Islander alone - 30.04%Some other race alone
| Median resident age: | 45.3 years |
| Arkansas median age: | 38.9 years |
| Males: 4,092 | |
| Females: 4,274 |

 | Exploring Arkansas (1167 replies) |
| Rural drug problem in Arkansas (41 replies) |
| Museums - small county (24 replies) |
| Nevada County: | 2.0 people |
| Arkansas: | 2 people |
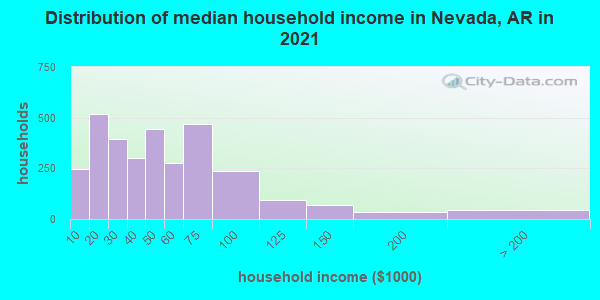
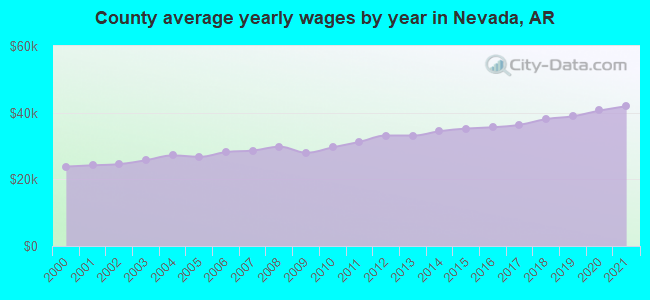
Estimated median household income in 2022: $42,724 ($26,962 in 1999)
| This county: | $42,724 |
| Arkansas: | $55,432 |
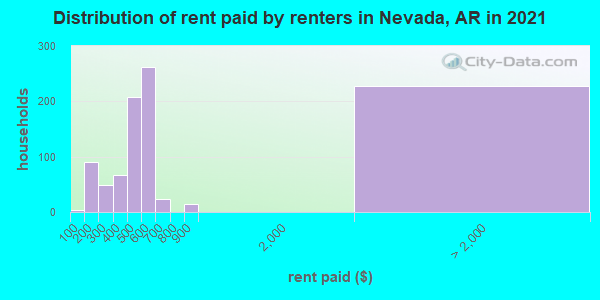
Median contract rent in 2022 for apartments: $513 (lower quartile is $403, upper quartile is $572)
| This county: | $513 |
| State: | $654 |
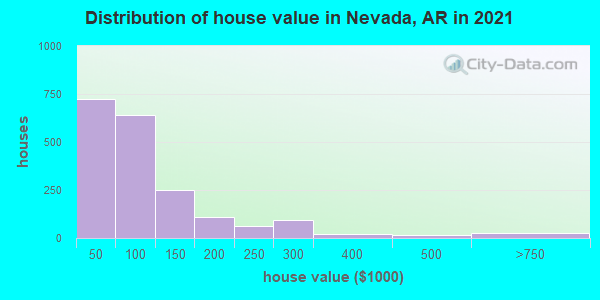
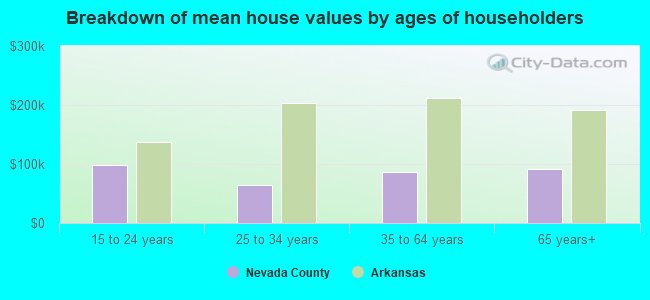
Estimated median house or condo value in 2022: $94,218 (it was $39,100 in 2000)
| Nevada: | $94,218 |
| Arkansas: | $179,800 |
Mean price in 2022:
Median monthly housing costs for homes and condos with a mortgage: $895Detached houses: $127,456
Here: $127,456 State: $243,881 Mobile homes: $69,811
Here: $69,811 State: $79,566
Median monthly housing costs for units without a mortgage: $362
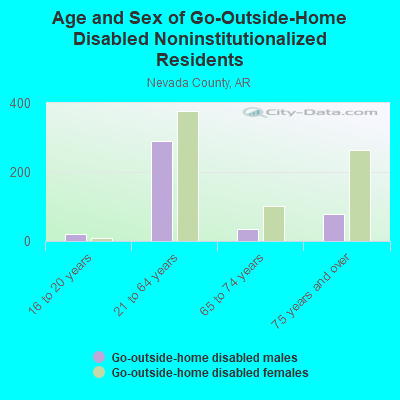
Institutionalized population: 148
Crime in 2021 (reported by the sheriff's office or county police, not the county total):
- Murders: 0
- Rapes: 3
- Robberies: 0
- Assaults: 11
- Burglaries: 10
- Thefts: 13
- Auto thefts: 10
Crime in 2020 (reported by the sheriff's office or county police, not the county total):
- Murders: 0
- Rapes: 2
- Robberies: 3
- Assaults: 7
- Burglaries: 11
- Thefts: 10
- Auto thefts: 2
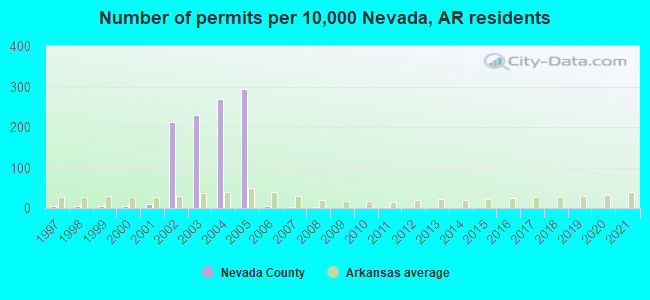
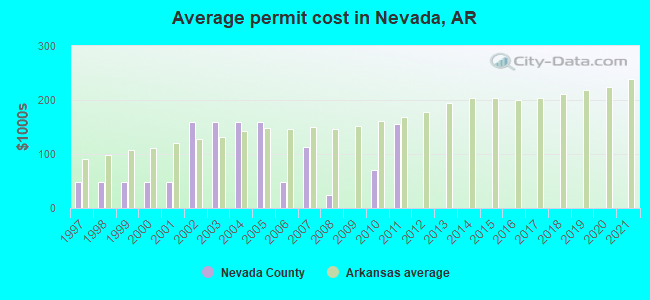
Single-family new house construction building permits:
- 2022: 0 buildings
- 2021: 0 buildings
- 2020: 0 buildings
- 2019: 0 buildings
- 2018: 0 buildings
- 2017: 0 buildings
- 2016: 0 buildings
- 2015: 0 buildings
- 2014: 0 buildings
- 2013: 0 buildings
- 2012: 0 buildings
- 2011: 2 buildings, average cost: $156,100
- 2010: 1 building, cost: $70,000
- 2009: 0 buildings
- 2008: 2 buildings, average cost: $24,600
- 2007: 3 buildings, average cost: $113,300
- 2006: 6 buildings, average cost: $48,500
- 2005: 292 buildings, average cost: $160,000
- 2004: 267 buildings, average cost: $160,200
- 2003: 229 buildings, average cost: $159,500
- 2002: 211 buildings, average cost: $159,200
- 2001: 10 buildings, average cost: $48,600
- 2000: 4 buildings, average cost: $47,900
- 1999: 5 buildings, average cost: $47,900
- 1998: 5 buildings, average cost: $47,900
- 1997: 5 buildings, average cost: $47,900
Median real estate property taxes paid for housing units with mortgages in 2022: $436 (0.4%)
Median real estate property taxes paid for housing units with no mortgage in 2022: $482 (0.5%)
| Nevada County: | 28.8% |
| Arkansas: | 16.8% |
Median age of residents in 2022: 45.3 years old
(Males: 44.6 years old, Females: 48.8 years old)
(Median age for: White residents: 47.2 years old, Black residents: 46.6 years old, Hispanic or Latino residents: 20.9 years old)
Fair market rent in 2006 for a 1-bedroom apartment in Nevada County is $412 a month.
Fair market rent for a 2-bedroom apartment is $473 a month.
Fair market rent for a 3-bedroom apartment is $566 a month.
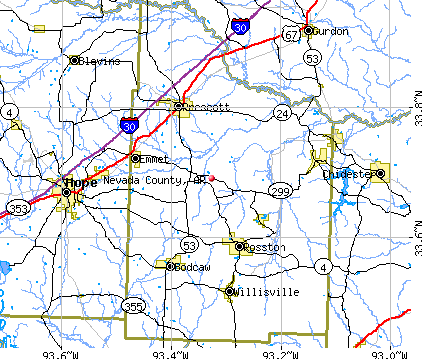
Cities in this county include: Prescott, Emmet, Rosston, Willisville, Bluff City, Bodcaw, Reader, Cale.
Neighboring counties: Calhoun County, Mississippi  , Chickasaw County, Mississippi , Imperial County, California
  , Lincoln County , Williamsburg County, South Carolina , Grayson County, Texas , Hunt County, Texas
  .
.
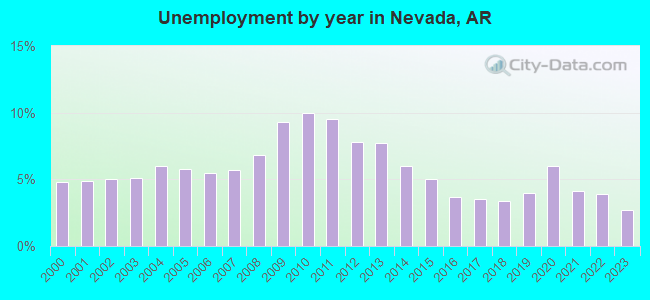
| Here: | 3.8% |
| Arkansas: | 3.4% |
Current college students: 366
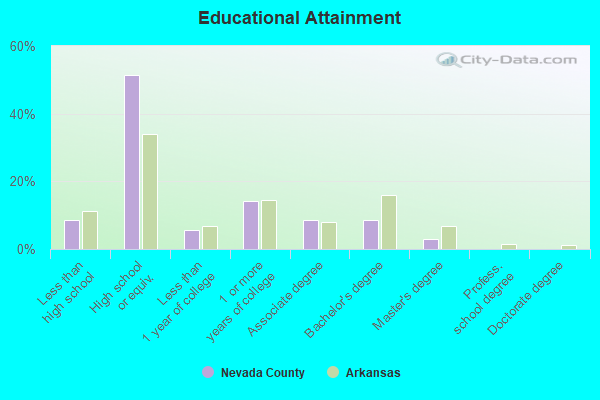
People 25 years of age or older with a high school degree or higher: 89.6%
People 25 years of age or older with a bachelor's degree or higher: 10.9%
Number of foreign born residents: 9 (0.0% naturalized citizens)
| Nevada County: | 0.1% |
| Whole state: | 5.1% |
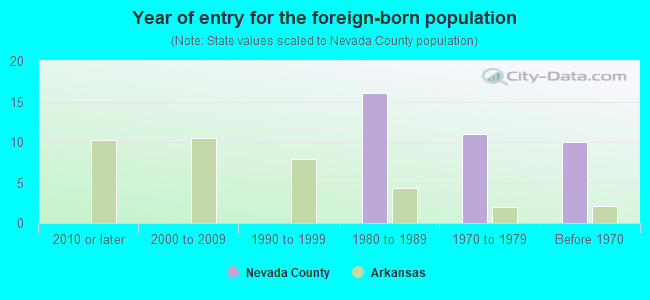
- Year of entry for the foreign-born population
- 02010 or later
- 02000 to 2009
- 01990 to 1999
- 161980 to 1989
- 111970 to 1979
- 10Before 1970
Mean travel time to work (commute): minutes
Percentage of county residents living and working in this county: 96.4%
Housing units in structures:
- One, detached: 2,987
- One, attached: 1
- Two: 109
- 3 or 4: 79
- 10 to 19: 87
- 20 or more: 20
- Mobile homes: 1,080
- Boats, RVs, vans, etc.: 14
Housing units in Nevada County with a mortgage: 754 (8 second mortgage, 6 home equity loan, 0 both second mortgage and home equity loan)
Houses without a mortgage: 0
| Here: | 100.0% with mortgage |
| State: | 98.4% with mortgage |
Religion statistics for Nevada County
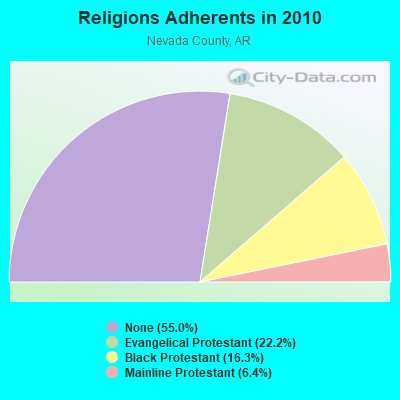
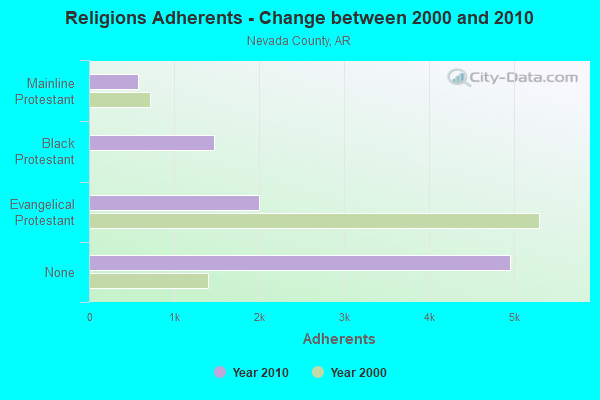
| Religion | Adherents | Congregations |
|---|---|---|
| Evangelical Protestant | 1,996 | 18 |
| Black Protestant | 1,469 | 11 |
| Mainline Protestant | 580 | 6 |
| None | 4,952 | - |
Source: Clifford Grammich, Kirk Hadaway, Richard Houseal, Dale E.Jones, Alexei Krindatch, Richie Stanley and Richard H.Taylor. 2012. 2010 U.S.Religion Census: Religious Congregations & Membership Study. Association of Statisticians of American Religious Bodies. Jones, Dale E., et al. 2002. Congregations and Membership in the United States 2000. Nashville, TN: Glenmary Research Center.
Food Environment Statistics:
| Nevada County: | 2.14 / 10,000 pop. |
| State: | 2.02 / 10,000 pop. |
| Nevada County: | 8.57 / 10,000 pop. |
| Arkansas: | 4.94 / 10,000 pop. |
| This county: | 3.22 / 10,000 pop. |
| State: | 6.66 / 10,000 pop. |
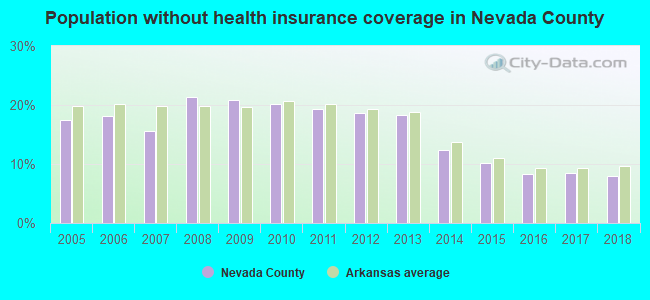
| Nevada County: | 12.4% |
| Arkansas: | 9.8% |
| Nevada County: | 30.0% |
| State: | 29.1% |
| Here: | 14.4% |
| State: | 13.6% |
Agriculture in Nevada County:
Average size of farms: 208 acresAverage value of agricultural products sold per farm: $79,113
Average value of crops sold per acre for harvested cropland: $23.68
The value of nursery, greenhouse, floriculture, and sod as a percentage of the total market value of agricultural products sold: 0.00%
The value of livestock, poultry, and their products as a percentage of the total market value of agricultural products sold: 98.80%
Average total farm production expenses per farm: $51,450
Harvested cropland as a percentage of land in farms: 19.35%
Average market value of all machinery and equipment per farm: $49,534
The percentage of farms operated by a family or individual: 95.17%
Average age of principal farm operators: 56 years
Average number of cattle and calves per 100 acres of all land in farms: 26.45
Vegetables: 62 harvested acres
Earthquake activity:
Nevada County-area historical earthquake activity is significantly above Arkansas state average. It is 442% greater than the overall U.S. average.On 11/6/2011 at 03:53:10, a magnitude 5.7 (5.7 MW, Depth: 3.2 mi, Class: Moderate, Intensity: VI - VII) earthquake occurred 233.5 miles away from Nevada County center
On 9/3/2016 at 12:02:44, a magnitude 5.8 (5.8 MW, Depth: 3.5 mi) earthquake occurred 278.1 miles away from the county center
On 5/17/2012 at 08:12:00, a magnitude 4.8 (4.8 MW, Depth: 3.1 mi, Class: Light, Intensity: IV - V) earthquake occurred 136.2 miles away from the county center
On 1/21/1982 at 00:33:54, a magnitude 4.7 (4.5 MB, 4.7 LG, 4.5 LG) earthquake occurred 120.7 miles away from the county center
On 2/28/2011 at 05:00:50, a magnitude 4.7 (4.7 MW, Depth: 2.0 mi) earthquake occurred 122.5 miles away from Nevada County center
On 5/4/2001 at 06:42:12, a magnitude 4.7 (4.2 MB, 4.7 LG, 4.5 LG) earthquake occurred 123.2 miles away from the county center
Magnitude types: regional Lg-wave magnitude (LG), body-wave magnitude (MB), moment magnitude (MW)
Most recent natural disasters:
- Arkansas Covid-19 Pandemic, Incident Period: January 20, 2020, FEMA Id: 4518, Natural disaster type: Other
- Arkansas Severe Storms, Tornadoes, Straight-line Winds, and Flooding, Incident Period: May 07, 2015 to June 15, 2015, Major Disaster (Presidential) Declared DR-4226: June 26, 2015, FEMA Id: 4226, Natural disaster type: Storm, Tornado, Flood, Wind
- Arkansas Severe Storms, Tornadoes, and Associated Flooding, Incident Period: April 14, 2011 to June 03, 2011, Major Disaster (Presidential) Declared DR-1975: May 02, 2011, FEMA Id: 1975, Natural disaster type: Storm, Tornado, Flood
- Arkansas Severe Storms and Flooding, Incident Period: December 23, 2009 to January 02, 2010, Major Disaster (Presidential) Declared DR-1872: February 04, 2010, FEMA Id: 1872, Natural disaster type: Storm, Flood
- Arkansas Severe Storms, Tornadoes, and Flooding, Incident Period: October 29, 2009 to November 08, 2009, Major Disaster (Presidential) Declared DR-1861: December 03, 2009, FEMA Id: 1861, Natural disaster type: Storm, Tornado, Flood
- Arkansas Tropical Storm Ike, Incident Period: September 13, 2008 to September 23, 2008, Major Disaster (Presidential) Declared DR-1804: October 22, 2008, FEMA Id: 1804, Natural disaster type: Tropical Storm
- Arkansas Severe Storms, Tornadoes, and Flooding, Incident Period: March 18, 2008 to April 28, 2008, Major Disaster (Presidential) Declared DR-1751: March 26, 2008, FEMA Id: 1751, Natural disaster type: Storm, Tornado, Flood
- Arkansas Hurricane Katrina, Incident Period: August 29, 2005 to October 01, 2005, Emergency Declared EM-3215: September 02, 2005, FEMA Id: 3215, Natural disaster type: Hurricane
- Arkansas Severe Storms and Flooding, Incident Period: May 30, 2004 to July 09, 2004, Major Disaster (Presidential) Declared DR-1528: June 30, 2004, FEMA Id: 1528, Natural disaster type: Storm, Flood
- Arkansas Severe Storms, Tornadoes, and Flooding, Incident Period: May 02, 2003 to June 10, 2003, Major Disaster (Presidential) Declared DR-1472: June 06, 2003, FEMA Id: 1472, Natural disaster type: Storm, Tornado, Flood
- 8 other natural disasters have been reported since 1953.
The number of natural disasters in Nevada County (18) is near the US average (15).
Major Disasters (Presidential) Declared: 15
Emergencies Declared: 2
Causes of natural disasters: Storms: 12, Floods: 9, Tornadoes: 8, Winter Storms: 2, Hurricane: 1, Tropical Storm: 1, Wind: 1, Other: 1 (Note: some incidents may be assigned to more than one category).
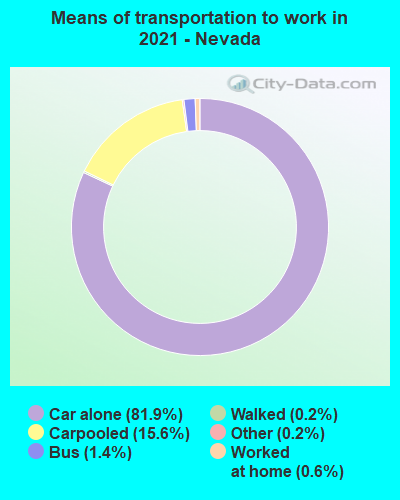
Means of transportation to work:
- Drove a car alone: 2,167 (81.5%)
- Carpooled: 291 (10.9%)
- Bus: 35 (1.3%)
- Taxicab, motorcycle, or other means: 47 (1.8%)
- Walked: 45 (1.7%)
- Worked at home: 13 (0.5%)
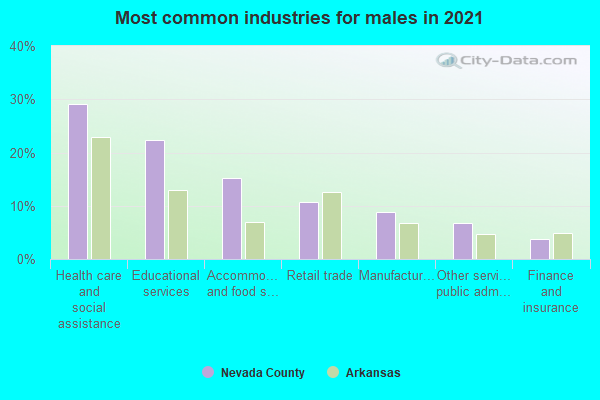
- Health care and social assistance (24%)
- Educational services (17%)
- Accommodation and food services (16%)
- Manufacturing (15%)
- Retail trade (10%)
- Finance and insurance (6%)
- Other services, except public administration (5%)
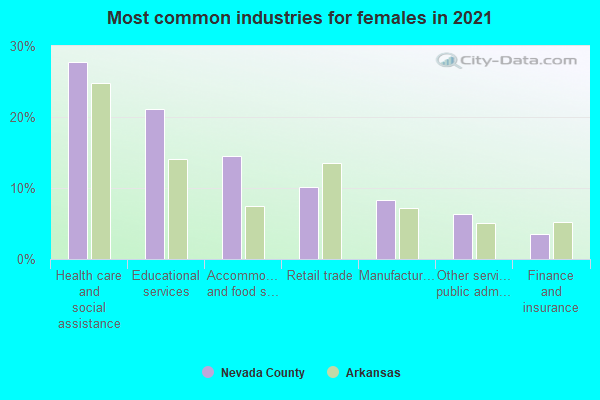
- Health care and social assistance (24%)
- Educational services (16%)
- Accommodation and food services (16%)
- Manufacturing (15%)
- Retail trade (10%)
- Finance and insurance (6%)
- Other services, except public administration (5%)
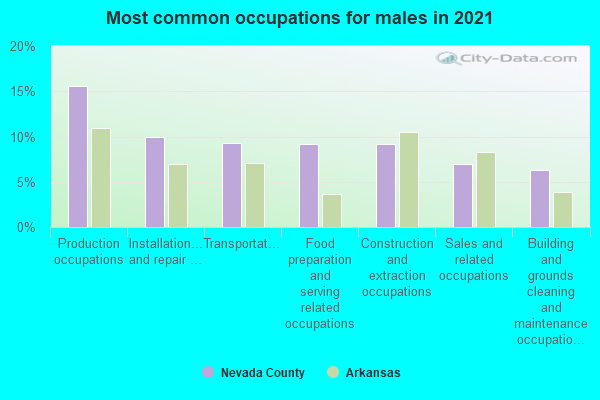
- Installation, maintenance, and repair occupations (12%)
- Office and administrative support occupations (12%)
- Transportation occupations (11%)
- Production occupations (9%)
- Food preparation and serving related occupations (9%)
- Material moving occupations (8%)
- Construction and extraction occupations (7%)
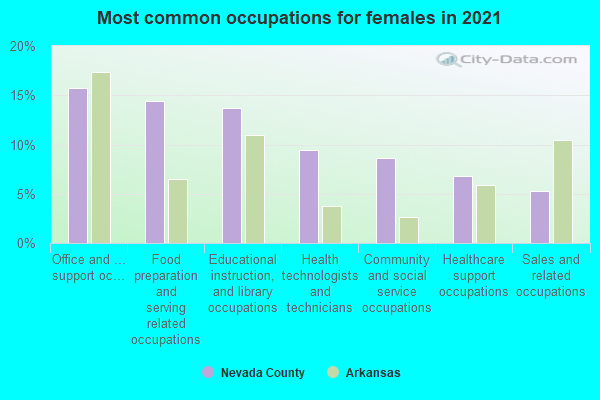
- Office and administrative support occupations (22%)
- Food preparation and serving related occupations (13%)
- Educational instruction, and library occupations (11%)
- Production occupations (8%)
- Health technologists and technicians (8%)
- Community and social service occupations (6%)
- Healthcare support occupations (5%)
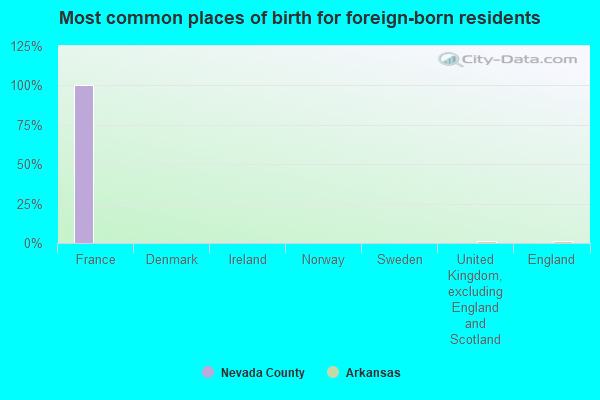
- Marshall Islands (89%)
- Ireland (0%)
- Norway (0%)
- Sweden (0%)
- United Kingdom, excluding England and Scotland (0%)
- England (0%)
- Scotland (0%)
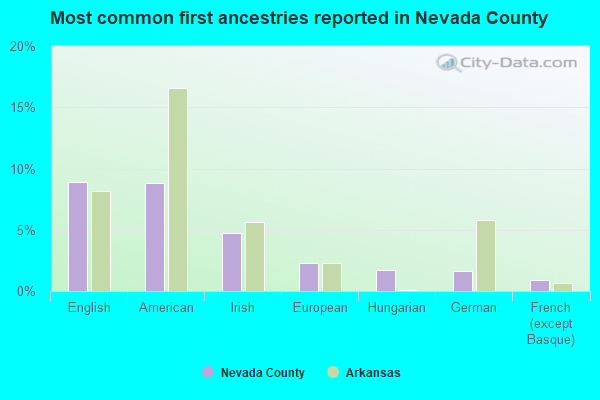
- English (6%)
- American (5%)
- Irish (4%)
- Hungarian (1%)
- German (1%)
- French (except Basque) (1%)
- European (1%)
People in group quarters in Nevada County, Arkansas in 2010:
- 135 people in nursing facilities/skilled-nursing facilities
- 13 people in local jails and other municipal confinement facilities
- 9 people in group homes intended for adults
People in group quarters in Nevada County, Arkansas in 2000:
- 163 people in nursing homes
- 102 people in homes for the mentally ill
- 19 people in local jails and other confinement facilities (including police lockups)
- 10 people in homes for the mentally retarded
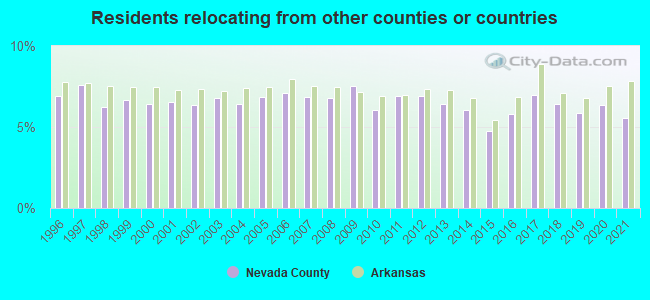
5.57% of this county's 2021 resident taxpayers lived in other counties in 2020 ($56,098 average adjusted gross income)
| Here: | 5.57% |
| Arkansas average: | 7.82% |
10 or fewer of this county's residents moved from foreign countries.
4.29% relocated from other counties in Arkansas ($24,268 average AGI)
1.27% relocated from other states ($31,837 average AGI)
Nevada County: 1.27% Arkansas average: 3.41%
Top counties from which taxpayers relocated into this county between 2020 and 2021:
| from Hempstead County, AR |
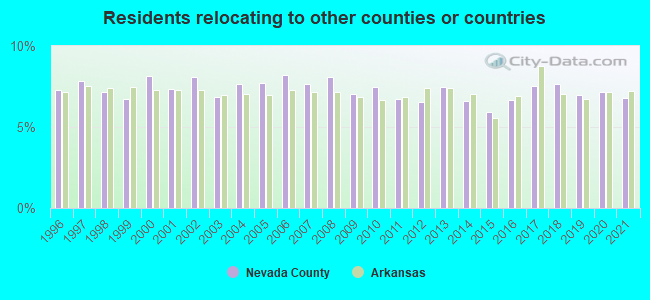
6.79% of this county's 2020 resident taxpayers moved to other counties in 2021 ($30,852 average adjusted gross income)
| Here: | 6.79% |
| Arkansas average: | 7.23% |
10 or fewer of this county's residents moved to foreign countries.
5.53% relocated to other counties in Arkansas ($25,646 average AGI)
1.26% relocated to other states ($5,201 average AGI)
Nevada County: 1.26% Arkansas average: 2.79%
Top counties to which taxpayers relocated from this county between 2020 and 2021:
| to Hempstead County, AR |
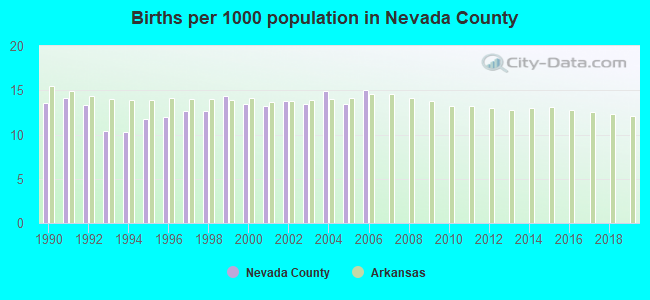
Births per 1000 population from 1990 to 1999: 12.5
Births per 1000 population from 2000 to 2006: 13.9
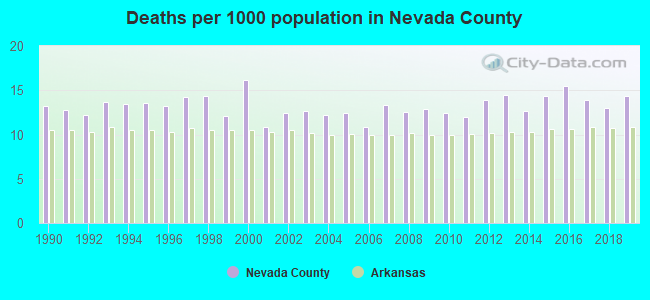
Deaths per 1000 population from 1990 to 1999: 13.3
Deaths per 1000 population from 2000 to 2009: 12.6
Deaths per 1000 population from 2010 to 2020: 13.9
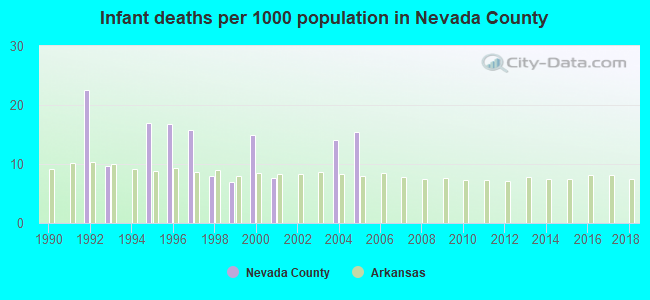
Infant deaths per 1000 live births from 1990 to 1999: 9.6
Infant deaths per 1000 live births from 2000 to 2006: 7.5
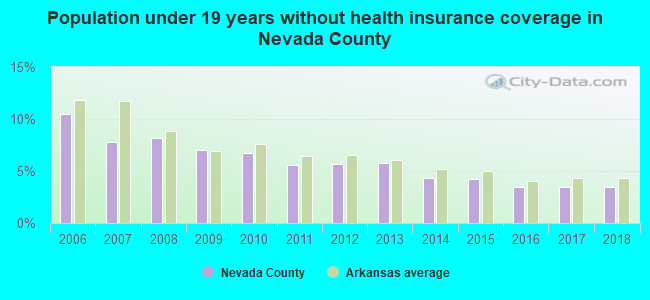
Persons under 19 years old without health insurance coverage in 2018: 3.5%
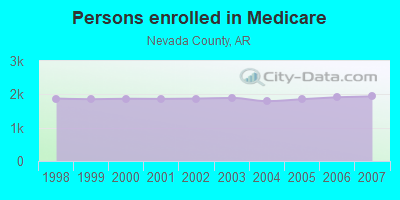
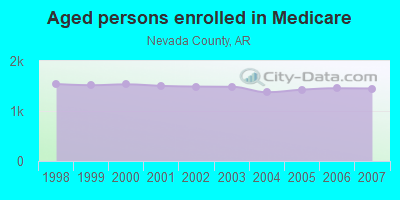
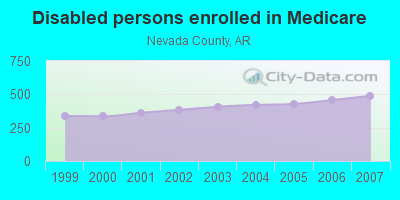
Persons enrolled in hospital insurance and/or supplemental medical insurance (Medicare) in July 1, 2007: 1,939 (1,450 aged, 489 disabled)
Children under 18 without health insurance coverage in 2007: 154 (7%)
Most common underlying causes of death in Nevada County, Arkansas in 1999 - 2019:
- Acute myocardial infarction, unspecified (316)
- Bronchus or lung, unspecified - Malignant neoplasms (72)
- Other ill-defined and unspecified causes of mortality (53)
- Alzheimer disease, unspecified (15)
- Stroke, not specified as haemorrhage or infarction (10)
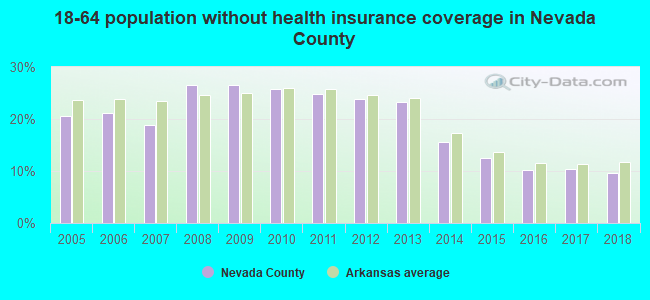
Population without health insurance coverage in 2000: 17%
Children under 18 without health insurance coverage in 2000: 13%
Household type by relationship:
Households: 8,366- Male householders: 1,481 (547 living alone), Female householders: 1,793 (679 living alone)
1,131 spouses (1,131 opposite-sex spouses), 150 unmarried partners, (150 opposite-sex unmarried partners), 2,559 children (2,440 natural, 0 adopted, 121 stepchildren), 696 grandchildren, 77 brothers or sisters, 156 parents, 0 foster children, 97 other relatives, 53 non-relatives
- In group quarters: 184
Size of family households: 983 2-persons, 446 3-persons, 367 4-persons, 115 5-persons, 66 6-persons, 36 7-or-more-persons.
Size of nonfamily households: 1,227 1-person, 50 2-persons.
578 married couples with children.
674 single-parent households (62 men, 612 women).
99.2% of residents of Nevada speak English at home.
0.5% of residents speak Spanish at home (86% speak English very well, 14% speak English well).
0.1% of residents speak Asian or Pacific Island language at home (100% speak English not well).
In fiscal year 2004:
Federal Government expenditure: $65,738,000 ($6,833 per capita)
Department of Defense expenditure: $3,590,000
Federal direct payments to individuals for retirement and disability: $26,495,000
Federal other direct payments to individuals: $18,323,000
Federal direct payments not to individuals: $334,000
Federal grants: $15,382,000
Federal procurement contracts: $604,000 ($7,000 Department of Defense)
Federal salaries and wages: $4,600,000 ($2,333,000 Department of Defense)
Federal Government direct loans: $230,000
Federal guaranteed/insured loans: $710,000
Federal Government insurance: $169,000
Population change from April 1, 2000 to July 1, 2005:
Births: 714| Here: | 75 per 1000 residents |
| State: | 72 per 1000 residents |
Deaths: 675
| Here: | 71 per 1000 residents |
| State: | 53 per 1000 residents |
Net international migration: +57
| Here: | +6 per 1000 residents |
| State: | +8 per 1000 residents |
Net internal migration: -487
| Here: | |
| State: |
Total withdrawal of fresh water for public supply: 1.00 millions of gallons per day (24% from ground, 76% from surface)
| Here: | 5.9 |
| State: | 6.1 |
| Here: | 4.8 |
| State: | 4.3 |
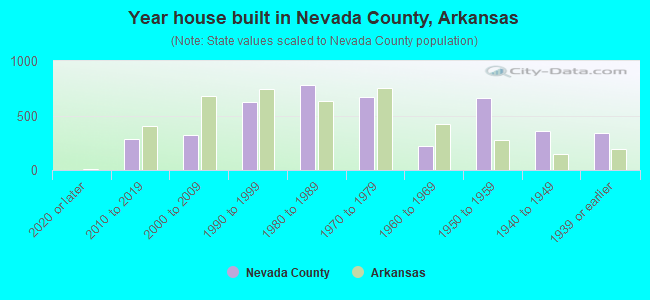
- Year house built in Nevada County, Arkansas
- 32020 or later
- 3132010 to 2019
- 4172000 to 2009
- 5811990 to 1999
- 7781980 to 1989
- 6981970 to 1979
- 2711960 to 1969
- 5811950 to 1959
- 3571940 to 1949
- 2341939 or earlier
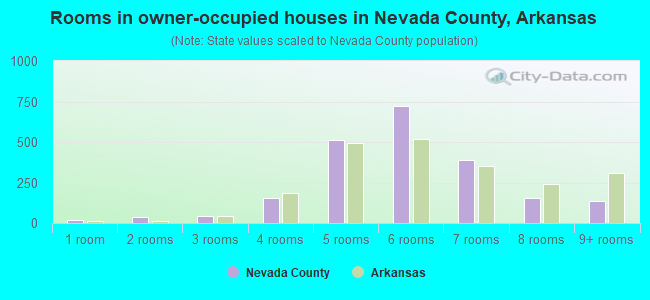
- Rooms in owner-occupied houses in Nevada County, Arkansas
- 41 room
- 342 rooms
- 413 rooms
- 1704 rooms
- 5505 rooms
- 6956 rooms
- 4607 rooms
- 1218 rooms
- 1109+ rooms
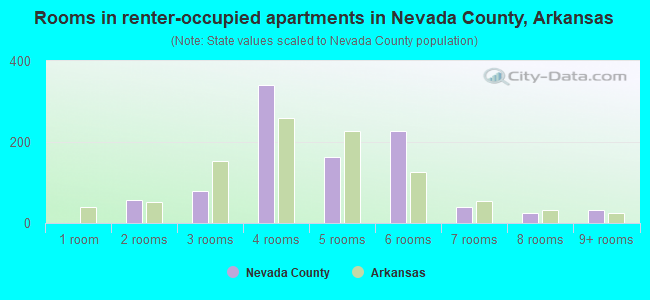
- Rooms in renter-occupied apartments in Nevada County, Arkansas
- 01 room
- 422 rooms
- 713 rooms
- 3764 rooms
- 1665 rooms
- 2876 rooms
- 397 rooms
- 218 rooms
- 339+ rooms
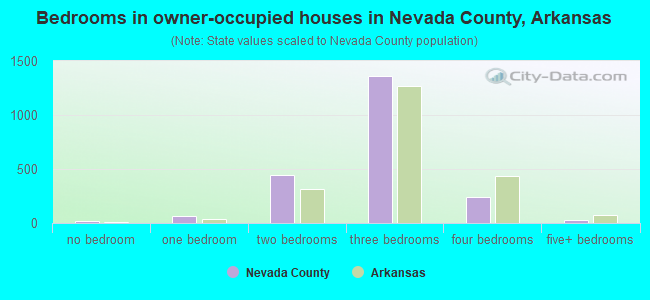
- Bedrooms in owner-occupied houses in Nevada County, Arkansas
- 4no bedroom
- 701 bedroom
- 4312 bedrooms
- 1,3823 bedrooms
- 2724 bedrooms
- 265+ bedrooms
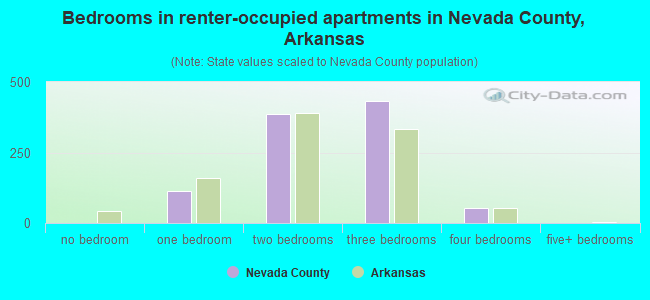
- Bedrooms in renter-occupied apartments in Nevada County, Arkansas
- 0no bedroom
- 1151 bedroom
- 4392 bedrooms
- 4613 bedrooms
- 524 bedrooms
- 05+ bedrooms
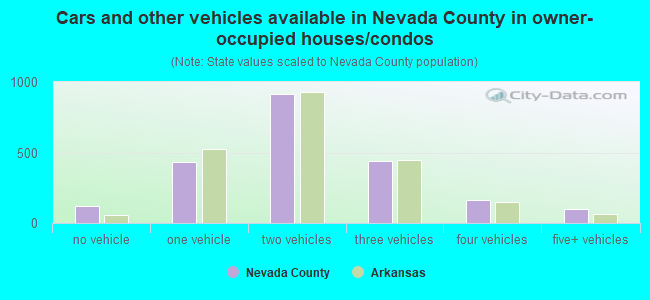
- Cars and other vehicles available in Nevada County in owner-occupied houses/condos
- 76no vehicle
- 4431 vehicle
- 9632 vehicles
- 4333 vehicles
- 1804 vehicles
- 1015+ vehicles
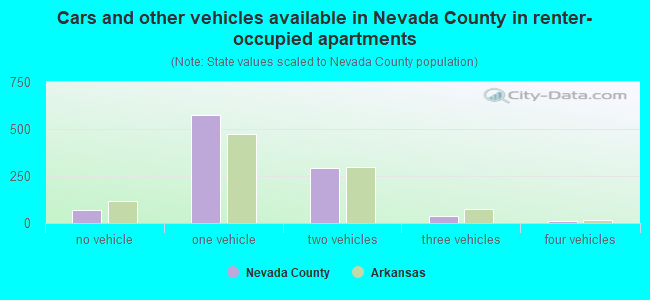
- Cars and other vehicles available in Nevada County in renter-occupied apartments
- 85no vehicle
- 6701 vehicle
- 3162 vehicles
- 163 vehicles
- 24 vehicles
- 15+ vehicles
81.3% of Nevada County residents lived in the same house 1 years ago.
Out of people who lived in different houses, 22% lived in this county.
Out of people who lived in different counties, 55% lived in Arkansas.
| Nevada County: | 81.3% |
| State average: | 87.0% |
Place of birth for U.S.-born residents:
- This state: 5,795
- Other state: 2,527
- Northeast: 299
- Midwest: 587
- South: 1,358
- West: 268
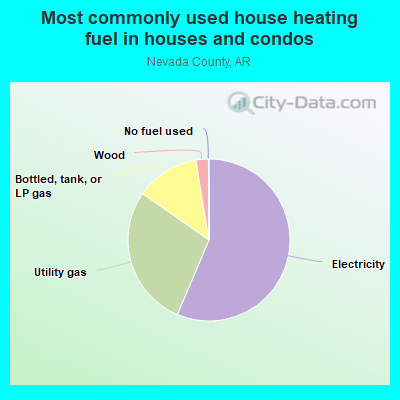
- 58.7%Electricity
- 26.3%Utility gas
- 13.0%Bottled, tank, or LP gas
- 1.7%Wood
- 0.3%No fuel used
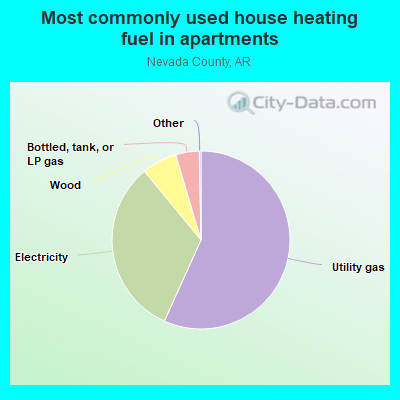
- 65.0%Utility gas
- 26.1%Electricity
- 6.3%Wood
- 2.7%Bottled, tank, or LP gas
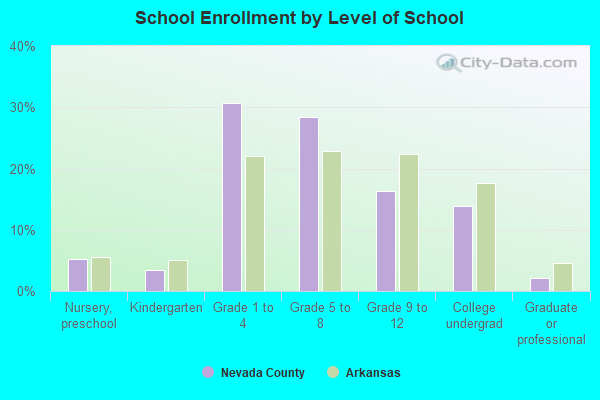
Private vs. public school enrollment:
| Here: | 10.1% |
| Arkansas: | 10.5% |
| Here: | 17.7% |
| Arkansas: | 8.7% |
| Here: | 9.7% |
| Arkansas: | 19.4% |
Nevada County government finances - Expenditure in 2017:
- Current Operations - General - Other: $1,600,000
Solid Waste Management: $645,000
Correctional Institutions: $617,000
Police Protection: $362,000
Financial Administration: $289,000
Central Staff Services: $260,000
Judicial and Legal Services: $96,000
Libraries: $74,000
Health - Other: $45,000
Natural Resources - Other: $30,000
- Miscellaneous - General Revenue - Other: $55,000
Sale of Property: $7,000
Rents: $5,000
Interest Earnings: $4,000
- Other Funds - Cash and Securities: $445,000
- Revenue - Gas Utilities: $41,000
- State Intergovernmental - Highways: $619,000
General Local Government Support: $539,000
- Tax - Property: $3,723,000
- Total Salaries and Wages: $1,630,000
Nevada County government finances - Revenue in 2017:
- Current Operations - General - Other: $1,600,000
Solid Waste Management: $645,000
Correctional Institutions: $617,000
Police Protection: $362,000
Financial Administration: $289,000
Central Staff Services: $260,000
Judicial and Legal Services: $96,000
Libraries: $74,000
Health - Other: $45,000
Natural Resources - Other: $30,000
- Miscellaneous - General Revenue - Other: $55,000
Sale of Property: $7,000
Rents: $5,000
Interest Earnings: $4,000
- Other Funds - Cash and Securities: $445,000
- Revenue - Gas Utilities: $41,000
- State Intergovernmental - Highways: $619,000
General Local Government Support: $539,000
- Tax - Property: $3,723,000
- Total Salaries and Wages: $1,630,000
Nevada County government finances - Debt in 2017:
- Current Operations - General - Other: $1,600,000
Solid Waste Management: $645,000
Correctional Institutions: $617,000
Police Protection: $362,000
Financial Administration: $289,000
Central Staff Services: $260,000
Judicial and Legal Services: $96,000
Libraries: $74,000
Health - Other: $45,000
Natural Resources - Other: $30,000
- Miscellaneous - General Revenue - Other: $55,000
Sale of Property: $7,000
Rents: $5,000
Interest Earnings: $4,000
- Other Funds - Cash and Securities: $445,000
- Revenue - Gas Utilities: $41,000
- State Intergovernmental - Highways: $619,000
General Local Government Support: $539,000
- Tax - Property: $3,723,000
- Total Salaries and Wages: $1,630,000
Nevada County government finances - Cash and Securities in 2017:
- Current Operations - General - Other: $1,600,000
Solid Waste Management: $645,000
Correctional Institutions: $617,000
Police Protection: $362,000
Financial Administration: $289,000
Central Staff Services: $260,000
Judicial and Legal Services: $96,000
Libraries: $74,000
Health - Other: $45,000
Natural Resources - Other: $30,000
- Miscellaneous - General Revenue - Other: $55,000
Sale of Property: $7,000
Rents: $5,000
Interest Earnings: $4,000
- Other Funds - Cash and Securities: $445,000
- Revenue - Gas Utilities: $41,000
- State Intergovernmental - Highways: $619,000
General Local Government Support: $539,000
- Tax - Property: $3,723,000
- Total Salaries and Wages: $1,630,000
Supplemental Security Income (SSI) in 2006:
- Total number of recipients: 543
- Number of aged recipients: 57
- Number of blind and disabled recipients: 486
- Number of recipients under 18: 79
- Number of recipients between 18 and 64: 334
- Number of recipients older than 64: 130
- Number of recipients also receiving OASDI: 246
- Amount of payments (thousands of dollars): 213
| Most common first names in Nevada County, AR among deceased individuals | ||
| Name | Count | Lived (average) |
|---|---|---|
| James | 130 | 71.7 years |
| John | 115 | 77.0 years |
| William | 93 | 76.6 years |
| Robert | 73 | 74.0 years |
| Mary | 70 | 76.6 years |
| Willie | 48 | 78.9 years |
| George | 45 | 78.5 years |
| Thomas | 41 | 75.9 years |
| Henry | 41 | 76.0 years |
| Charles | 38 | 72.0 years |
| Most common last names in Nevada County, AR among deceased individuals | ||
| Last name | Count | Lived (average) |
|---|---|---|
| Johnson | 73 | 75.9 years |
| Williams | 62 | 73.3 years |
| Smith | 61 | 76.1 years |
| White | 45 | 77.7 years |
| Jones | 44 | 78.7 years |
| Brown | 43 | 75.4 years |
| Gulley | 37 | 74.3 years |
| Martin | 33 | 75.1 years |
| Ward | 32 | 79.4 years |
| Harris | 32 | 75.0 years |
| Businesses in Nevada County, AR | ||||
| Name | Count | Name | Count | |
|---|---|---|---|---|
| FedEx | 1 | SONIC Drive-In | 1 | |
| H&R Block | 1 | Subway | 1 | |
| Hardee's | 1 | UPS | 1 | |
| Pizza Hut | 1 | |||