Stevens County, Washington (WA)
County owner-occupied free and clear houses and condos in 2010: 5,460
County owner-occupied houses and condos in 2000: 11,731
Renter-occupied apartments: 3,835 (it was 3,286 in 2000)
| % of renters here: | 22% |
| State: | 36% |
Land area: 2478 sq. mi.
Water area: 62.3 sq. mi.
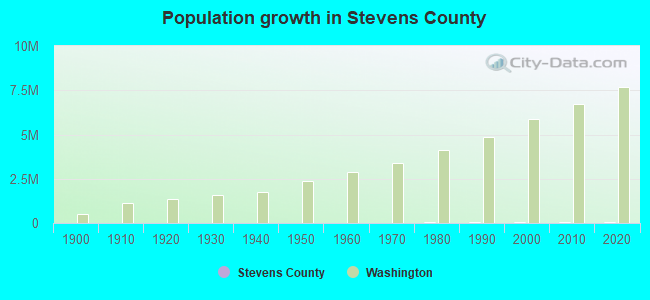
Population density: 19 people per square mile (low).
Industries providing employment: Educational, health and social services (23.9%), Retail trade (12.4%).
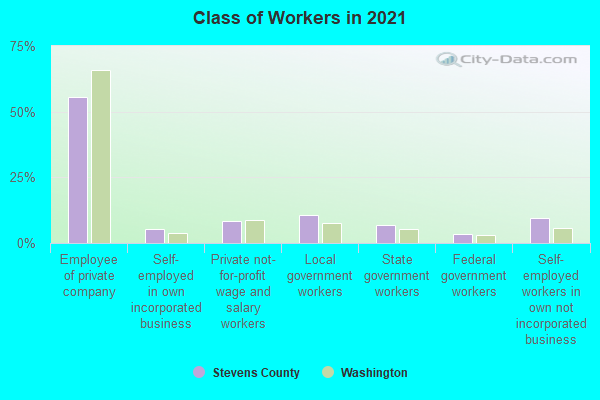
Type of workers:
- Private wage or salary: 69%
- Government: 21%
- Self-employed, not incorporated: 9%
- Unpaid family work: 0%
- OSM Map
- General Map
- Google Map
- MSN Map

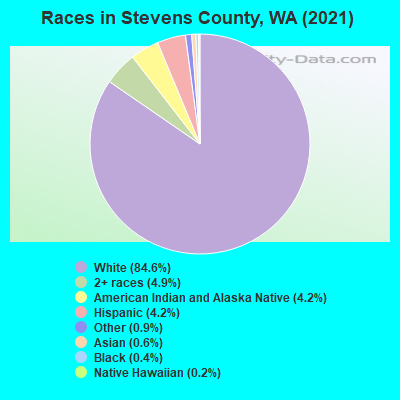
- 39,09984.0%White Non-Hispanic Alone
- 2,4405.2%Two or more races
- 2,0084.3%American Indian and Alaska Native alone
- 2,0034.3%Hispanic or Latino
- 4280.9%Some other race alone
- 3480.7%Asian alone
- 1460.3%Black Non-Hispanic Alone
- 1010.2%Native Hawaiian and Other
Pacific Islander alone
| Median resident age: | 47.4 years |
| Washington median age: | 38.4 years |
| Males: 23,761 | |
| Females: 23,604 |

 | The Vaccine doesn't stop the spread of Covid/Delta (672 replies) |
| Any unique facts about Colville, WA??? (138 replies) |
| Stevens County, Wa community traits (21 replies) |
| Should Washington state split into two states? (68 replies) |
| Deer Park or Cheney? Help! (4 replies) |
| Nine Mile Falls / Suncrest Community Events (6 replies) |
| Stevens County: | 2.0 people |
| Washington: | 3 people |
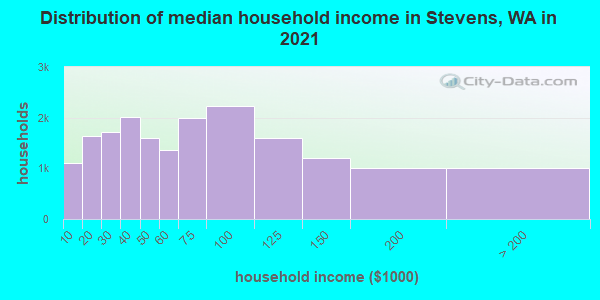
Estimated median household income in 2022: $63,058 ($34,673 in 1999)
| This county: | $63,058 |
| Washington: | $91,306 |
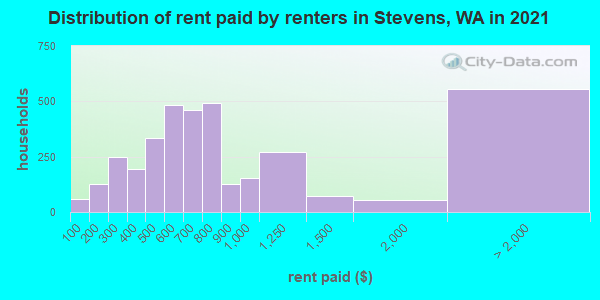
Median contract rent in 2022 for apartments: $724 (lower quartile is $525, upper quartile is $885)
| This county: | $724 |
| State: | $1495 |
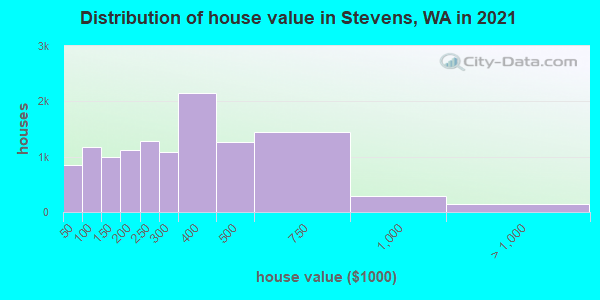
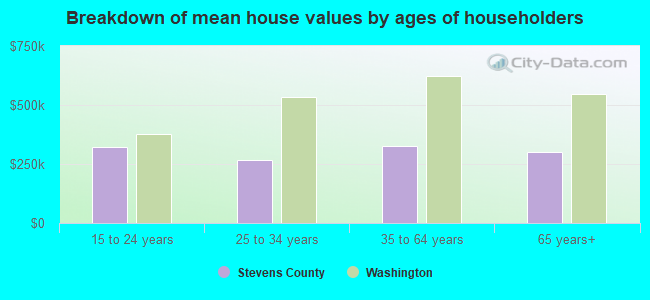
Estimated median house or condo value in 2022: $333,592 (it was $107,800 in 2000)
| Stevens: | $333,592 |
| Washington: | $569,500 |
Median monthly housing costs for homes and condos with a mortgage: $1,525
Median monthly housing costs for units without a mortgage: $444
Institutionalized population: 177
Crime in 2021 (reported by the sheriff's office or county police, not the county total):
- Murders: 6
- Rapes: 7
- Robberies: 2
- Assaults: 23
- Burglaries: 94
- Thefts: 194
- Auto thefts: 38
Crime in 2020 (reported by the sheriff's office or county police, not the county total):
- Murders: 2
- Rapes: 2
- Robberies: 2
- Assaults: 25
- Burglaries: 114
- Thefts: 188
- Auto thefts: 48
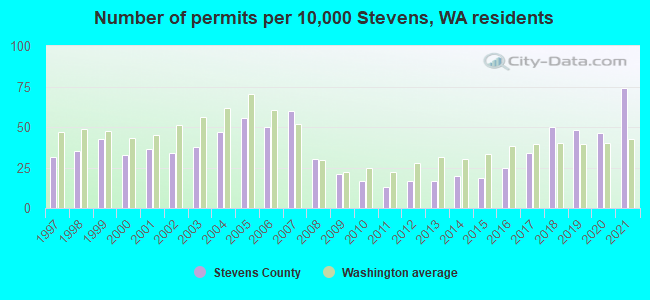
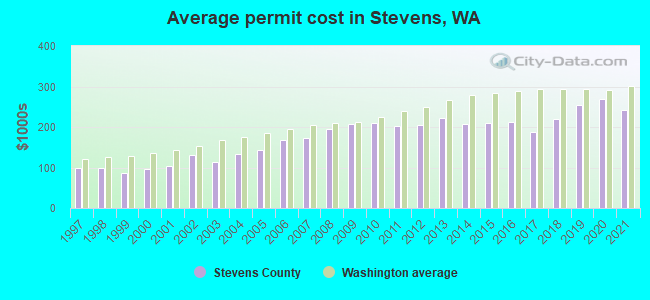
Single-family new house construction building permits:
- 2022: 267 buildings, average cost: $248,900
- 2021: 298 buildings, average cost: $240,500
- 2020: 186 buildings, average cost: $268,200
- 2019: 192 buildings, average cost: $254,700
- 2018: 200 buildings, average cost: $219,000
- 2017: 136 buildings, average cost: $186,600
- 2016: 99 buildings, average cost: $211,600
- 2015: 74 buildings, average cost: $211,300
- 2014: 79 buildings, average cost: $207,100
- 2013: 66 buildings, average cost: $222,400
- 2012: 67 buildings, average cost: $203,900
- 2011: 52 buildings, average cost: $203,300
- 2010: 66 buildings, average cost: $211,000
- 2009: 84 buildings, average cost: $207,400
- 2008: 122 buildings, average cost: $194,200
- 2007: 240 buildings, average cost: $172,700
- 2006: 200 buildings, average cost: $168,700
- 2005: 223 buildings, average cost: $142,700
- 2004: 187 buildings, average cost: $133,200
- 2003: 152 buildings, average cost: $112,500
- 2002: 135 buildings, average cost: $130,300
- 2001: 145 buildings, average cost: $103,000
- 2000: 131 buildings, average cost: $97,200
- 1999: 171 buildings, average cost: $86,100
- 1998: 141 buildings, average cost: $98,700
- 1997: 125 buildings, average cost: $100,200
Median real estate property taxes paid for housing units with mortgages in 2022: $2,213 (0.6%)
Median real estate property taxes paid for housing units with no mortgage in 2022: $1,680 (0.6%)
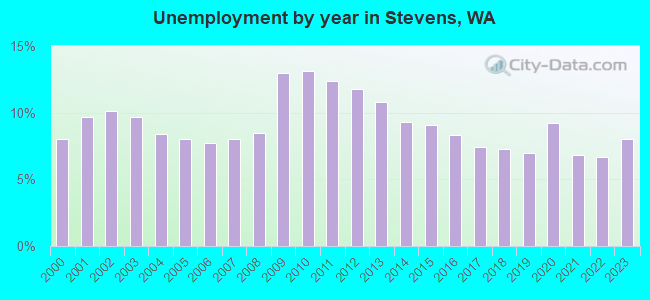
| Stevens County: | 13.4% |
| Washington: | 10.0% |
Median age of residents in 2022: 47.4 years old
(Males: 46.7 years old, Females: 48.4 years old)
(Median age for: White residents: 49.9 years old, Black residents: 65.1 years old, American Indian residents: 34.8 years old, Asian residents: 48.9 years old, Hispanic or Latino residents: 27.8 years old, Other race residents: 34.9 years old)
Fair market rent in 2006 for a 1-bedroom apartment in Stevens County is $437 a month.
Fair market rent for a 2-bedroom apartment is $558 a month.
Fair market rent for a 3-bedroom apartment is $764 a month.
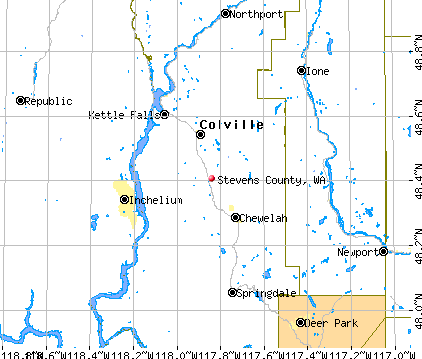
Cities in this county include: Loon Lake, Colville, Chewelah, Spokane Reservation, Kettle Falls, Columbia, Clayton, Northport, Springdale, Addy.
2023 air pollution in Stevens County:
Particulate Matter (PM10) Annual: 25.5 µg/m3. Near U.S. average.
Particulate Matter (PM2.5) Annual: 5.7 µg/m3(standard limit: 15.0 µg/m3). Near U.S. average.
Notable locations in this county outside city limits:
Notable locations in Stevens County: Pasayten Airstrip Guard Station (A), Loup Loup Recreation Area (B), South Creek Campground (C), Flat Campground (D), Providence Orchards (E), Coyote Camp (F), Sweat Creek Campground (G), Leese (H), Foggy Dew Campground (I), Bedard School (J), Cougar Camp (K), Leighty Camp (L), Early Winters Campground (M), Kipling (N), Bear Creek Golf Course (O), Four Point Corral (P), Chief Joseph (Q), Winthrop National Fish Hatchery (R), Layout Camp (S), Gambles Mill (T). Display/hide their locations on the map
Churches in Stevens County include: Saint Marys Mission (A), Tonasket Free Methodist Church (B), Omak Foursquare Church (C), Valley Christian Fellowship Church (D), Okanogan Valley Alliance Church (E), Our Savior Lutheran Church of Okanogan (F), Kingdom Hall of Jehovahs Witnesses (G), The Church of Jesus Christ of Latter Day Saints (H), Kingdom Hall of Jehovahs Witnesses (I). Display/hide their locations on the map
Cemeteries: Indian Cemetery (1), Riverview Cemetery (2), Tunk Valley Cemetery (3), Methow Cemetery (4), Beaver Creek Cemetery (5), Okanogan Memorial Gardens (6), Ruby Cemetery (7). Display/hide their locations on the map
Lakes, reservoirs, and swamps: Siegels Slough (A), Sidley Lake (B), Green Lake (C), Buck Lake (D), Green Lake (E), Buckskin Lake (F), Bugger Lake (G), Laura Lake (H). Display/hide their locations on the map
Streams, rivers, and creeks: Bailey Creek (A), Baldy Creek (B), Banker Creek (C), Bannon Creek (D), Barnell Creek (E), Basin Creek (F), Bear Creek (G), Beauty Creek (H), Bench Creek (I). Display/hide their locations on the map
Parks in Stevens County include: Lake Osoyoos State Park (1), Indian Dan State Wildlife Recreation Area (2), Roundup Park (3), Goodenough Park (4), Fourteen Mile Recreation Site (5), Shady Park (6), Conconully State Park (7), Sinlahekin Wildlife Recreation Area (8), Deer Park (9). Display/hide their locations on the map
Neighboring counties: Cavalier County, North Dakota  , Grant County
  , San Juan County
  , Lake of the Woods County, Minnesota , Roosevelt County, Montana , Polk County, Minnesota , Red Lake County, Minnesota .
| Here: | 7.1% |
| Washington: | 4.6% |
Current college students: 955
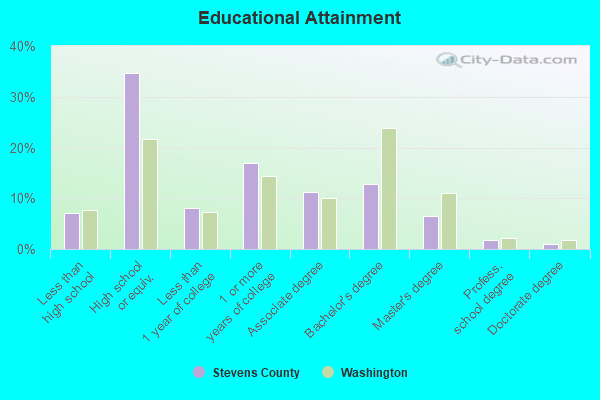
People 25 years of age or older with a high school degree or higher: 92.0%
People 25 years of age or older with a bachelor's degree or higher: 20.9%
Number of foreign born residents: 1,050 (67.6% naturalized citizens)
| Stevens County: | 2.2% |
| Whole state: | 15.3% |
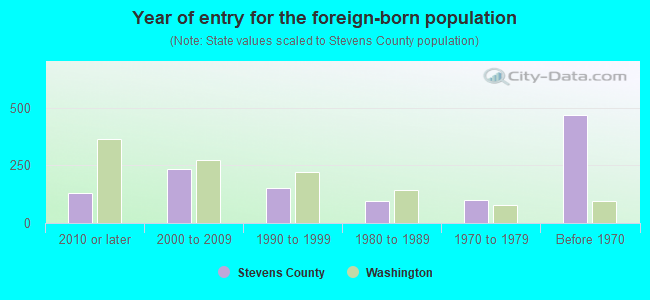
- Year of entry for the foreign-born population
- 1482010 or later
- 1062000 to 2009
- 1761990 to 1999
- 941980 to 1989
- 1011970 to 1979
- 469Before 1970
Mean travel time to work (commute): minutes
Percentage of county residents living and working in this county: 98.8%
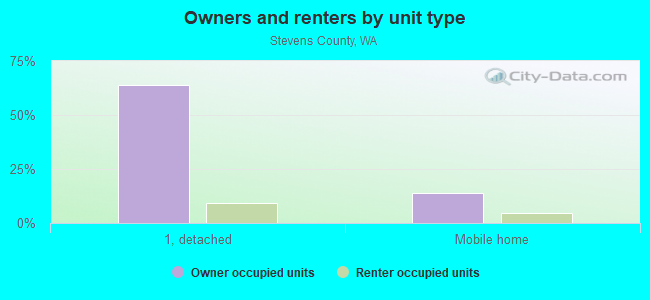
Housing units in structures:
- One, detached: 17,137
- One, attached: 143
- Two: 194
- 3 or 4: 160
- 5 to 9: 261
- 10 to 19: 239
- 20 to 49: 235
- 50 or more: 70
- Mobile homes: 3,914
- Boats, RVs, vans, etc.: 257
Housing units in Stevens County with a mortgage: 8,118 (600 second mortgage, 0 home equity loan, 556 both second mortgage and home equity loan)
Houses without a mortgage: 418
| Here: | 1.9% with mortgage |
| State: | 98.0% with mortgage |
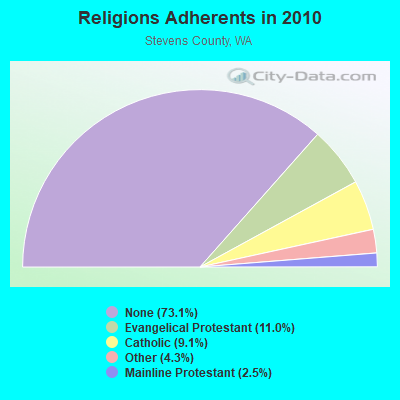
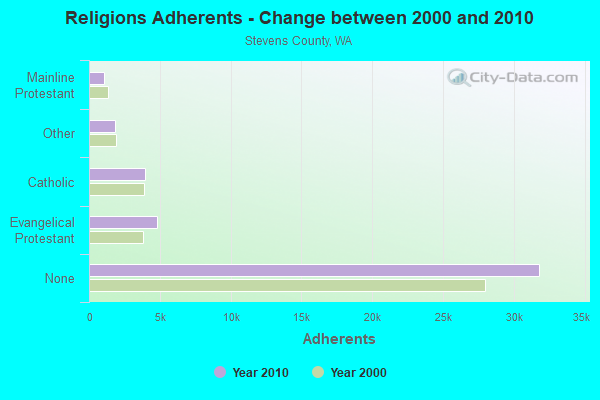
Religion statistics for Stevens County
| Religion | Adherents | Congregations |
|---|---|---|
| Evangelical Protestant | 4,803 | 46 |
| Catholic | 3,974 | 10 |
| Other | 1,860 | 7 |
| Mainline Protestant | 1,094 | 8 |
| None | 31,800 | - |
Source: Clifford Grammich, Kirk Hadaway, Richard Houseal, Dale E.Jones, Alexei Krindatch, Richie Stanley and Richard H.Taylor. 2012. 2010 U.S.Religion Census: Religious Congregations & Membership Study. Association of Statisticians of American Religious Bodies. Jones, Dale E., et al. 2002. Congregations and Membership in the United States 2000. Nashville, TN: Glenmary Research Center.
Food Environment Statistics:
| Stevens County: | 2.16 / 10,000 pop. |
| State: | 2.06 / 10,000 pop. |
| Here: | 0.24 / 10,000 pop. |
| Washington: | 0.19 / 10,000 pop. |
| This county: | 1.20 / 10,000 pop. |
| Washington: | 1.18 / 10,000 pop. |
| Stevens County: | 2.64 / 10,000 pop. |
| Washington: | 2.67 / 10,000 pop. |
| This county: | 6.95 / 10,000 pop. |
| State: | 8.26 / 10,000 pop. |
| Stevens County: | 8.3% |
| Washington: | 7.7% |
| Stevens County: | 27.0% |
| State: | 25.7% |
| Here: | 10.8% |
| State: | 13.9% |
Agriculture in Stevens County:
Average size of farms: 416 acresAverage value of agricultural products sold per farm: $22,258
Average value of crops sold per acre for harvested cropland: $159.84
The value of nursery, greenhouse, floriculture, and sod as a percentage of the total market value of agricultural products sold: 14.06%
The value of livestock, poultry, and their products as a percentage of the total market value of agricultural products sold: 59.10%
Average total farm production expenses per farm: $20,922
Harvested cropland as a percentage of land in farms: 13.68%
Irrigated harvested cropland as a percentage of land in farms: 13.49%
Average market value of all machinery and equipment per farm: $42,266
The percentage of farms operated by a family or individual: 94.25%
Average age of principal farm operators: 56 years
Average number of cattle and calves per 100 acres of all land in farms: 5.68
Milk cows as a percentage of all cattle and calves: 7.20%
All wheat for grain: 7331 harvested acres
Vegetables: 33 harvested acres
Land in orchards: 214 acres
Tornado activity:
Stevens County historical area-adjusted tornado activity is significantly below Washington state average. It is 62904228.2 times below overall U.S. average.Earthquake activity:
Stevens County-area historical earthquake activity is significantly above Washington state average. It is 879% greater than the overall U.S. average.On 4/13/1949 at 19:55:42, a magnitude 7.0 (7.0 UK, Class: Major, Intensity: VIII - XII) earthquake occurred 230.4 miles away from Stevens County center, causing $80,000,000 total damage
On 2/28/2001 at 18:54:32, a magnitude 6.8 (6.5 MB, 6.6 MS, 6.8 MW, Class: Strong, Intensity: VII - IX) earthquake occurred 238.2 miles away from the county center, causing $2,000,000,000 total damage and $305,000,000 insured losses
On 2/28/2001 at 18:54:32, a magnitude 6.8 (6.8 MD, Depth: 32.2 mi) earthquake occurred 242.9 miles away from the county center
On 8/18/1959 at 06:37:13, a magnitude 7.7 (7.7 UK) earthquake occurred 433.0 miles away from the county center, causing $26,000,000 total damage
On 10/28/1983 at 14:06:06, a magnitude 7.3 (6.2 MB, 7.3 MS, 7.0 MW) earthquake occurred 356.2 miles away from Stevens County center, causing 2 deaths (2 shaking deaths) and 3 injuries, causing $15,000,000 total damage
On 4/29/1965 at 15:28:43, a magnitude 6.6 (6.6 UK) earthquake occurred 221.4 miles away from the county center, causing $28,000,000 total damage
Magnitude types: body-wave magnitude (MB), duration magnitude (MD), surface-wave magnitude (MS), moment magnitude (MW)
Most recent natural disasters:
- Washington Covid-19 Pandemic, Incident Period: January 20, 2020, Major Disaster (Presidential) Declared DR-4481-WA: March 22, 2020, FEMA Id: 4481, Natural disaster type: Other
- Washington Severe Storms, Straight-line Winds, Flooding, Landslides, and Mudslides, Incident Period: November 12, 2015 to November 21, 2015, Major Disaster (Presidential) Declared DR-4249: January 15, 2016, FEMA Id: 4249, Natural disaster type: Storm, Mudslide, Landslide, Flood, Wind
- Washington Wildfires, Incident Period: August 13, 2015 to September 10, 2015, Emergency Declared EM-3372: August 21, 2015, FEMA Id: 3372, Natural disaster type: Fire
- Washington Wildfires and Mudslides, Incident Period: August 09, 2015 to September 10, 2015, Major Disaster (Presidential) Declared DR-4243: October 20, 2015, FEMA Id: 4243, Natural disaster type: Fire, Mudslide
- Washington Slide Creek Fire, Incident Period: August 26, 2010 to August 31, 2010, Fire Management Assistance Declared: August 27, 2010, FEMA Id: 2854, Natural disaster type: Fire
- Washington Severe Winter Storm and Record and Near Record Snow, Incident Period: December 12, 2008 to January 05, 2009, Major Disaster (Presidential) Declared DR-1825: March 02, 2009, FEMA Id: 1825, Natural disaster type: Winter Storm, Snow
- Washington Valley Mill Fire, Incident Period: August 08, 2006 to August 11, 2006, Fire Management Assistance Declared: August 08, 2006, FEMA Id: 2663, Natural disaster type: Fire
- Washington Hurricane Katrina Evacuation, Incident Period: August 29, 2005 to October 01, 2005, Emergency Declared EM-3227: September 07, 2005, FEMA Id: 3227, Natural disaster type: Hurricane
- Washington Flooding, Incident Period: May 26, 1998 to May 29, 1998, Major Disaster (Presidential) Declared DR-1252: October 05, 1998, FEMA Id: 1252, Natural disaster type: Flood
- Washington Severe Storms/Flooding/Landslides/Mudslides, Incident Period: March 18, 1997 to March 28, 1997, Major Disaster (Presidential) Declared DR-1172: April 02, 1997, FEMA Id: 1172, Natural disaster type: Storm, Mudslide, Landslide, Flood
- 6 other natural disasters have been reported since 1953.
The number of natural disasters in Stevens County (16) is near the US average (15).
Major Disasters (Presidential) Declared: 11
Emergencies Declared: 3
Causes of natural disasters: Floods: 6, Fires: 5, Mudslides: 4, Storms: 3, Landslides: 2, Snows: 2, Winter Storms: 2, Drought: 1, Heavy Rain: 1, Hurricane: 1, Volcanic Eruption: 1, Wind: 1, Other: 1 (Note: some incidents may be assigned to more than one category).
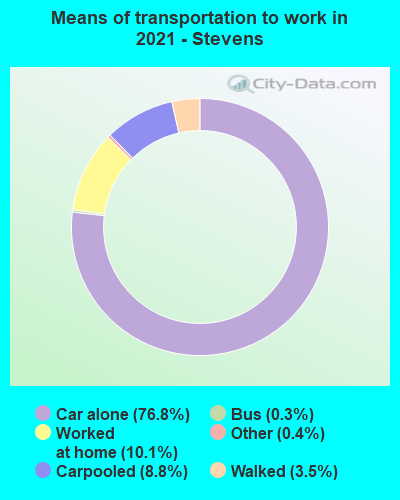
Means of transportation to work:
- Drove a car alone: 10,124 (71.1%)
- Carpooled: 1,350 (9.5%)
- Bus: 32 (0.2%)
- Long-distance train or commuter rail: 1 (0.0%)
- Ferryboat: 1 (0.0%)
- Taxicab, motorcycle, or other means: 77 (0.5%)
- Bicycle: 16 (0.1%)
- Walked: 405 (2.8%)
- Worked at home: 2,181 (15.3%)
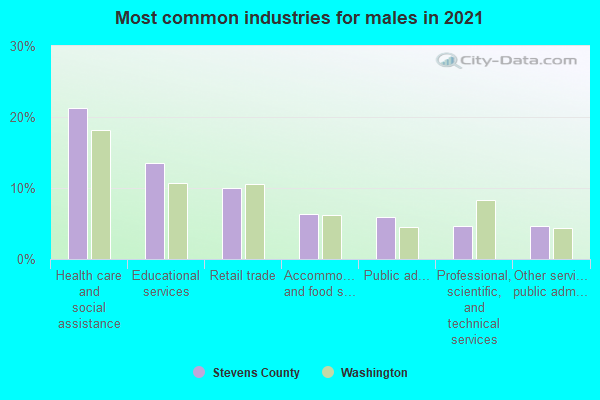
- Health care and social assistance (22%)
- Educational services (13%)
- Retail trade (10%)
- Accommodation and food services (8%)
- Public administration (6%)
- Professional, scientific, and technical services (5%)
- Finance and insurance (4%)
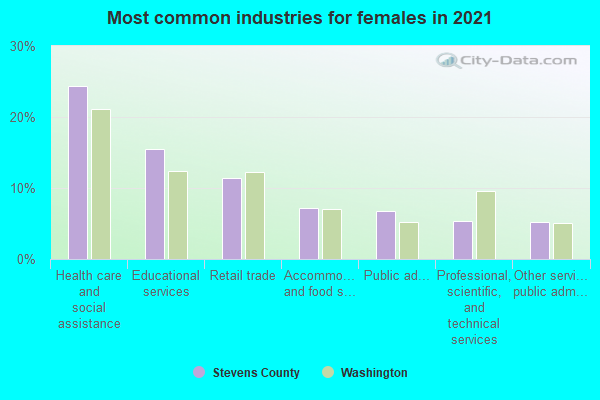
- Health care and social assistance (25%)
- Educational services (14%)
- Retail trade (11%)
- Accommodation and food services (9%)
- Public administration (6%)
- Professional, scientific, and technical services (6%)
- Finance and insurance (5%)
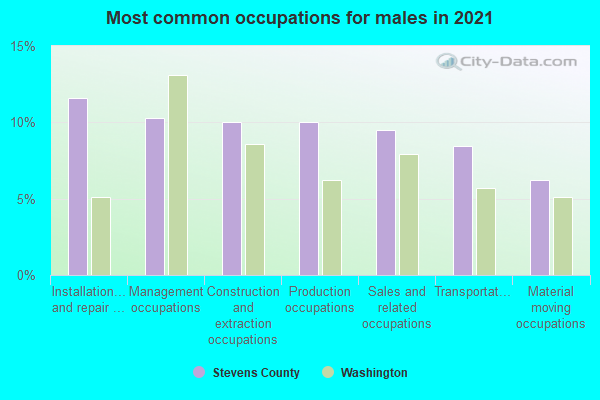
- Installation, maintenance, and repair occupations (11%)
- Production occupations (10%)
- Construction and extraction occupations (10%)
- Management occupations (10%)
- Sales and related occupations (9%)
- Transportation occupations (7%)
- Material moving occupations (5%)
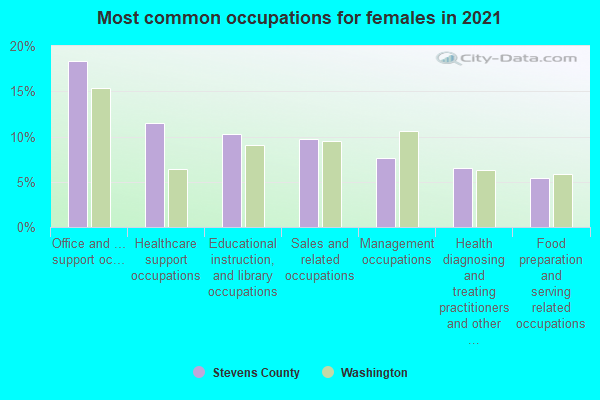
- Office and administrative support occupations (17%)
- Healthcare support occupations (11%)
- Sales and related occupations (10%)
- Educational instruction, and library occupations (9%)
- Management occupations (9%)
- Food preparation and serving related occupations (7%)
- Health diagnosing and treating practitioners and other technical occupations (6%)
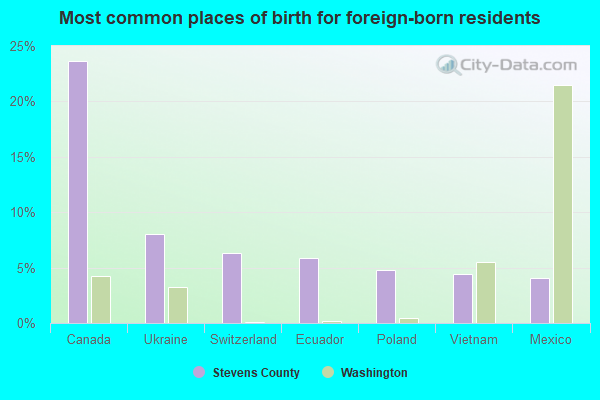
- Canada (19%)
- Ukraine (9%)
- Poland (7%)
- Mexico (5%)
- Switzerland (5%)
- Japan (4%)
- Vietnam (4%)
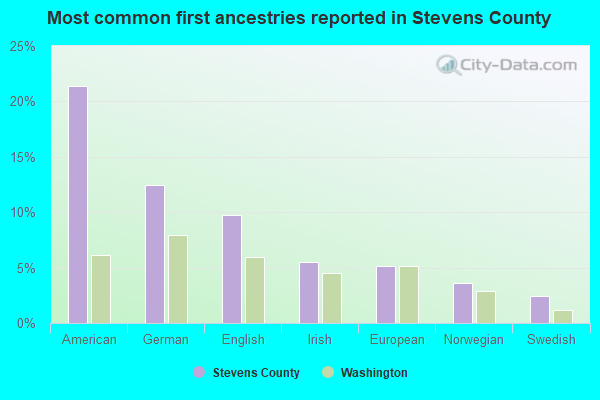
- American (24%)
- German (13%)
- English (10%)
- European (6%)
- Irish (5%)
- Norwegian (4%)
- Ukrainian (2%)
People in group quarters in Stevens County, Washington in 2010:
- 140 people in nursing facilities/skilled-nursing facilities
- 62 people in group homes intended for adults
- 37 people in local jails and other municipal confinement facilities
- 21 people in other noninstitutional facilities
- 6 people in workers' group living quarters and job corps centers
People in group quarters in Stevens County, Washington in 2000:
- 204 people in nursing homes
- 69 people in other noninstitutional group quarters
- 44 people in other group homes
- 38 people in local jails and other confinement facilities (including police lockups)
- 4 people in other nonhousehold living situations
- 3 people in hospitals/wards and hospices for chronically ill
- 3 people in other hospitals or wards for chronically ill
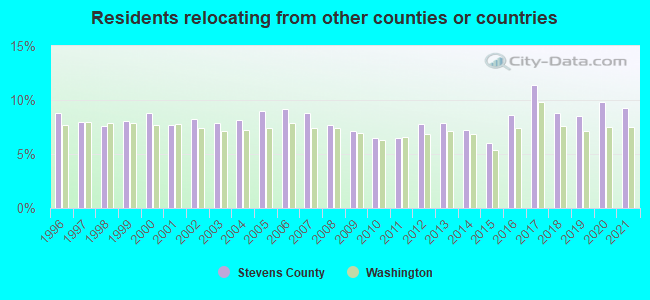
9.24% of this county's 2021 resident taxpayers lived in other counties in 2020 ($64,378 average adjusted gross income)
| Here: | 9.24% |
| Washington average: | 7.53% |
10 or fewer of this county's residents moved from foreign countries.
6.13% relocated from other counties in Washington ($41,835 average AGI)
3.10% relocated from other states ($22,543 average AGI)
Stevens County: 3.10% Washington average: 3.85%
Top counties from which taxpayers relocated into this county between 2020 and 2021:
| from Spokane County, WA | |
| from King County, WA | |
| from Snohomish County, WA | |
| from Pierce County, WA | |
| from Kootenai County, ID | |
| from Ferry County, WA | |
| from Pend Oreille County, WA |
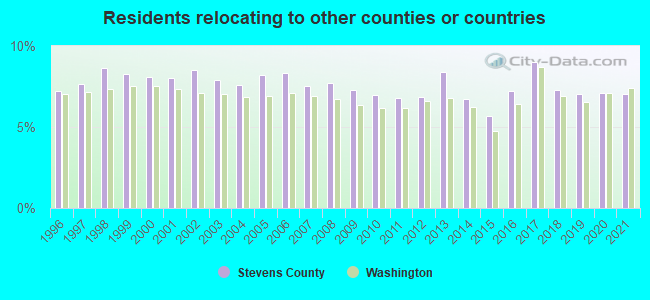
7.01% of this county's 2020 resident taxpayers moved to other counties in 2021 ($50,375 average adjusted gross income)
| Here: | 7.01% |
| Washington average: | 7.40% |
10 or fewer of this county's residents moved to foreign countries.
4.28% relocated to other counties in Washington ($30,166 average AGI)
2.73% relocated to other states ($20,209 average AGI)
Stevens County: 2.73% Washington average: 3.73%
Top counties to which taxpayers relocated from this county between 2020 and 2021:
| to Spokane County, WA | |
| to Kootenai County, ID | |
| to Ferry County, WA | |
| to King County, WA | |
| to Pend Oreille County, WA | |
| to Maricopa County, AZ |
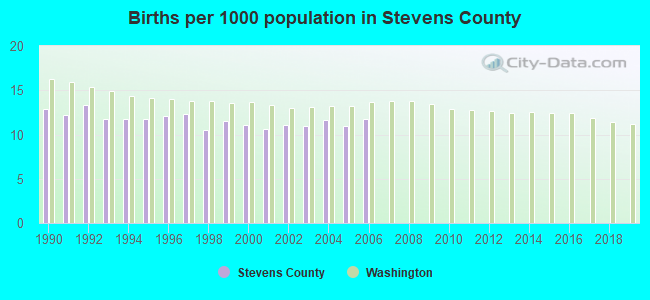
Births per 1000 population from 1990 to 1999: 12.0
Births per 1000 population from 2000 to 2006: 11.2
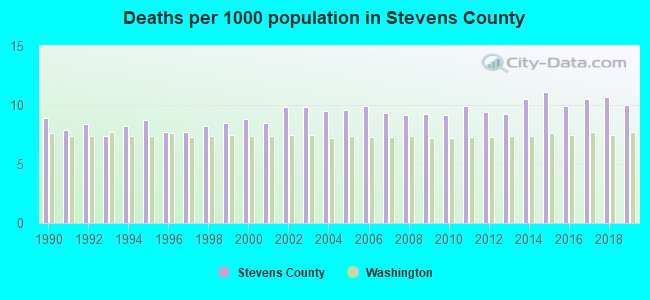
Deaths per 1000 population from 1990 to 1999: 8.2
Deaths per 1000 population from 2000 to 2009: 9.4
Deaths per 1000 population from 2010 to 2020: 10.2
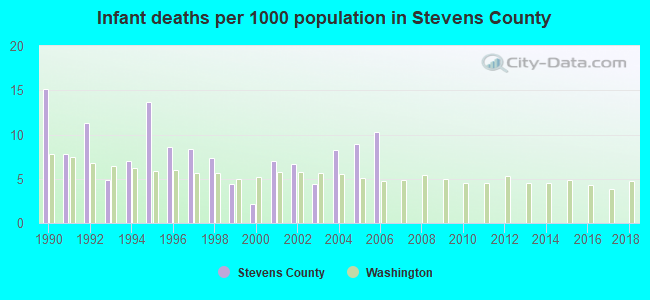
Infant deaths per 1000 live births from 1990 to 1999: 8.8
Infant deaths per 1000 live births from 2000 to 2006: 6.8
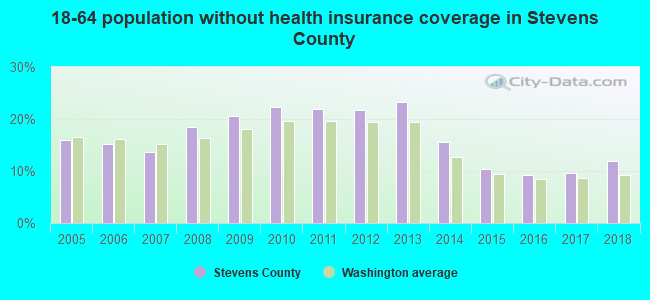
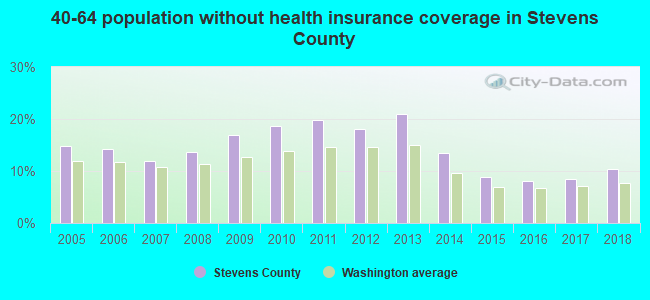
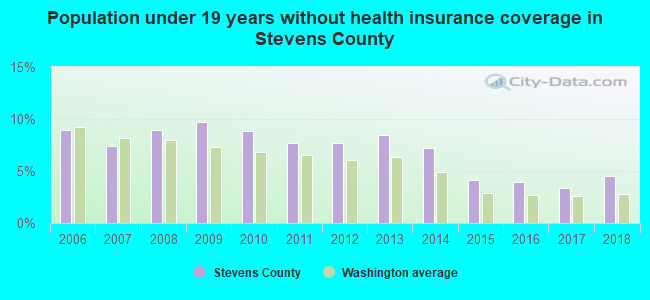
Persons under 19 years old without health insurance coverage in 2018: 4.5%

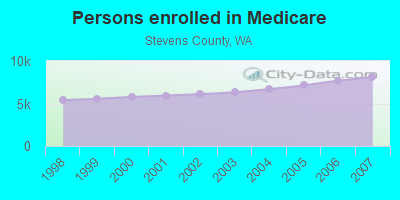
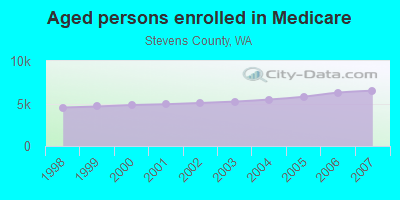
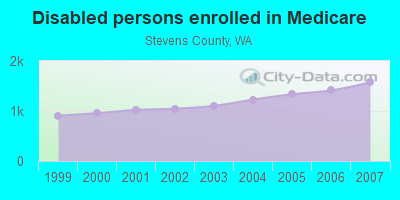
Persons enrolled in hospital insurance and/or supplemental medical insurance (Medicare) in July 1, 2007: 8,082 (6,508 aged, 1,574 disabled)
Children under 18 without health insurance coverage in 2007: 1,056 (11%)
Most common underlying causes of death in Stevens County, Washington in 1999 - 2019:
- Atherosclerotic heart disease (583)
- Bronchus or lung, unspecified - Malignant neoplasms (512)
- Atherosclerotic cardiovascular disease, so described (501)
- Chronic obstructive pulmonary disease, unspecified (460)
- Acute myocardial infarction, unspecified (445)
- Alzheimer disease, unspecified (271)
- Stroke, not specified as haemorrhage or infarction (213)
- Breast, unspecified - Malignant neoplasms (56)
- Malignant neoplasm of prostate (35)
- Unspecified dementia (35)
Population without health insurance coverage in 2000: 17%
Children under 18 without health insurance coverage in 2000: 15%
Short term general hospital admissions per 100,000 population in 2004: 4,430
Short term general hospital beds per 100,000 population in 2004: 283
Emergency room visits per 100,000 population in 2004: 23,106
General practice office based MDs per 100,000 population in 2005: 1,104
Medical specialist MDs per 100,000 population in 2005: 947
Dentists per 100,000 population in 1998: 7
Total births per 100,000 population, July 2005 - July 2006 : 25
Total deaths per 100,000 population, July 2005 - July 2006: 71
Limited-service eating places per 100,000 population in 2005 : 12
EPA green book nonattainment status in 2004-2006: 1
Suicides per 1,000,000 population from 2000 to 2006: 180.3. This is more than state average.
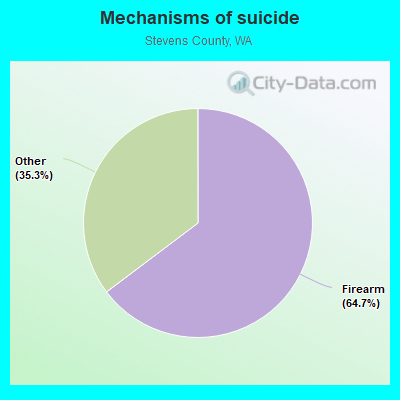
- Firearm - 116.7
- Other - 63.6
Household type by relationship:
Households: 47,365- Male householders: 9,940 (2,756 living alone), Female householders: 9,144 (2,450 living alone)
10,485 spouses (10,454 opposite-sex spouses), 1,248 unmarried partners, (1,233 opposite-sex unmarried partners), 11,334 children (9,984 natural, 536 adopted, 809 stepchildren), 1,645 grandchildren, 291 brothers or sisters, 557 parents, 53 foster children, 894 other relatives, 1,338 non-relatives
- In group quarters: 312
Size of family households: 7,258 2-persons, 2,170 3-persons, 1,615 4-persons, 988 5-persons, 447 6-persons, 423 7-or-more-persons.
Size of nonfamily households: 5,206 1-person, 895 2-persons, 74 3-persons, 8 4-persons, 29 7-or-more-persons.
6,297 married couples with children.
1,726 single-parent households (667 men, 1,059 women).
95.9% of residents of Stevens speak English at home.
1.6% of residents speak Spanish at home (74% speak English very well, 12% speak English well, 13% speak English not well, 1% don't speak English at all).
1.6% of residents speak other Indo-European language at home (50% speak English very well, 2% speak English well, 21% speak English not well, 27% don't speak English at all).
0.4% of residents speak Asian or Pacific Island language at home (30% speak English very well, 65% speak English well, 6% speak English not well).
0.3% of residents speak other language at home (100% speak English very well).
In fiscal year 2004:
Federal Government expenditure: $215,958,000 ($5,228 per capita)
Department of Defense expenditure: $8,831,000
Federal direct payments to individuals for retirement and disability: $113,679,000
Federal other direct payments to individuals: $35,089,000
Federal direct payments not to individuals: $3,505,000
Federal grants: $40,958,000
Federal procurement contracts: $3,716,000 ($237,000 Department of Defense)
Federal salaries and wages: $19,012,000 ($0,000 Department of Defense)
Federal Government direct loans: $2,849,000
Federal guaranteed/insured loans: $18,793,000
Federal Government insurance: $7,304,000
Population change from April 1, 2000 to July 1, 2005:
Births: 2,366| Here: | 56 per 1000 residents |
| State: | 66 per 1000 residents |
Deaths: 2,024
| Here: | 48 per 1000 residents |
| State: | 38 per 1000 residents |
Net international migration: +76
| Here: | +2 per 1000 residents |
| State: | +21 per 1000 residents |
Net internal migration: +1,596
| Here: | +38 per 1000 residents |
| State: | +13 per 1000 residents |
Total withdrawal of fresh water for public supply: 4.89 millions of gallons per day (all from ground)
| Here: | 6.1 |
| State: | 6.5 |
| Here: | 4.4 |
| State: | 3.9 |
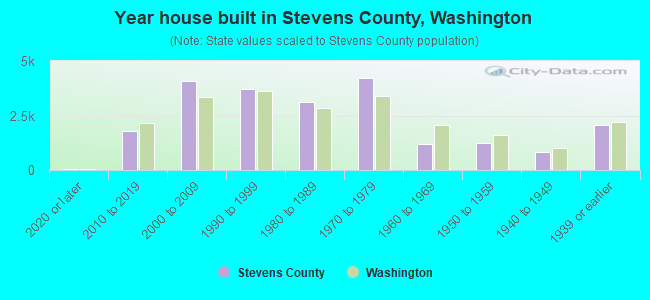
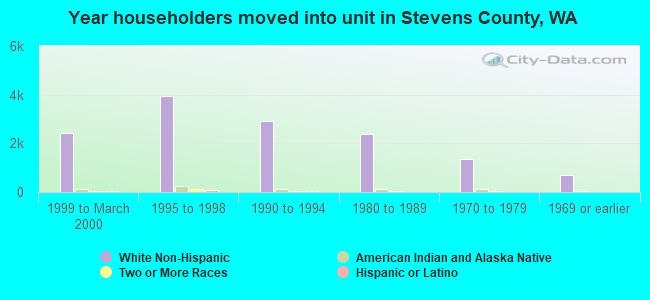
- Year house built in Stevens County, Washington
- 1752020 or later
- 1,9492010 to 2019
- 3,7462000 to 2009
- 3,9091990 to 1999
- 3,0191980 to 1989
- 4,3031970 to 1979
- 1,2221960 to 1969
- 1,3301950 to 1959
- 7061940 to 1949
- 2,0991939 or earlier
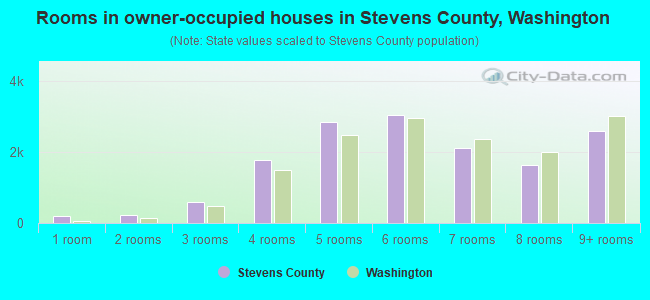
- Rooms in owner-occupied houses in Stevens County, Washington
- 2531 room
- 2502 rooms
- 5853 rooms
- 2,0584 rooms
- 2,6155 rooms
- 3,1676 rooms
- 2,0957 rooms
- 1,6818 rooms
- 2,6639+ rooms
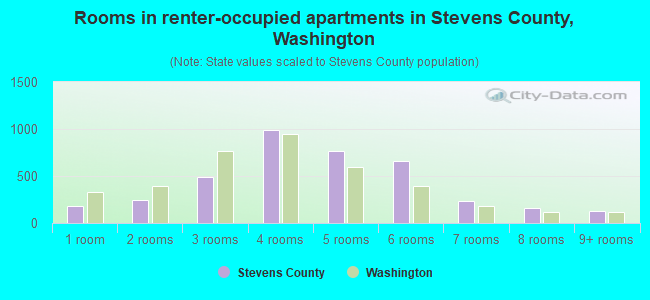
- Rooms in renter-occupied apartments in Stevens County, Washington
- 2011 room
- 2472 rooms
- 5053 rooms
- 1,0414 rooms
- 6655 rooms
- 5736 rooms
- 2087 rooms
- 1438 rooms
- 1959+ rooms
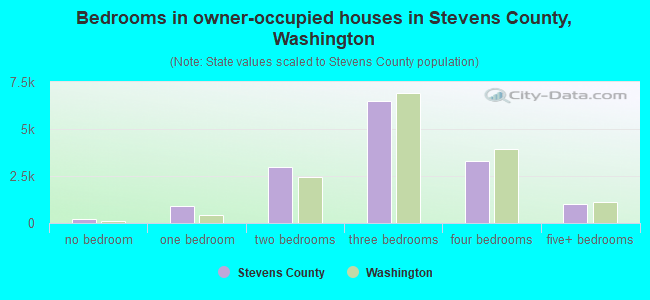
- Bedrooms in owner-occupied houses in Stevens County, Washington
- 290no bedroom
- 8741 bedroom
- 3,0072 bedrooms
- 6,8353 bedrooms
- 3,1384 bedrooms
- 1,2085+ bedrooms
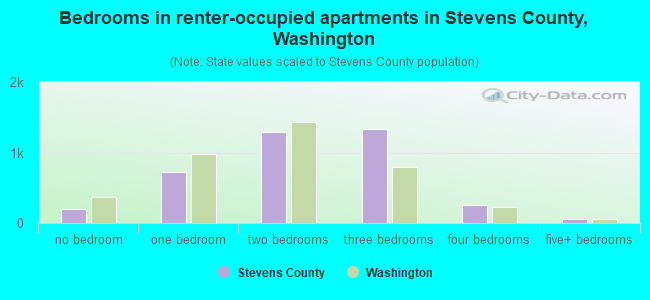
- Bedrooms in renter-occupied apartments in Stevens County, Washington
- 220no bedroom
- 6731 bedroom
- 1,2702 bedrooms
- 1,2683 bedrooms
- 2714 bedrooms
- 785+ bedrooms
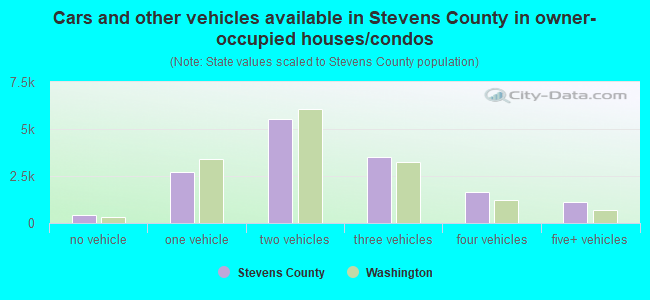
- Cars and other vehicles available in Stevens County in owner-occupied houses/condos
- 355no vehicle
- 2,8281 vehicle
- 5,5382 vehicles
- 3,7203 vehicles
- 1,5294 vehicles
- 1,2705+ vehicles
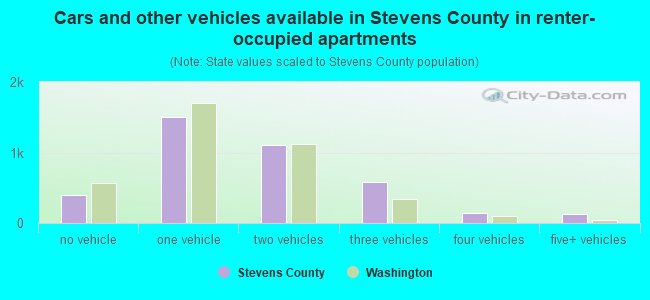
- Cars and other vehicles available in Stevens County in renter-occupied apartments
- 370no vehicle
- 1,5431 vehicle
- 1,0902 vehicles
- 5083 vehicles
- 1854 vehicles
- 975+ vehicles
91.4% of Stevens County residents lived in the same house 1 years ago.
Out of people who lived in different houses, 32% lived in this county.
Out of people who lived in different counties, 61% lived in Washington.
| Stevens County: | 91.4% |
| State average: | 85.2% |
Place of birth for U.S.-born residents:
- This state: 27,380
- Other state: 18,284
- Northeast: 1,073
- Midwest: 3,380
- South: 2,040
- West: 11,795
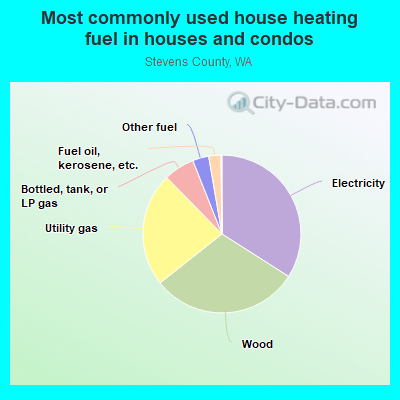
- 34.8%Electricity
- 31.1%Wood
- 22.7%Utility gas
- 5.7%Bottled, tank, or LP gas
- 3.3%Other fuel
- 2.1%Fuel oil, kerosene, etc.
- 0.2%Solar energy
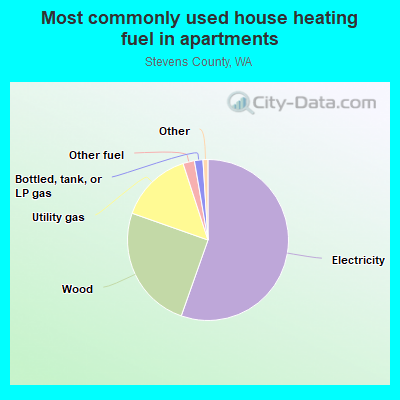
- 51.6%Electricity
- 26.8%Wood
- 15.8%Utility gas
- 2.9%Other fuel
- 1.6%Bottled, tank, or LP gas
- 0.9%Fuel oil, kerosene, etc.
- 0.3%Coal or coke
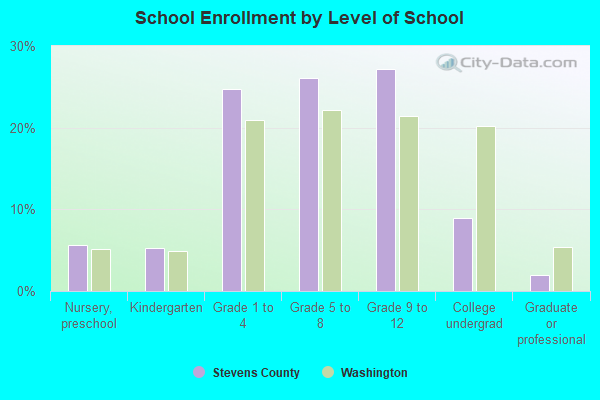
Private vs. public school enrollment:
| Here: | 17.5% |
| Washington: | 12.4% |
| Here: | 8.4% |
| Washington: | 9.2% |
| Here: | 19.4% |
| Washington: | 16.5% |
Stevens County government finances - Expenditure in 2018:
- Charges - Other: $11,175,000
Solid Waste Management: $2,512,000
Regular Highways: $132,000
Natural Resources - Other: $90,000
Parks and Recreation: $68,000
- Construction - Regular Highways: $1,013,000
Central Staff Services: $224,000
Natural Resources - Other: $101,000
- Current Operations - Health - Other: $11,208,000
Regular Highways: $8,536,000
Police Protection: $4,327,000
Judicial and Legal Services: $3,876,000
General - Other: $2,477,000
Financial Administration: $2,404,000
Correctional Institutions: $1,877,000
Solid Waste Management: $1,447,000
Central Staff Services: $1,012,000
General Public Buildings: $513,000
Housing and Community Development: $356,000
Natural Resources - Other: $346,000
Parks and Recreation: $209,000
Libraries: $4,000
- Federal Intergovernmental - General Local Government Support: $710,000
Other: $15,000
Natural Resources: $10,000
- General - Interest on Debt: $1,484,000
- Intergovernmental to Local - Other - Correctional Institutions: $548,000
Other - Public Welfare - Other: $196,000
Other - Natural Resources - Other: $137,000
Other - Central Staff Services: $83,000
Other - Solid Waste Management: $38,000
Other - General - Other: $30,000
Other - Parks and Recreation: $22,000
Other - Financial Administration: $9,000
Other - Regular Highways: $6,000
- Local Intergovernmental - Other: $1,171,000
- Long Term Debt - Beginning Outstanding - Unspecified Public Purpose: $37,095,000
Outstanding Unspecified Public Purpose: $33,067,000
Retired Unspecified Public Purpose: $4,163,000
Issue, Unspecified Public Purpose: $135,000
- Miscellaneous - Fines and Forfeits: $440,000
General Revenue - Other: $312,000
Special Assessments: $270,000
Rents: $161,000
Donations From Private Sources: $41,000
Interest Earnings: $0
- Other Capital Outlay - Solid Waste Management: $309,000
General - Other: $255,000
Health - Other: $114,000
Local Fire Protection: $20,000
Police Protection: $19,000
Natural Resources - Other: $15,000
Regular Highways: $9,000
Central Staff Services: $3,000
- Other Funds - Cash and Securities: $336,000
- State Intergovernmental - Highways: $4,651,000
Other: $4,631,000
Health and Hospitals: $848,000
General Local Government Support: $213,000
Housing and Community Development: $92,000
- Tax - Property: $11,755,000
General Sales and Gross Receipts: $3,748,000
Documentary and Stock Transfer: $434,000
Other License: $416,000
Public Utilities Sales: $408,000
Motor Vehicle License: $269,000
Other Selective Sales: $42,000
Severance: $7,000
Other: $3,000
- Total Salaries and Wages: $17,795,000
Stevens County government finances - Revenue in 2018:
- Charges - Other: $11,175,000
Solid Waste Management: $2,512,000
Regular Highways: $132,000
Natural Resources - Other: $90,000
Parks and Recreation: $68,000
- Construction - Regular Highways: $1,013,000
Central Staff Services: $224,000
Natural Resources - Other: $101,000
- Current Operations - Health - Other: $11,208,000
Regular Highways: $8,536,000
Police Protection: $4,327,000
Judicial and Legal Services: $3,876,000
General - Other: $2,477,000
Financial Administration: $2,404,000
Correctional Institutions: $1,877,000
Solid Waste Management: $1,447,000
Central Staff Services: $1,012,000
General Public Buildings: $513,000
Housing and Community Development: $356,000
Natural Resources - Other: $346,000
Parks and Recreation: $209,000
Libraries: $4,000
- Federal Intergovernmental - General Local Government Support: $710,000
Other: $15,000
Natural Resources: $10,000
- General - Interest on Debt: $1,484,000
- Intergovernmental to Local - Other - Correctional Institutions: $548,000
Other - Public Welfare - Other: $196,000
Other - Natural Resources - Other: $137,000
Other - Central Staff Services: $83,000
Other - Solid Waste Management: $38,000
Other - General - Other: $30,000
Other - Parks and Recreation: $22,000
Other - Financial Administration: $9,000
Other - Regular Highways: $6,000
- Local Intergovernmental - Other: $1,171,000
- Long Term Debt - Beginning Outstanding - Unspecified Public Purpose: $37,095,000
Outstanding Unspecified Public Purpose: $33,067,000
Retired Unspecified Public Purpose: $4,163,000
Issue, Unspecified Public Purpose: $135,000
- Miscellaneous - Fines and Forfeits: $440,000
General Revenue - Other: $312,000
Special Assessments: $270,000
Rents: $161,000
Donations From Private Sources: $41,000
Interest Earnings: $0
- Other Capital Outlay - Solid Waste Management: $309,000
General - Other: $255,000
Health - Other: $114,000
Local Fire Protection: $20,000
Police Protection: $19,000
Natural Resources - Other: $15,000
Regular Highways: $9,000
Central Staff Services: $3,000
- Other Funds - Cash and Securities: $336,000
- State Intergovernmental - Highways: $4,651,000
Other: $4,631,000
Health and Hospitals: $848,000
General Local Government Support: $213,000
Housing and Community Development: $92,000
- Tax - Property: $11,755,000
General Sales and Gross Receipts: $3,748,000
Documentary and Stock Transfer: $434,000
Other License: $416,000
Public Utilities Sales: $408,000
Motor Vehicle License: $269,000
Other Selective Sales: $42,000
Severance: $7,000
Other: $3,000
- Total Salaries and Wages: $17,795,000
Stevens County government finances - Debt in 2018:
- Charges - Other: $11,175,000
Solid Waste Management: $2,512,000
Regular Highways: $132,000
Natural Resources - Other: $90,000
Parks and Recreation: $68,000
- Construction - Regular Highways: $1,013,000
Central Staff Services: $224,000
Natural Resources - Other: $101,000
- Current Operations - Health - Other: $11,208,000
Regular Highways: $8,536,000
Police Protection: $4,327,000
Judicial and Legal Services: $3,876,000
General - Other: $2,477,000
Financial Administration: $2,404,000
Correctional Institutions: $1,877,000
Solid Waste Management: $1,447,000
Central Staff Services: $1,012,000
General Public Buildings: $513,000
Housing and Community Development: $356,000
Natural Resources - Other: $346,000
Parks and Recreation: $209,000
Libraries: $4,000
- Federal Intergovernmental - General Local Government Support: $710,000
Other: $15,000
Natural Resources: $10,000
- General - Interest on Debt: $1,484,000
- Intergovernmental to Local - Other - Correctional Institutions: $548,000
Other - Public Welfare - Other: $196,000
Other - Natural Resources - Other: $137,000
Other - Central Staff Services: $83,000
Other - Solid Waste Management: $38,000
Other - General - Other: $30,000
Other - Parks and Recreation: $22,000
Other - Financial Administration: $9,000
Other - Regular Highways: $6,000
- Local Intergovernmental - Other: $1,171,000
- Long Term Debt - Beginning Outstanding - Unspecified Public Purpose: $37,095,000
Outstanding Unspecified Public Purpose: $33,067,000
Retired Unspecified Public Purpose: $4,163,000
Issue, Unspecified Public Purpose: $135,000
- Miscellaneous - Fines and Forfeits: $440,000
General Revenue - Other: $312,000
Special Assessments: $270,000
Rents: $161,000
Donations From Private Sources: $41,000
Interest Earnings: $0
- Other Capital Outlay - Solid Waste Management: $309,000
General - Other: $255,000
Health - Other: $114,000
Local Fire Protection: $20,000
Police Protection: $19,000
Natural Resources - Other: $15,000
Regular Highways: $9,000
Central Staff Services: $3,000
- Other Funds - Cash and Securities: $336,000
- State Intergovernmental - Highways: $4,651,000
Other: $4,631,000
Health and Hospitals: $848,000
General Local Government Support: $213,000
Housing and Community Development: $92,000
- Tax - Property: $11,755,000
General Sales and Gross Receipts: $3,748,000
Documentary and Stock Transfer: $434,000
Other License: $416,000
Public Utilities Sales: $408,000
Motor Vehicle License: $269,000
Other Selective Sales: $42,000
Severance: $7,000
Other: $3,000
- Total Salaries and Wages: $17,795,000
Stevens County government finances - Cash and Securities in 2018:
- Charges - Other: $11,175,000
Solid Waste Management: $2,512,000
Regular Highways: $132,000
Natural Resources - Other: $90,000
Parks and Recreation: $68,000
- Construction - Regular Highways: $1,013,000
Central Staff Services: $224,000
Natural Resources - Other: $101,000
- Current Operations - Health - Other: $11,208,000
Regular Highways: $8,536,000
Police Protection: $4,327,000
Judicial and Legal Services: $3,876,000
General - Other: $2,477,000
Financial Administration: $2,404,000
Correctional Institutions: $1,877,000
Solid Waste Management: $1,447,000
Central Staff Services: $1,012,000
General Public Buildings: $513,000
Housing and Community Development: $356,000
Natural Resources - Other: $346,000
Parks and Recreation: $209,000
Libraries: $4,000
- Federal Intergovernmental - General Local Government Support: $710,000
Other: $15,000
Natural Resources: $10,000
- General - Interest on Debt: $1,484,000
- Intergovernmental to Local - Other - Correctional Institutions: $548,000
Other - Public Welfare - Other: $196,000
Other - Natural Resources - Other: $137,000
Other - Central Staff Services: $83,000
Other - Solid Waste Management: $38,000
Other - General - Other: $30,000
Other - Parks and Recreation: $22,000
Other - Financial Administration: $9,000
Other - Regular Highways: $6,000
- Local Intergovernmental - Other: $1,171,000
- Long Term Debt - Beginning Outstanding - Unspecified Public Purpose: $37,095,000
Outstanding Unspecified Public Purpose: $33,067,000
Retired Unspecified Public Purpose: $4,163,000
Issue, Unspecified Public Purpose: $135,000
- Miscellaneous - Fines and Forfeits: $440,000
General Revenue - Other: $312,000
Special Assessments: $270,000
Rents: $161,000
Donations From Private Sources: $41,000
Interest Earnings: $0
- Other Capital Outlay - Solid Waste Management: $309,000
General - Other: $255,000
Health - Other: $114,000
Local Fire Protection: $20,000
Police Protection: $19,000
Natural Resources - Other: $15,000
Regular Highways: $9,000
Central Staff Services: $3,000
- Other Funds - Cash and Securities: $336,000
- State Intergovernmental - Highways: $4,651,000
Other: $4,631,000
Health and Hospitals: $848,000
General Local Government Support: $213,000
Housing and Community Development: $92,000
- Tax - Property: $11,755,000
General Sales and Gross Receipts: $3,748,000
Documentary and Stock Transfer: $434,000
Other License: $416,000
Public Utilities Sales: $408,000
Motor Vehicle License: $269,000
Other Selective Sales: $42,000
Severance: $7,000
Other: $3,000
- Total Salaries and Wages: $17,795,000
Supplemental Security Income (SSI) in 2006:
- Total number of recipients: 1,115
- Number of aged recipients: 56
- Number of blind and disabled recipients: 1,059
- Number of recipients under 18: 128
- Number of recipients between 18 and 64: 841
- Number of recipients older than 64: 146
- Number of recipients also receiving OASDI: 351
- Amount of payments (thousands of dollars): 573
| Most common first names in Stevens County, WA among deceased individuals | ||
| Name | Count | Lived (average) |
|---|---|---|
| Robert | 147 | 74.3 years |
| John | 140 | 74.3 years |
| William | 136 | 78.8 years |
| Mary | 108 | 81.1 years |
| James | 94 | 75.0 years |
| Charles | 84 | 76.1 years |
| George | 77 | 76.1 years |
| Frank | 66 | 79.6 years |
| Margaret | 55 | 79.2 years |
| Richard | 50 | 67.3 years |
| Most common last names in Stevens County, WA among deceased individuals | ||
| Last name | Count | Lived (average) |
|---|---|---|
| Johnson | 59 | 75.4 years |
| Smith | 41 | 76.3 years |
| Miller | 40 | 73.7 years |
| Anderson | 38 | 75.1 years |
| Brown | 31 | 72.9 years |
| Thompson | 30 | 77.0 years |
| Peterson | 30 | 78.3 years |
| Clark | 26 | 72.7 years |
| Wilson | 25 | 79.8 years |
| Jones | 23 | 75.9 years |
| Businesses in Stevens County, WA | ||||
| Name | Count | Name | Count | |
|---|---|---|---|---|
| AT&T | 1 | McDonald's | 2 | |
| Ace Hardware | 3 | Payless | 1 | |
| Arby's | 1 | RadioShack | 2 | |
| Chevrolet | 1 | Sears | 1 | |
| Comfort Inn | 1 | Starbucks | 1 | |
| Curves | 1 | T-Mobile | 1 | |
| FedEx | 3 | Taco Bell | 1 | |
| Goodwill | 1 | The Room Place | 1 | |
| H&R Block | 1 | Toyota | 1 | |
| KFC | 1 | U-Haul | 3 | |
| La-Z-Boy | 1 | UPS | 5 | |
| Lane Furniture | 1 | Vons | 2 | |
| MasterBrand Cabinets | 2 | Walmart | 1 | |
Stevens County on our top lists:
- #88 on the list of "Top 101 counties with the highest Particulate Matter (PM10) Annual air pollution readings in 2012 (µg/m3)"