Crime rate in Bakersfield, California (CA): murders, rapes, robberies, assaults, burglaries, thefts, auto thefts, arson, law enforcement employees, police officers, crime map
Crime rate in Bakersfield, CA
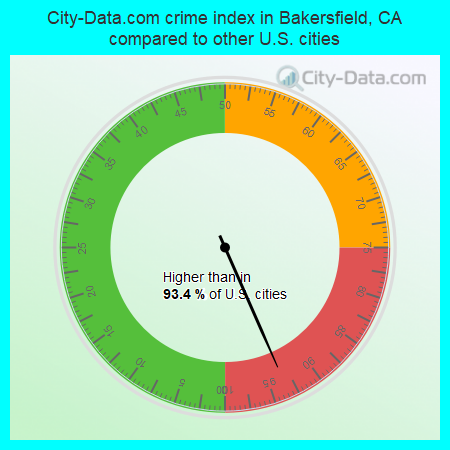
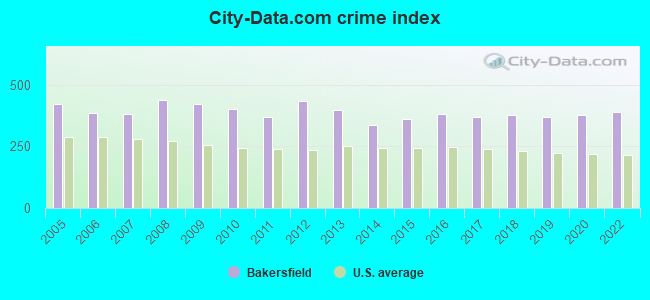
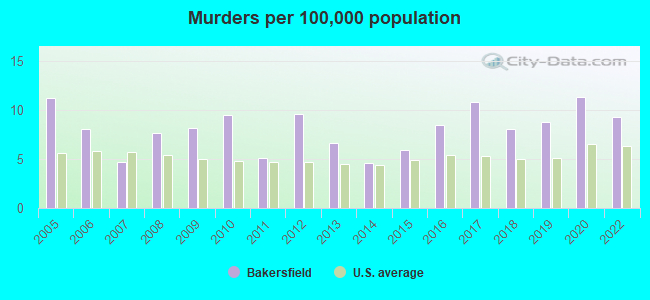
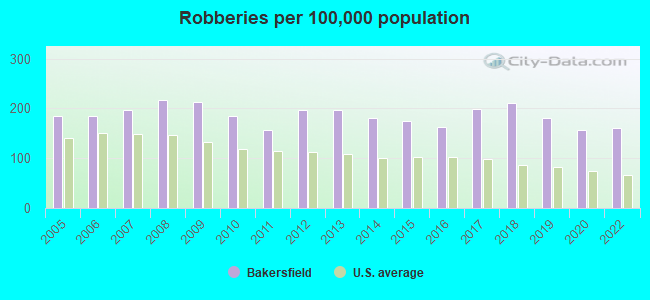
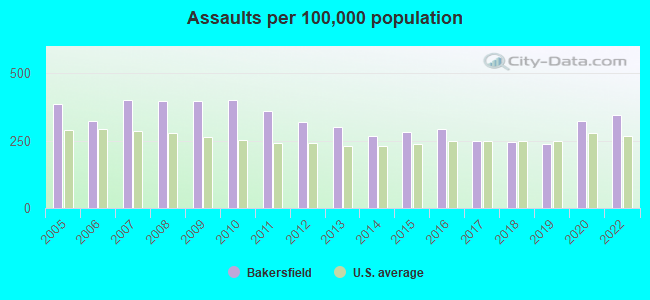
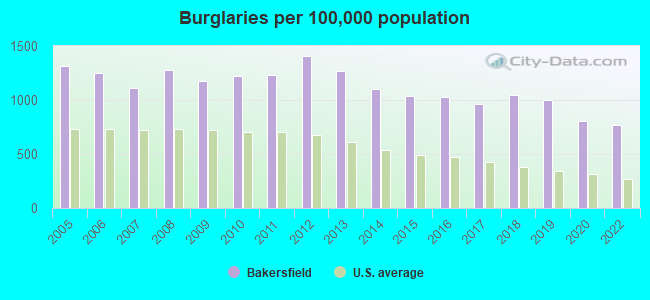
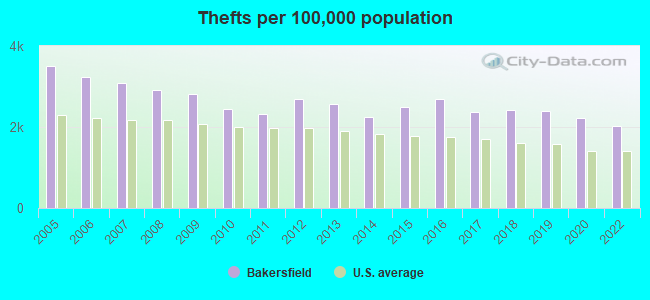
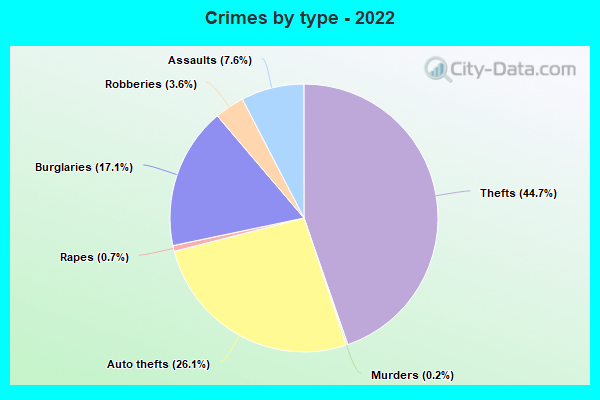
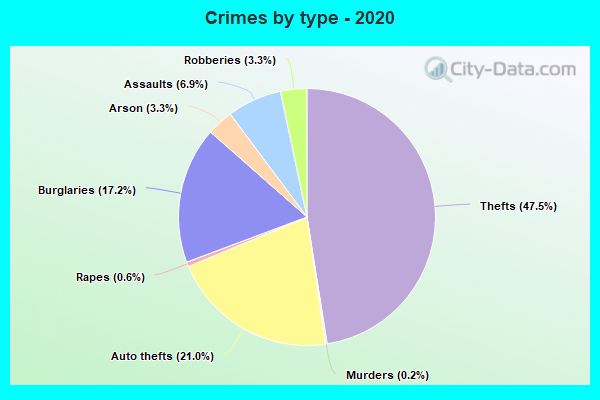
The 2022 crime rate in Bakersfield, CA is 390 (City-Data.com crime index), which is 1.6 times higher than the U.S. average. It was higher than in 93.4% U.S. cities. The 2022 Bakersfield crime rate rose by 3% compared to 2020. The number of homicides stood at 38 - a decrease of 6 compared to 2020. In the last 5 years Bakersfield has seen rise of violent crime and decreasing property crime.See how dangerous Bakersfield, CA is compared to the nearest cities:
(Note: Higher means more crime)
(Note: Higher means more crime)
| Bakersfield: | 390.0 |
| Arvin: | 170.3 |
| Shafter: | 228.0 |
| McFarland: | 261.7 |
| Taft: | 336.6 |
| Stallion Springs: | 47.1 |
| Delano: | 227.2 |
| Tehachapi: | 245.4 |
| Porterville: | 263.3 |
The City-Data.com crime index weighs serious crimes and violent crimes more heavily. Higher means more crime, U.S. average is 246.1. It adjusts for the number of visitors and daily workers commuting into cities.
- means the value is smaller than the state average.- means the value is about the same as the state average.
- means the value is bigger than the state average.
- means the value is much bigger than the state average.
According to our research of California and other state lists, there were 1,107 registered sex offenders living in Bakersfield, California as of April 26, 2024.
The ratio of all residents to sex offenders in Bakersfield is 340 to 1.
Violent crime rate in 2022
| Bakersfield: | 302.6 |
| U.S. Average: | 219.8 |
Violent crime rate in 2020
| Bakersfield: | 289.1 |
| U.S. Average: | 228.2 |
Violent crime rate in 2019
| Bakersfield: | 255.6 |
| U.S. Average: | 219.9 |
Violent crime rate in 2018
| Bakersfield: | 272.4 |
| U.S. Average: | 221.2 |
Violent crime rate in 2017
| Bakersfield: | 267.9 |
| U.S. Average: | 226.2 |
Violent crime rate in 2016
| Bakersfield: | 261.9 |
| U.S. Average: | 227.3 |
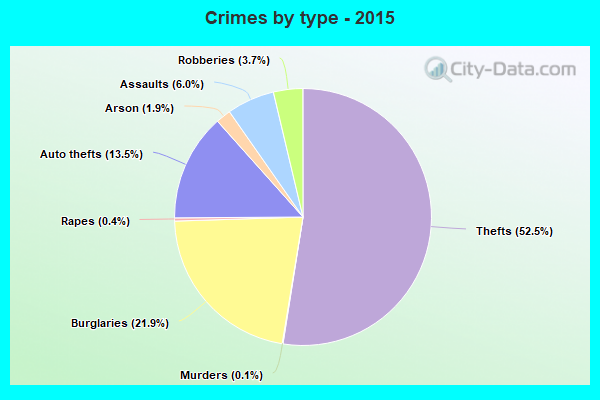
Violent crime rate in 2015
| Bakersfield: | 260.4 |
| U.S. Average: | 219.3 |
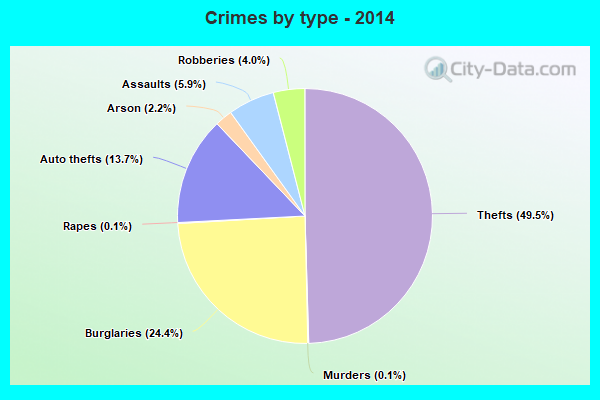
Violent crime rate in 2014
| Bakersfield: | 238.2 |
| U.S. Average: | 211.1 |
Violent crime rate in 2013
| Bakersfield: | 272.5 |
| U.S. Average: | 214.2 |
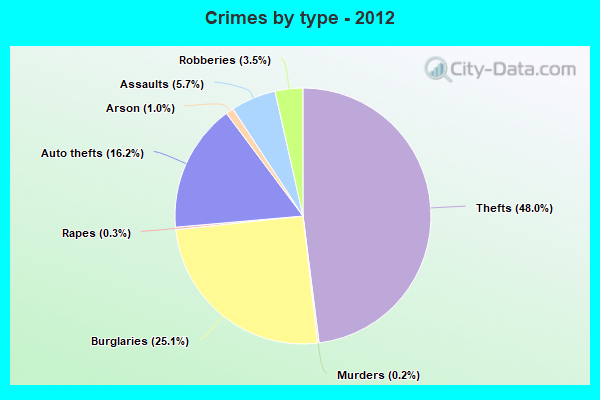
Violent crime rate in 2012
| Bakersfield: | 293.5 |
| U.S. Average: | 187.4 |
Violent crime rate in 2011
| Bakersfield: | 278.6 |
| U.S. Average: | 187.1 |
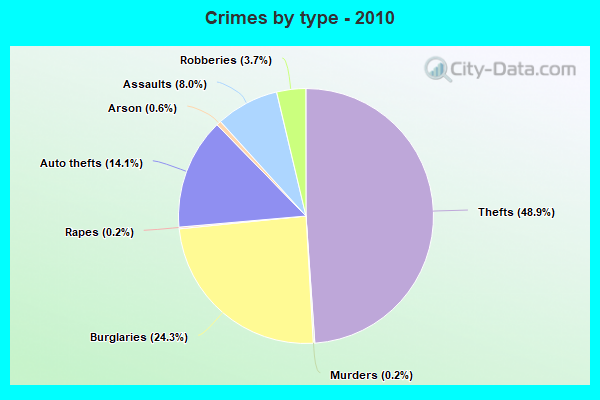
Violent crime rate in 2010
| Bakersfield: | 321.9 |
| U.S. Average: | 195.7 |
Violent crime rate in 2009
| Bakersfield: | 336.8 |
| U.S. Average: | 208.9 |
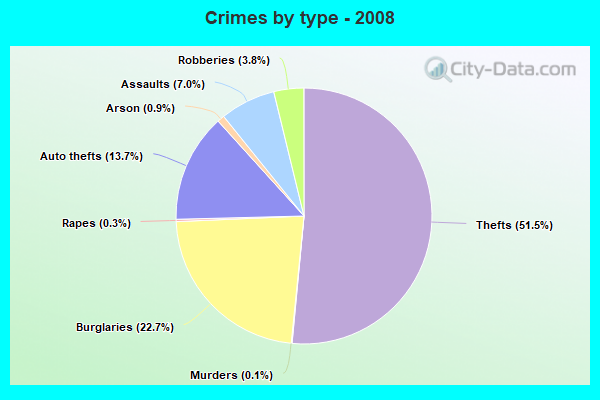
Violent crime rate in 2008
| Bakersfield: | 337.4 |
| U.S. Average: | 222.5 |
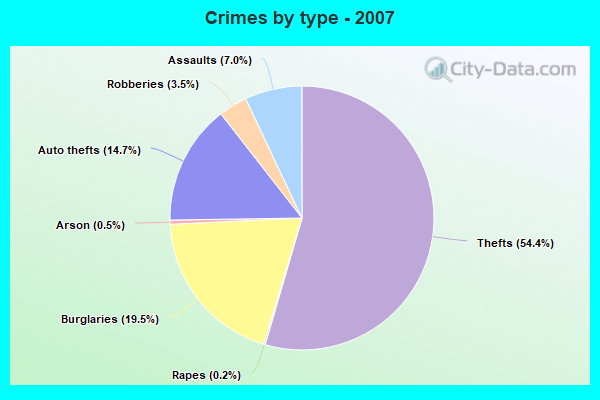
Violent crime rate in 2007
| Bakersfield: | 287.3 |
| U.S. Average: | 229.1 |
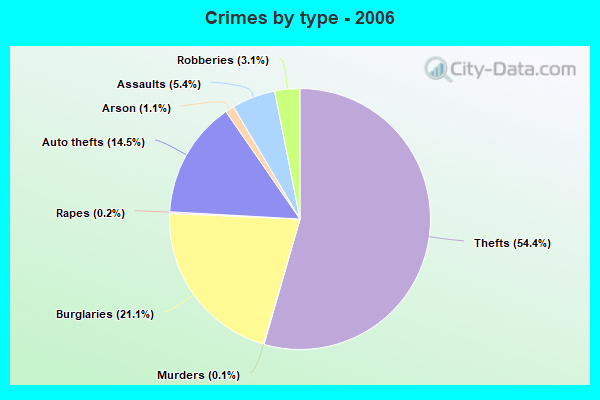
Violent crime rate in 2006
| Bakersfield: | 253.5 |
| U.S. Average: | 232.6 |
Violent crime rate in 2005
| Bakersfield: | 289.0 |
| U.S. Average: | 227.0 |
Property crime rate in 2022
| Bakersfield: | 432.5 |
| U.S. Average: | 166.5 |
Property crime rate in 2020
| Bakersfield: | 420.8 |
| U.S. Average: | 169.6 |
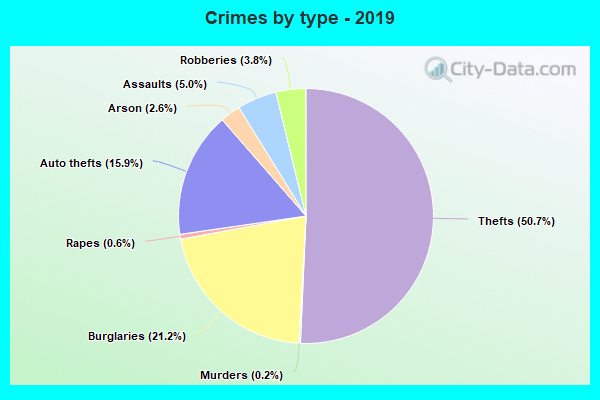
Property crime rate in 2019
| Bakersfield: | 432.3 |
| U.S. Average: | 179.7 |
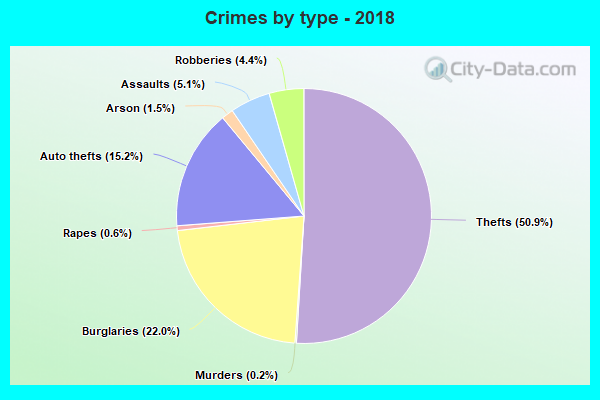
Property crime rate in 2018
| Bakersfield: | 437.3 |
| U.S. Average: | 190.2 |
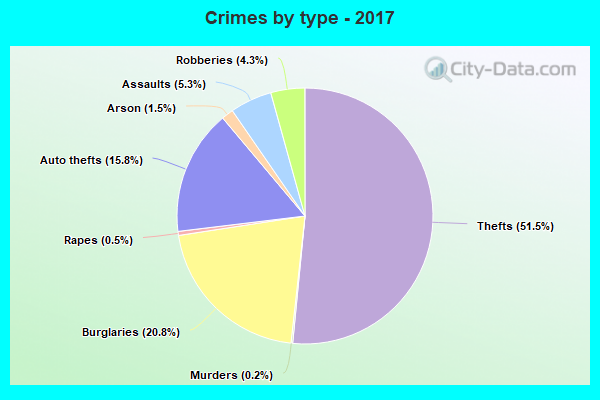
Property crime rate in 2017
| Bakersfield: | 420.6 |
| U.S. Average: | 206.4 |
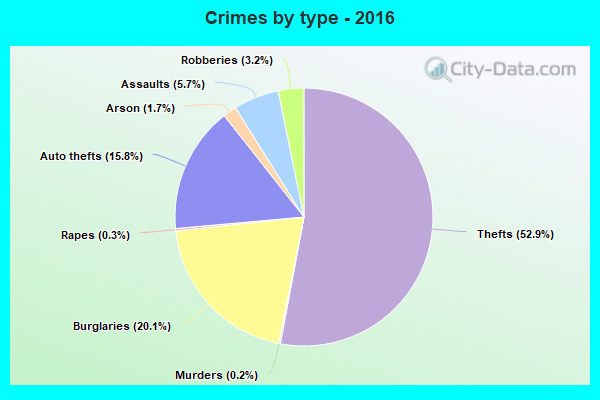
Property crime rate in 2016
| Bakersfield: | 460.6 |
| U.S. Average: | 216.6 |
Property crime rate in 2015
| Bakersfield: | 427.6 |
| U.S. Average: | 221.5 |
Property crime rate in 2014
| Bakersfield: | 426.7 |
| U.S. Average: | 230.8 |
Property crime rate in 2013
| Bakersfield: | 504.4 |
| U.S. Average: | 250.4 |
Property crime rate in 2012
| Bakersfield: | 550.7 |
| U.S. Average: | 267.3 |
Property crime rate in 2011
| Bakersfield: | 463.6 |
| U.S. Average: | 273.5 |
Property crime rate in 2010
| Bakersfield: | 472.1 |
| U.S. Average: | 276.4 |
Property crime rate in 2009
| Bakersfield: | 483.9 |
| U.S. Average: | 285.6 |
Property crime rate in 2008
| Bakersfield: | 516.7 |
| U.S. Average: | 302.2 |
Property crime rate in 2007
| Bakersfield: | 449.1 |
| U.S. Average: | 309.2 |
Property crime rate in 2006
| Bakersfield: | 483.4 |
| U.S. Average: | 317.3 |
Property crime rate in 2005
| Bakersfield: | 516.3 |
| U.S. Average: | 322.3 |
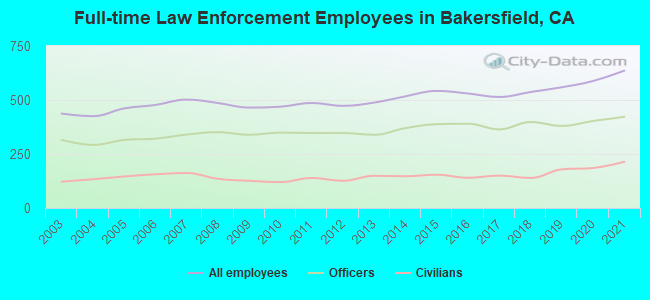
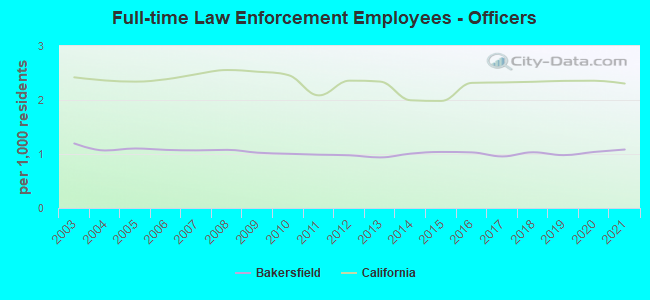
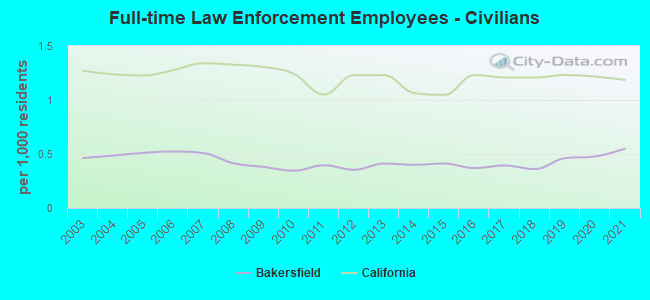
Full-time law enforcement employees in 2021, including police officers: 636 (422 officers - 383 male; 39 female).
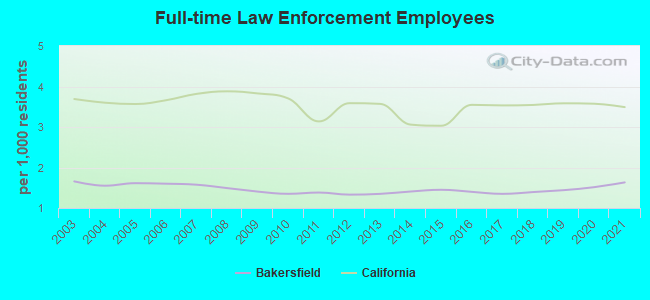
| Officers per 1,000 residents here: | 1.08 |
| California average: | 2.30 |
Full-time law enforcement employees in 2020, including police officers: 588 (403 officers - 360 male; 43 female).
| Officers per 1,000 residents here: | 1.04 |
| California average: | 2.36 |
Full-time law enforcement employees in 2019, including police officers: 559 (380 officers - 341 male; 39 female).
| Officers per 1,000 residents here: | 0.98 |
| California average: | 2.35 |
Full-time law enforcement employees in 2018, including police officers: 537 (398 officers - 360 male; 38 female).
| Officers per 1,000 residents here: | 1.03 |
| California average: | 2.34 |
Full-time law enforcement employees in 2017, including police officers: 514 (364 officers - 332 male; 32 female).
| Officers per 1,000 residents here: | 0.95 |
| California average: | 2.32 |
Full-time law enforcement employees in 2016, including police officers: 530 (390 officers - 358 male; 32 female).
| Officers per 1,000 residents here: | 1.03 |
| California average: | 2.32 |
Full-time law enforcement employees in 2015, including police officers: 542 (388 officers - 358 male; 30 female).
| Officers per 1,000 residents here: | 1.04 |
| California average: | 1.98 |
Full-time law enforcement employees in 2014, including police officers: 517 (370 officers - 344 male; 26 female).
| Officers per 1,000 residents here: | 1.01 |
| California average: | 2.00 |
Full-time law enforcement employees in 2013, including police officers: 488 (339 officers - 319 male; 20 female).
| Officers per 1,000 residents here: | 0.94 |
| California average: | 2.34 |
Full-time law enforcement employees in 2012, including police officers: 473 (347 officers - 327 male; 20 female).
| Officers per 1,000 residents here: | 0.98 |
| California average: | 2.36 |
Full-time law enforcement employees in 2011, including police officers: 486 (347 officers - 327 male; 20 female).
| Officers per 1,000 residents here: | 0.99 |
| California average: | 2.09 |
Full-time law enforcement employees in 2010, including police officers: 469 (349 officers - 324 male; 25 female).
| Officers per 1,000 residents here: | 1.00 |
| California average: | 2.46 |
Full-time law enforcement employees in 2009, including police officers: 465 (339 officers - 315 male; 24 female).
| Officers per 1,000 residents here: | 1.02 |
| California average: | 2.52 |
Full-time law enforcement employees in 2008, including police officers: 486 (351 officers - 325 male; 26 female).
| Officers per 1,000 residents here: | 1.08 |
| California average: | 2.55 |
Full-time law enforcement employees in 2007, including police officers: 502 (340 officers - 316 male; 24 female).
| Officers per 1,000 residents here: | 1.07 |
| California average: | 2.48 |
Full-time law enforcement employees in 2006, including police officers: 477 (321 officers - 300 male; 21 female).
| Officers per 1,000 residents here: | 1.08 |
| California average: | 2.38 |
Full-time law enforcement employees in 2005, including police officers: 461 (315 officers - 297 male; 18 female).
| Officers per 1,000 residents here: | 1.10 |
| California average: | 2.34 |
Full-time law enforcement employees in 2004, including police officers: 425 (292 officers - 275 male; 17 female).
| Officers per 1,000 residents here: | 1.07 |
| California average: | 2.36 |
Full-time law enforcement employees in 2003, including police officers: 437 (315 officers - 298 male; 17 female).
| Officers per 1,000 residents here: | 1.19 |
| California average: | 2.42 |


Zip codes: 93220, 93301, 93304, 93305, 93306, 93307, 93308, 93309, 93311, 93312, 93313, 93314.