Crime rate in Miami Beach, Florida (FL): murders, rapes, robberies, assaults, burglaries, thefts, auto thefts, arson, law enforcement employees, police officers, crime map
Crime rate in Miami Beach, FL
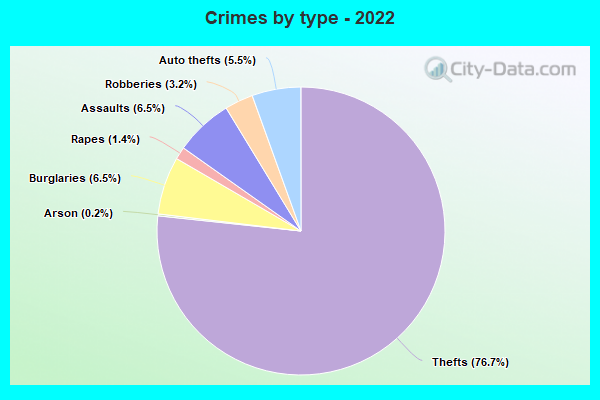
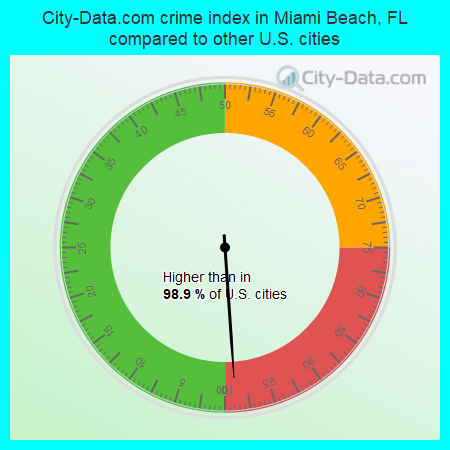
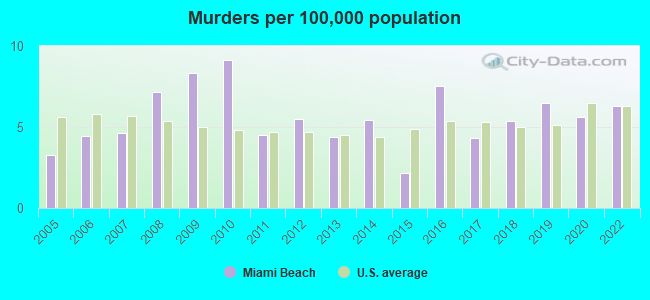
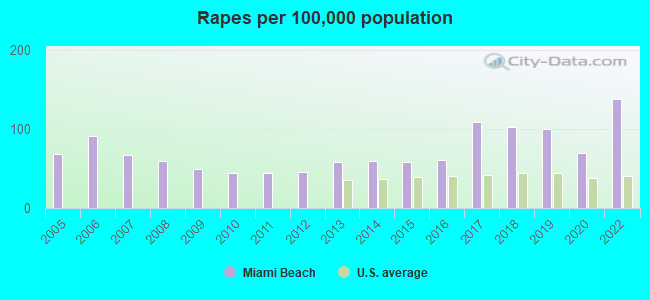
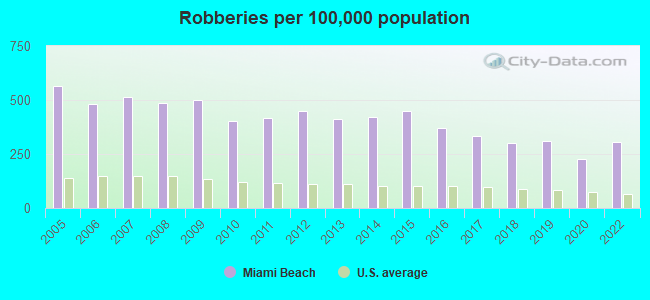
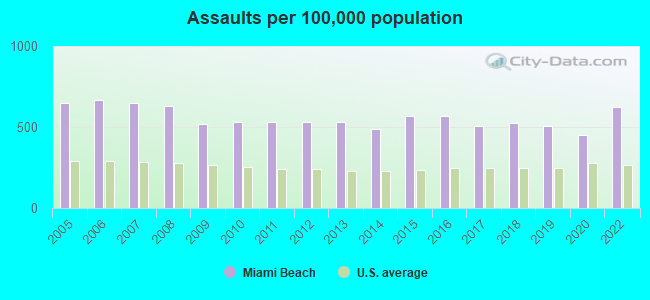
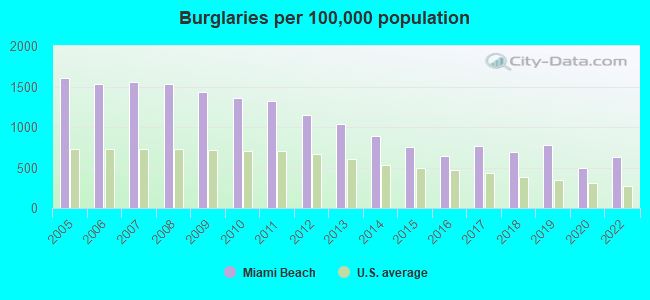
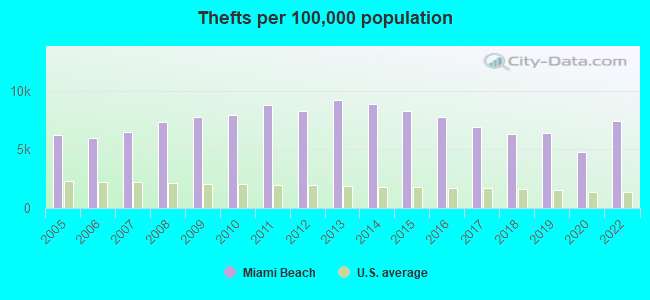
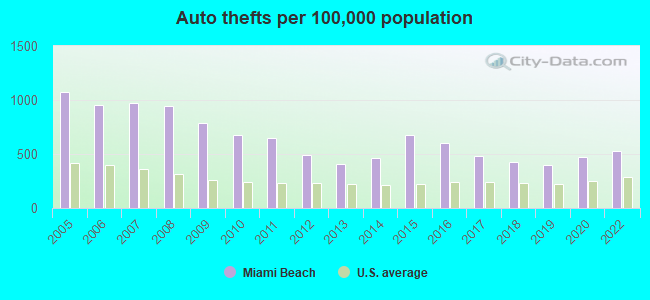
The 2022 crime rate in Miami Beach, FL is 722 (City-Data.com crime index), which is 2.9 times higher than the U.S. average. It was higher than in 98.9% U.S. cities. The 2022 Miami Beach crime rate rose by 48% compared to 2020. The number of homicides stood at 5. In the last 5 years Miami Beach has seen rise of violent crime and increasing property crime.See how dangerous Miami Beach, FL is compared to the nearest cities:
(Note: Higher means more crime)
(Note: Higher means more crime)
| Miami Beach: | 722.1 |
| North Bay Village: | 122.8 |
| Surfside: | 131.4 |
| Indian Creek: | 44.9 |
| El Portal: | 48.4 |
| Miami Shores: | 347.2 |
| Bay Harbor Islands: | 59.0 |
| Bal Harbour: | 139.4 |
| Biscayne Park: | 57.8 |

The City-Data.com crime index weighs serious crimes and violent crimes more heavily. Higher means more crime, U.S. average is 246.1. It adjusts for the number of visitors and daily workers commuting into cities.
- means the value is bigger than the state average.- means the value is much bigger than the state average.
According to our research of Florida and other state lists, there were 16 registered sex offenders living in Miami Beach, Florida as of April 28, 2024.
The ratio of all residents to sex offenders in Miami Beach is 5,744 to 1.
The ratio of registered sex offenders to all residents in this city is much lower than the state average.
Violent crime rate in 2022
| Miami Beach: | 615.6 |
| U.S. Average: | 219.8 |
Violent crime rate in 2020
| Miami Beach: | 418.5 |
| U.S. Average: | 228.2 |
Violent crime rate in 2019
| Miami Beach: | 521.8 |
| U.S. Average: | 219.9 |
Violent crime rate in 2018
| Miami Beach: | 528.4 |
| U.S. Average: | 221.2 |
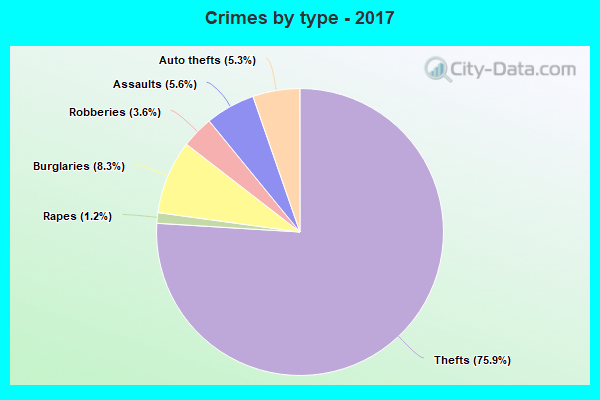
Violent crime rate in 2017
| Miami Beach: | 538.5 |
| U.S. Average: | 226.2 |
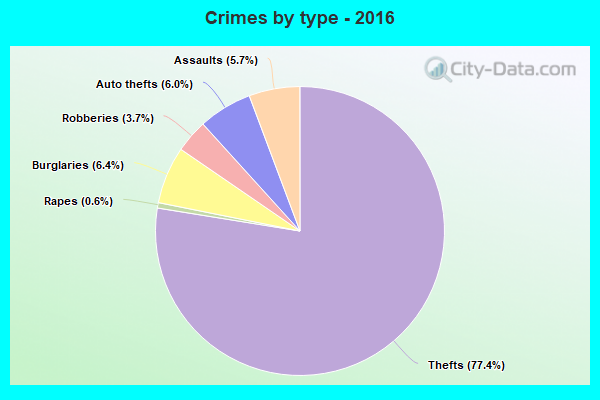
Violent crime rate in 2016
| Miami Beach: | 546.3 |
| U.S. Average: | 227.3 |
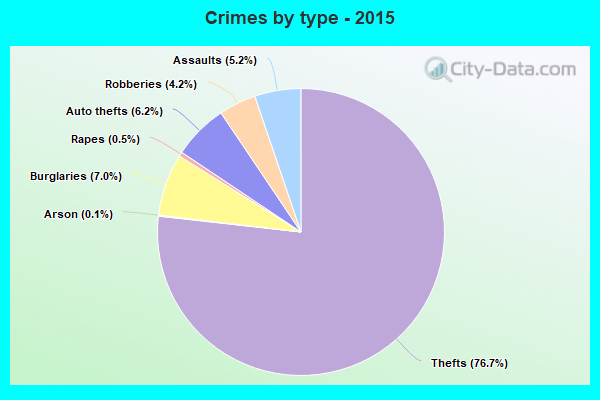
Violent crime rate in 2015
| Miami Beach: | 571.0 |
| U.S. Average: | 219.3 |
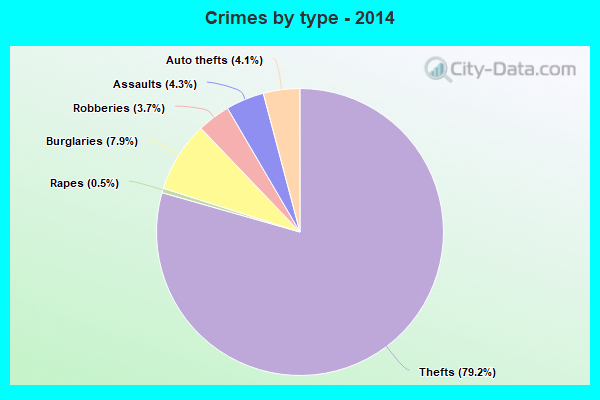
Violent crime rate in 2014
| Miami Beach: | 524.1 |
| U.S. Average: | 211.1 |
Violent crime rate in 2013
| Miami Beach: | 538.1 |
| U.S. Average: | 214.2 |
Violent crime rate in 2012
| Miami Beach: | 548.0 |
| U.S. Average: | 187.4 |
Violent crime rate in 2011
| Miami Beach: | 527.7 |
| U.S. Average: | 187.1 |
Violent crime rate in 2010
| Miami Beach: | 528.0 |
| U.S. Average: | 195.7 |
Violent crime rate in 2009
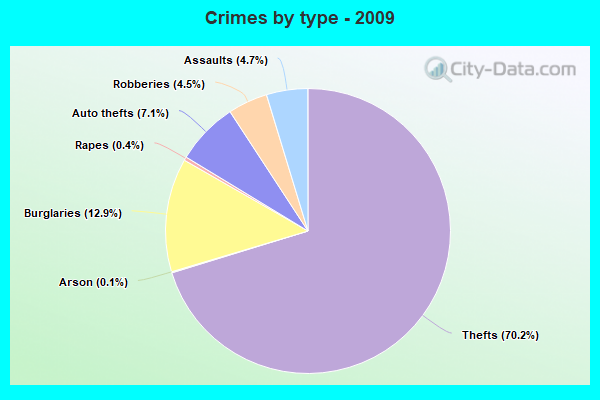
| Miami Beach: | 574.4 |
| U.S. Average: | 208.9 |
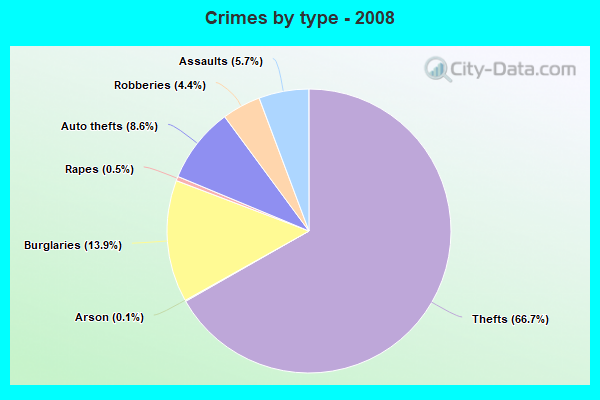
Violent crime rate in 2008
| Miami Beach: | 632.7 |
| U.S. Average: | 222.5 |
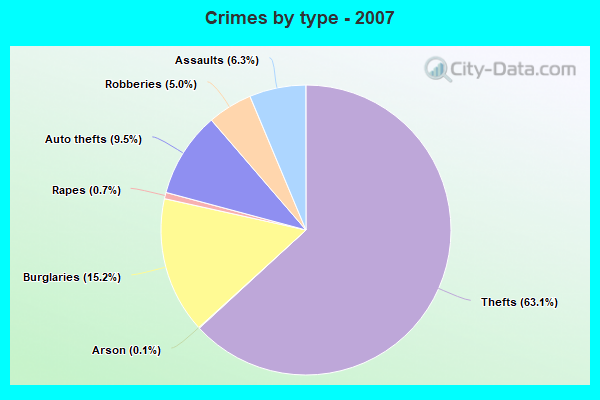
Violent crime rate in 2007
| Miami Beach: | 293.1 |
| U.S. Average: | 229.1 |
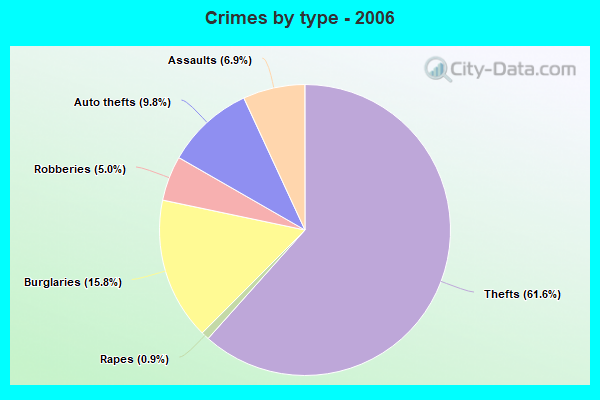
Violent crime rate in 2006
| Miami Beach: | 300.8 |
| U.S. Average: | 232.6 |
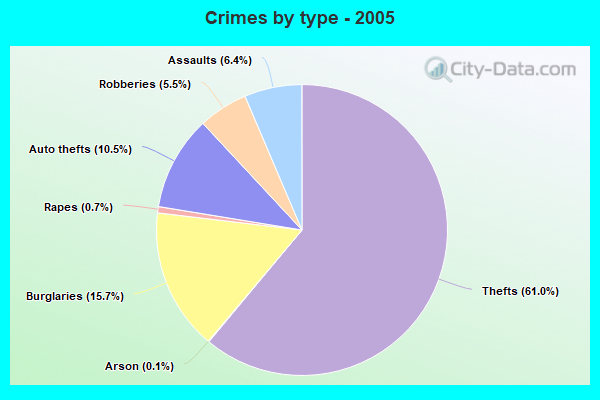
Violent crime rate in 2005
| Miami Beach: | 304.0 |
| U.S. Average: | 227.0 |
Property crime rate in 2022
| Miami Beach: | 575.1 |
| U.S. Average: | 166.5 |
Property crime rate in 2020
| Miami Beach: | 409.1 |
| U.S. Average: | 169.6 |
Property crime rate in 2019
| Miami Beach: | 534.8 |
| U.S. Average: | 179.7 |
Property crime rate in 2018
| Miami Beach: | 521.0 |
| U.S. Average: | 190.2 |
Property crime rate in 2017
| Miami Beach: | 572.8 |
| U.S. Average: | 206.4 |
Property crime rate in 2016
| Miami Beach: | 609.6 |
| U.S. Average: | 216.6 |
Property crime rate in 2015
| Miami Beach: | 666.2 |
| U.S. Average: | 221.5 |
Property crime rate in 2014
| Miami Beach: | 693.9 |
| U.S. Average: | 230.8 |
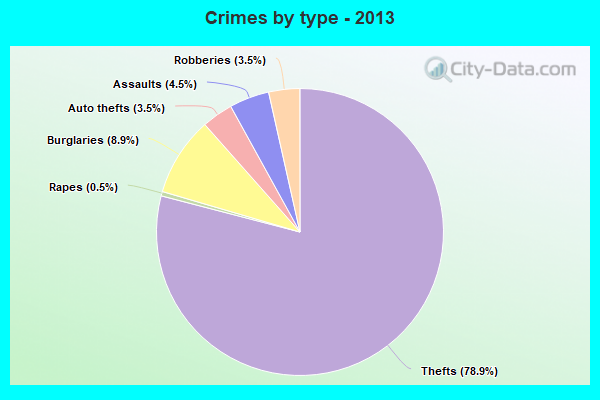
Property crime rate in 2013
| Miami Beach: | 730.2 |
| U.S. Average: | 250.4 |
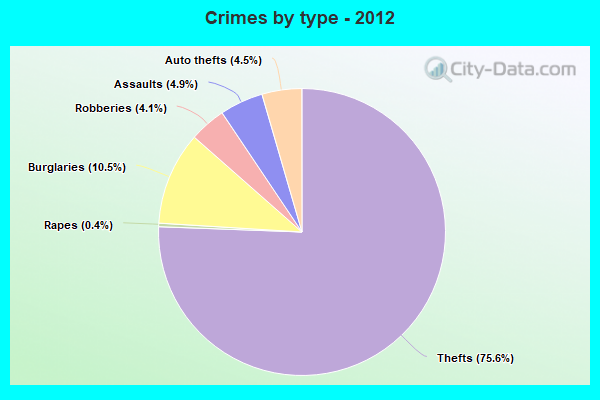
Property crime rate in 2012
| Miami Beach: | 717.1 |
| U.S. Average: | 267.3 |
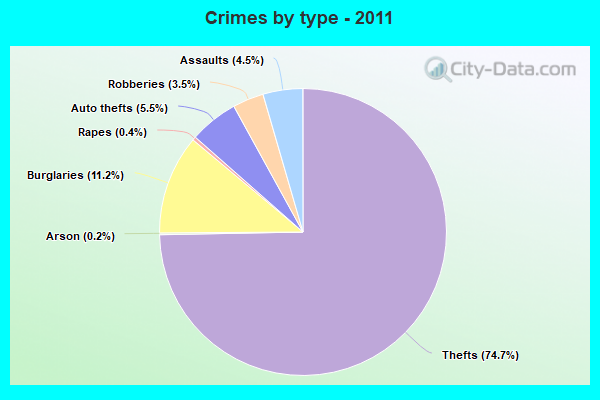
Property crime rate in 2011
| Miami Beach: | 800.8 |
| U.S. Average: | 273.5 |
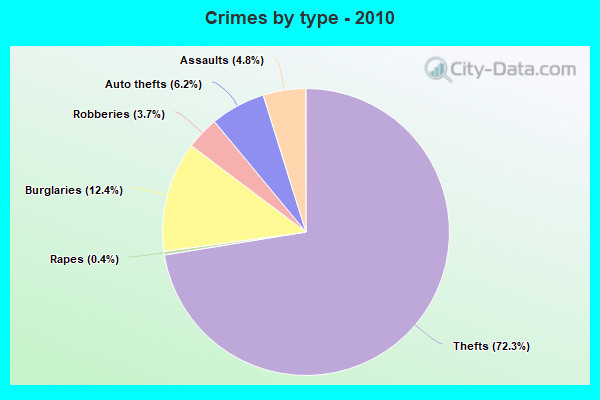
Property crime rate in 2010
| Miami Beach: | 769.4 |
| U.S. Average: | 276.4 |
Property crime rate in 2009
| Miami Beach: | 794.6 |
| U.S. Average: | 285.6 |
Property crime rate in 2008
| Miami Beach: | 815.5 |
| U.S. Average: | 302.2 |
Property crime rate in 2007
| Miami Beach: | 347.9 |
| U.S. Average: | 309.2 |
Property crime rate in 2006
| Miami Beach: | 333.8 |
| U.S. Average: | 317.3 |
Property crime rate in 2005
| Miami Beach: | 353.4 |
| U.S. Average: | 322.3 |
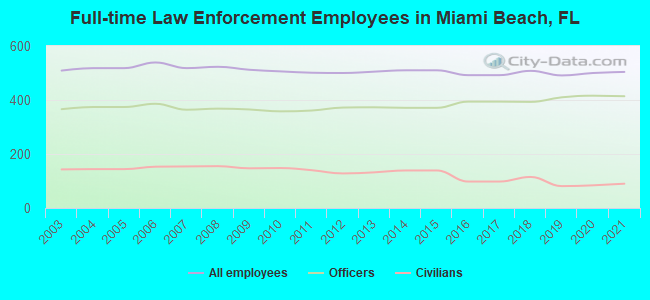
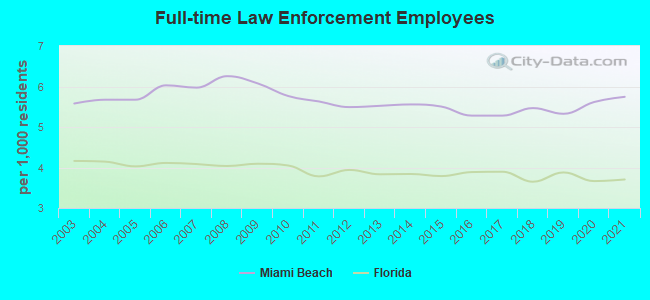
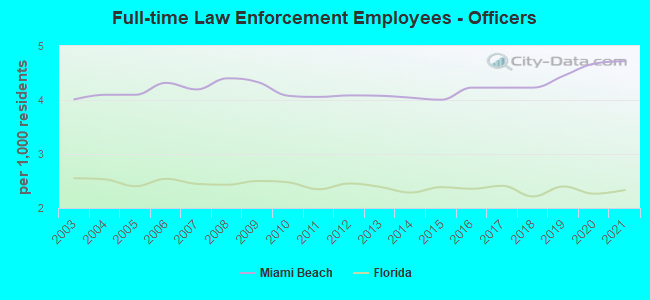
Full-time law enforcement employees in 2021, including police officers: 504 (414 officers - 345 male; 69 female).
| Officers per 1,000 residents here: | 4.72 |
| Florida average: | 2.33 |
Full-time law enforcement employees in 2020, including police officers: 500 (416 officers - 341 male; 75 female).
| Officers per 1,000 residents here: | 4.67 |
| Florida average: | 2.26 |
Full-time law enforcement employees in 2019, including police officers: 491 (410 officers - 335 male; 75 female).
| Officers per 1,000 residents here: | 4.45 |
| Florida average: | 2.40 |
Full-time law enforcement employees in 2018, including police officers: 508 (393 officers - 330 male; 63 female).
| Officers per 1,000 residents here: | 4.23 |
| Florida average: | 2.21 |
Full-time law enforcement employees in 2016, including police officers: 492 (394 officers - 343 male; 51 female).
| Officers per 1,000 residents here: | 4.23 |
| Florida average: | 2.36 |
Full-time law enforcement employees in 2015, including police officers: 510 (371 officers - 322 male; 49 female).
| Officers per 1,000 residents here: | 4.00 |
| Florida average: | 2.39 |
Full-time law enforcement employees in 2014, including police officers: 510 (371 officers - 322 male; 49 female).
| Officers per 1,000 residents here: | 4.04 |
| Florida average: | 2.29 |
Full-time law enforcement employees in 2013, including police officers: 505 (373 officers - 328 male; 45 female).
| Officers per 1,000 residents here: | 4.08 |
| Florida average: | 2.39 |
Full-time law enforcement employees in 2012, including police officers: 500 (372 officers - 327 male; 45 female).
| Officers per 1,000 residents here: | 4.08 |
| Florida average: | 2.45 |
Full-time law enforcement employees in 2011, including police officers: 501 (361 officers - 319 male; 42 female).
| Officers per 1,000 residents here: | 4.06 |
| Florida average: | 2.35 |
Full-time law enforcement employees in 2010, including police officers: 506 (358 officers - 316 male; 42 female).
| Officers per 1,000 residents here: | 4.08 |
| Florida average: | 2.47 |
Full-time law enforcement employees in 2009, including police officers: 512 (365 officers - 324 male; 41 female).
| Officers per 1,000 residents here: | 4.33 |
| Florida average: | 2.50 |
Full-time law enforcement employees in 2008, including police officers: 523 (368 officers - 325 male; 43 female).
| Officers per 1,000 residents here: | 4.40 |
| Florida average: | 2.43 |
Full-time law enforcement employees in 2007, including police officers: 518 (364 officers - 325 male; 39 female).
| Officers per 1,000 residents here: | 4.20 |
| Florida average: | 2.45 |
Full-time law enforcement employees in 2006, including police officers: 539 (386 officers - 344 male; 42 female).
| Officers per 1,000 residents here: | 4.32 |
| Florida average: | 2.54 |
Full-time law enforcement employees in 2004, including police officers: 518 (374 officers - 331 male; 43 female).
| Officers per 1,000 residents here: | 4.10 |
| Florida average: | 2.53 |
Full-time law enforcement employees in 2003, including police officers: 509 (366 officers - 323 male; 43 female).
| Officers per 1,000 residents here: | 4.01 |
| Florida average: | 2.55 |