Crime rate in Rochester, New York (NY): murders, rapes, robberies, assaults, burglaries, thefts, auto thefts, arson, law enforcement employees, police officers, crime map
Crime rate in Rochester, NY
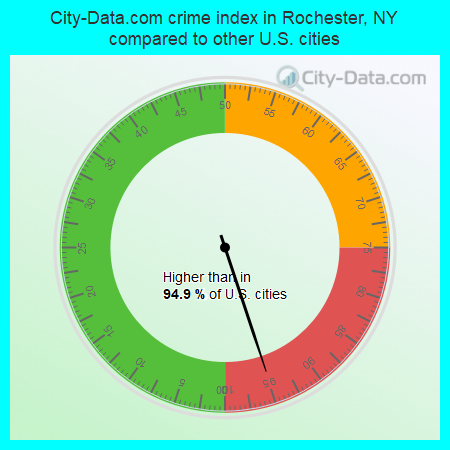
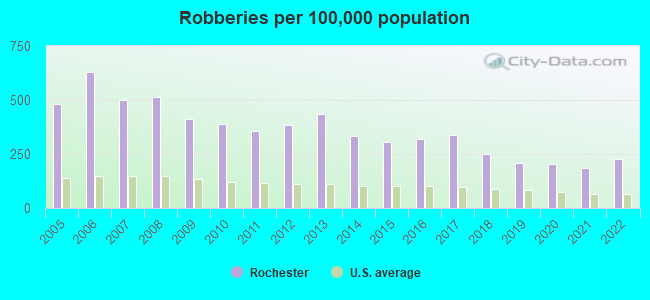
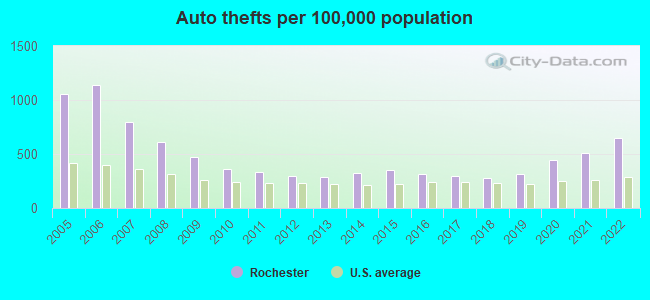
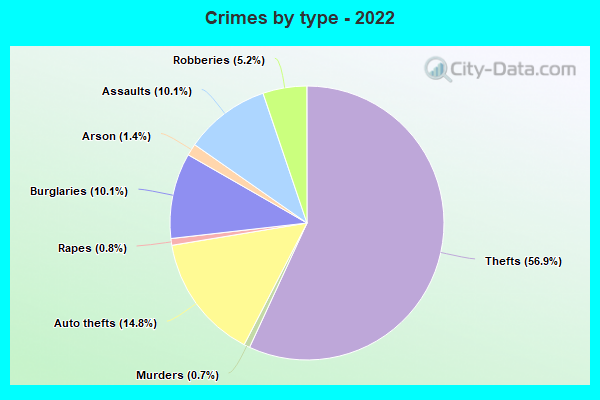
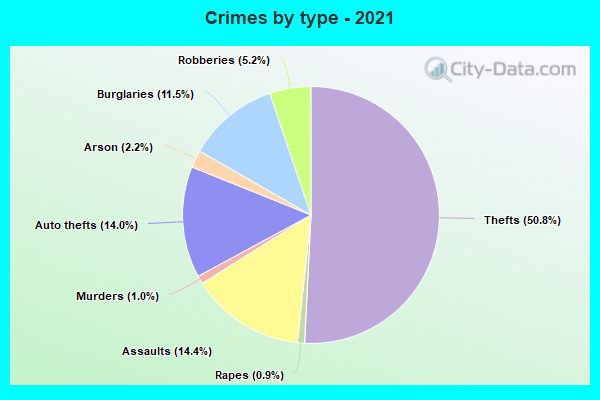
The 2022 crime rate in Rochester, NY is 428 (City-Data.com crime index), which is 1.7 times greater than the U.S. average. It was higher than in 94.9% U.S. cities. The 2022 Rochester crime rate rose by 7% compared to 2021. The number of homicides stood at 66 - a decrease of 6 compared to 2021. In the last 5 years Rochester has seen decreasing violent crime and rise of property crime.See how dangerous Rochester, NY is compared to the nearest cities:
(Note: Higher means more crime)
(Note: Higher means more crime)
| Rochester: | 427.7 |
| Irondequoit: | 117.0 |
| Brighton: | 122.3 |
| Gates: | 87.5 |
| Greece: | 135.3 |
| East Rochester: | 85.8 |
| Fairport: | 39.4 |
| Webster: | 58.3 |
| Ogden: | 68.0 |
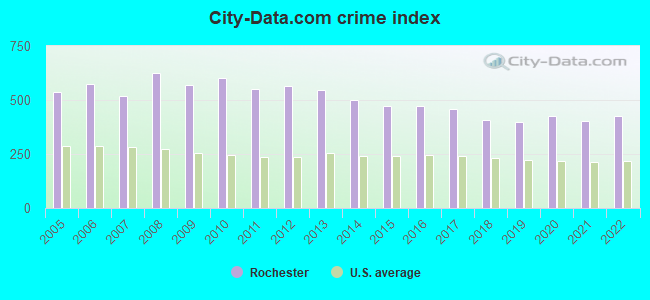
The City-Data.com crime index weighs serious crimes and violent crimes more heavily. Higher means more crime, U.S. average is 246.1. It adjusts for the number of visitors and daily workers commuting into cities.
- means the value is smaller than the state average.- means the value is about the same as the state average.
- means the value is bigger than the state average.
- means the value is much bigger than the state average.
According to our research of New York and other state lists, there were 982 registered sex offenders living in Rochester, New York as of April 27, 2024.
The ratio of all residents to sex offenders in Rochester is 213 to 1.
Violent crime rate in 2022
| Rochester: | 429.2 |
| U.S. Average: | 219.8 |
Violent crime rate in 2021
| Rochester: | 457.9 |
| U.S. Average: | 224.8 |
Violent crime rate in 2020
| Rochester: | 465.4 |
| U.S. Average: | 228.2 |
Violent crime rate in 2019
| Rochester: | 423.0 |
| U.S. Average: | 219.9 |
Violent crime rate in 2018
| Rochester: | 441.3 |
| U.S. Average: | 221.2 |
Violent crime rate in 2017
| Rochester: | 501.9 |
| U.S. Average: | 226.2 |
Violent crime rate in 2016
| Rochester: | 509.2 |
| U.S. Average: | 227.3 |
Violent crime rate in 2015
| Rochester: | 496.9 |
| U.S. Average: | 219.3 |
Violent crime rate in 2014
| Rochester: | 497.3 |
| U.S. Average: | 211.1 |
Violent crime rate in 2013
| Rochester: | 552.1 |
| U.S. Average: | 214.2 |
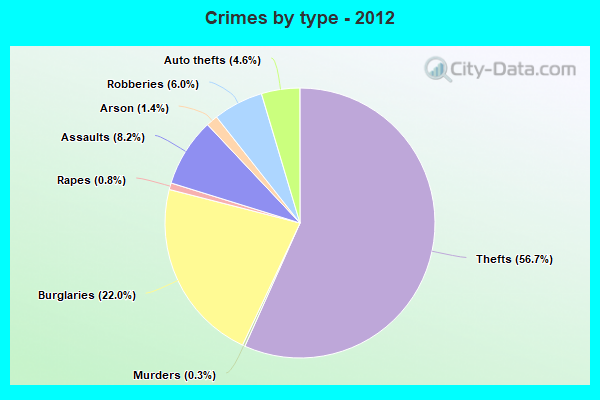
Violent crime rate in 2012
| Rochester: | 539.9 |
| U.S. Average: | 187.4 |
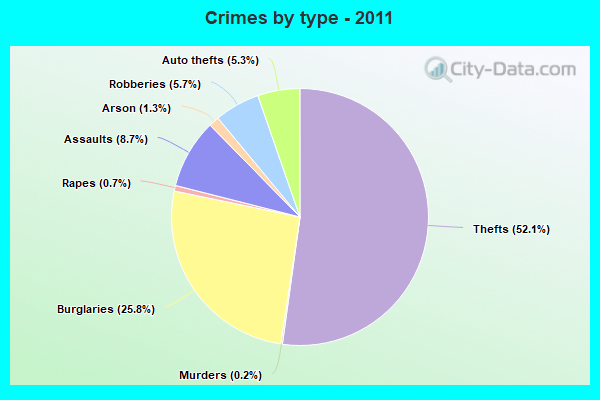
Violent crime rate in 2011
| Rochester: | 524.1 |
| U.S. Average: | 187.1 |
Violent crime rate in 2010
| Rochester: | 582.0 |
| U.S. Average: | 195.7 |
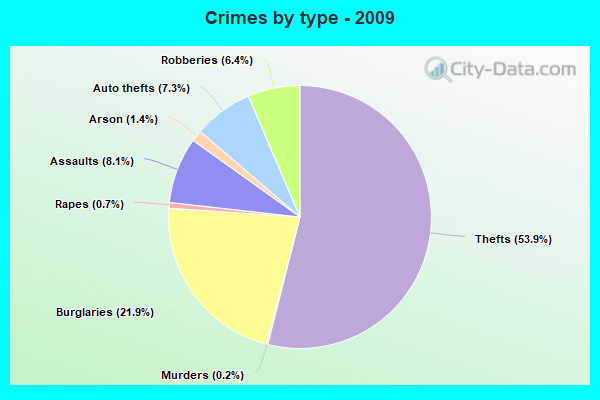
Violent crime rate in 2009
| Rochester: | 540.8 |
| U.S. Average: | 208.9 |
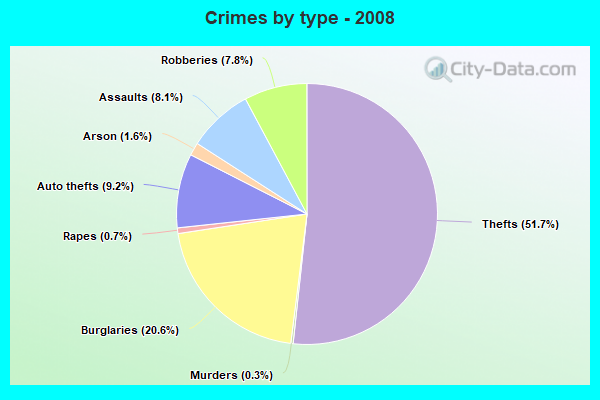
Violent crime rate in 2008
| Rochester: | 615.1 |
| U.S. Average: | 222.5 |
Violent crime rate in 2007
| Rochester: | 511.5 |
| U.S. Average: | 229.1 |
Violent crime rate in 2006
| Rochester: | 553.6 |
| U.S. Average: | 232.6 |
Violent crime rate in 2005
| Rochester: | 464.1 |
| U.S. Average: | 227.0 |
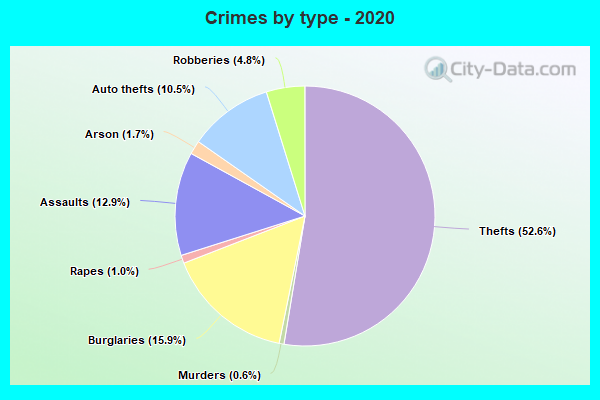
Property crime rate in 2022
| Rochester: | 310.4 |
| U.S. Average: | 166.5 |
Property crime rate in 2021
| Rochester: | 251.4 |
| U.S. Average: | 157.8 |
Property crime rate in 2020
| Rochester: | 313.9 |
| U.S. Average: | 169.6 |
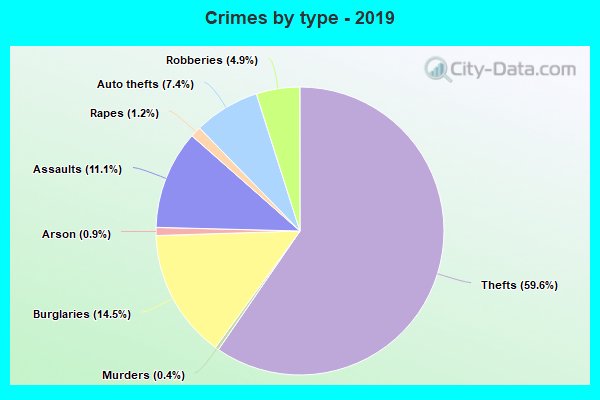
Property crime rate in 2019
| Rochester: | 297.7 |
| U.S. Average: | 179.7 |
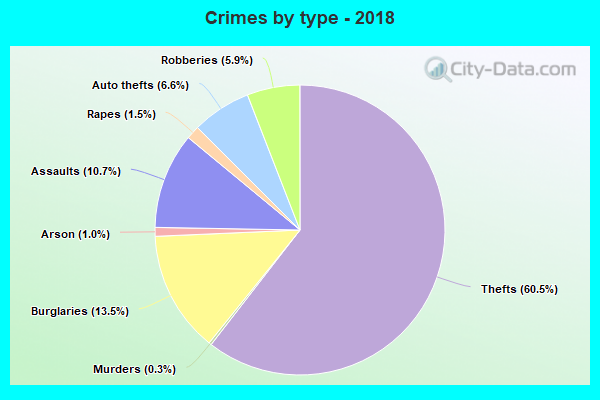
Property crime rate in 2018
| Rochester: | 282.0 |
| U.S. Average: | 190.2 |
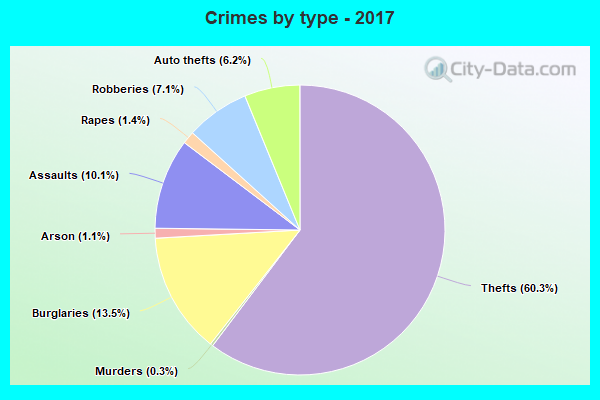
Property crime rate in 2017
| Rochester: | 315.9 |
| U.S. Average: | 206.4 |
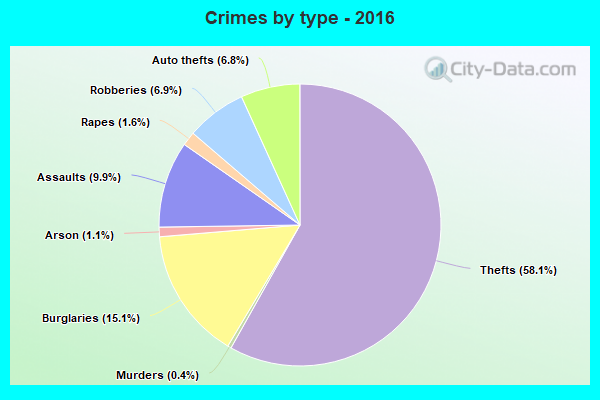
Property crime rate in 2016
| Rochester: | 323.6 |
| U.S. Average: | 216.6 |
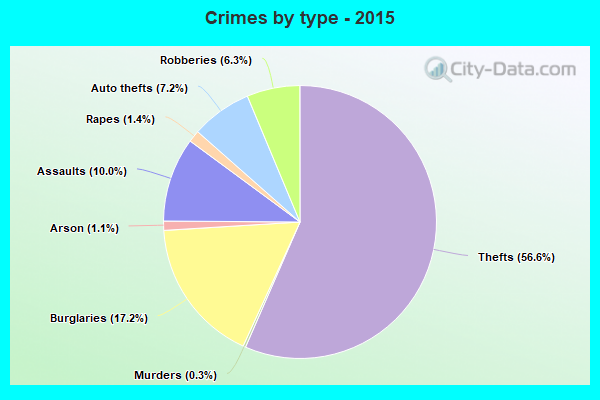
Property crime rate in 2015
| Rochester: | 357.1 |
| U.S. Average: | 221.5 |
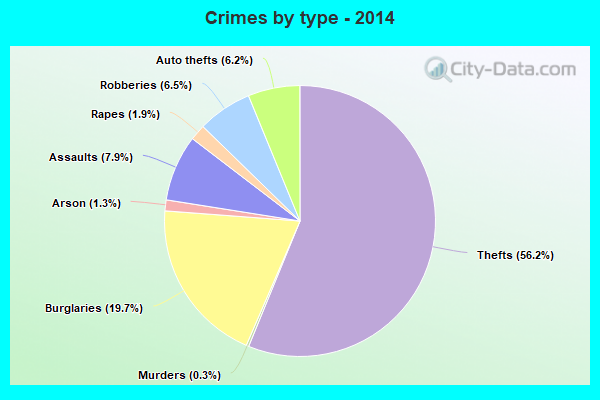
Property crime rate in 2014
| Rochester: | 394.0 |
| U.S. Average: | 230.8 |
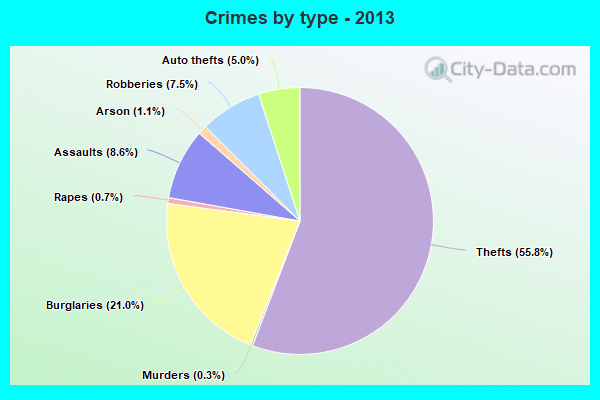
Property crime rate in 2013
| Rochester: | 451.9 |
| U.S. Average: | 250.4 |
Property crime rate in 2012
| Rochester: | 506.2 |
| U.S. Average: | 267.3 |
Property crime rate in 2011
| Rochester: | 531.6 |
| U.S. Average: | 273.5 |
Property crime rate in 2010
| Rochester: | 562.0 |
| U.S. Average: | 276.4 |
Property crime rate in 2009
| Rochester: | 525.7 |
| U.S. Average: | 285.6 |
Property crime rate in 2008
| Rochester: | 537.6 |
| U.S. Average: | 302.2 |
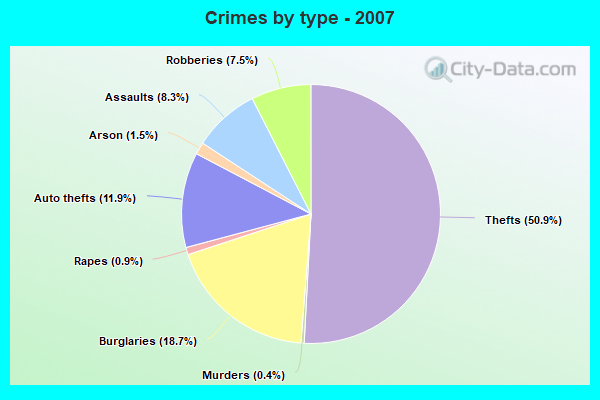
Property crime rate in 2007
| Rochester: | 435.7 |
| U.S. Average: | 309.2 |
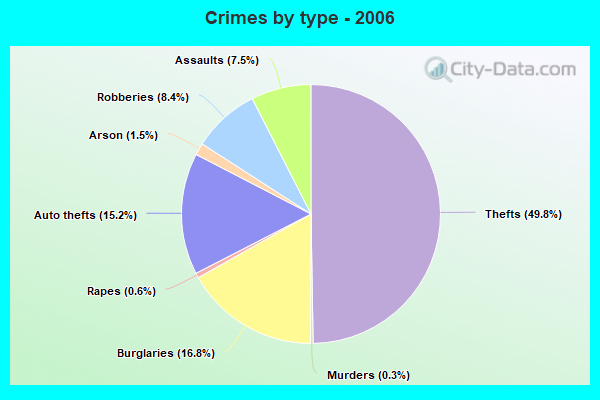
Property crime rate in 2006
| Rochester: | 492.5 |
| U.S. Average: | 317.3 |
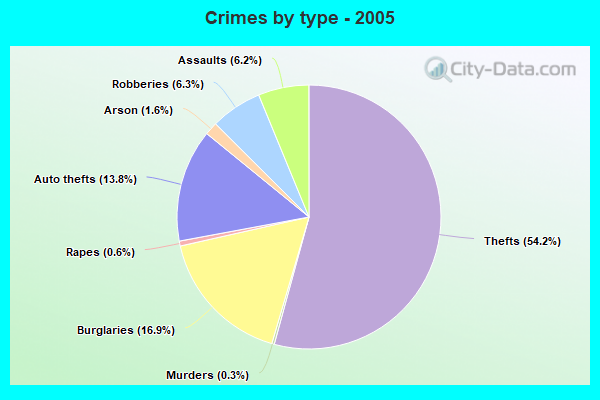
Property crime rate in 2005
| Rochester: | 504.1 |
| U.S. Average: | 322.3 |
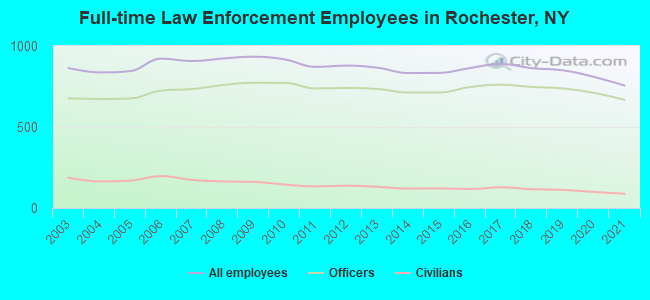
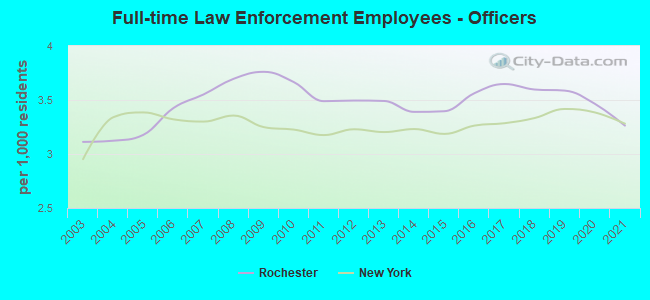
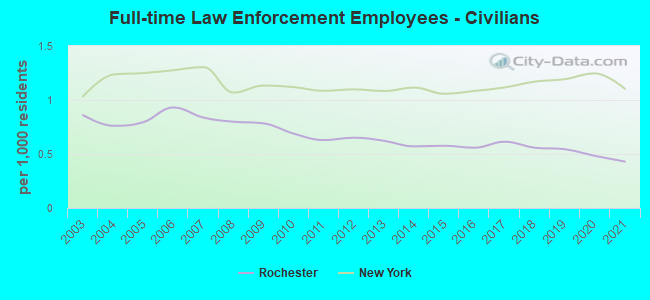
Full-time law enforcement employees in 2021, including police officers: 756 (668 officers - 571 male; 97 female).
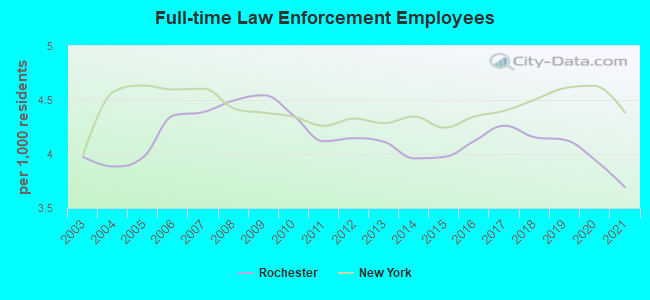
| Officers per 1,000 residents here: | 3.26 |
| New York average: | 3.28 |
Full-time law enforcement employees in 2020, including police officers: 810 (711 officers - 612 male; 99 female).
| Officers per 1,000 residents here: | 3.46 |
| New York average: | 3.38 |
Full-time law enforcement employees in 2019, including police officers: 850 (738 officers - 640 male; 98 female).
| Officers per 1,000 residents here: | 3.59 |
| New York average: | 3.42 |
Full-time law enforcement employees in 2018, including police officers: 863 (747 officers - 647 male; 100 female).
| Officers per 1,000 residents here: | 3.60 |
| New York average: | 3.33 |
Full-time law enforcement employees in 2017, including police officers: 889 (761 officers - 667 male; 94 female).
| Officers per 1,000 residents here: | 3.65 |
| New York average: | 3.28 |
Full-time law enforcement employees in 2016, including police officers: 864 (747 officers - 653 male; 94 female).
| Officers per 1,000 residents here: | 3.56 |
| New York average: | 3.26 |
Full-time law enforcement employees in 2015, including police officers: 834 (713 officers - 623 male; 90 female).
| Officers per 1,000 residents here: | 3.40 |
| New York average: | 3.19 |
Full-time law enforcement employees in 2014, including police officers: 833 (713 officers - 629 male; 84 female).
| Officers per 1,000 residents here: | 3.39 |
| New York average: | 3.23 |
Full-time law enforcement employees in 2013, including police officers: 866 (735 officers - 646 male; 89 female).
| Officers per 1,000 residents here: | 3.49 |
| New York average: | 3.20 |
Full-time law enforcement employees in 2012, including police officers: 879 (741 officers - 651 male; 90 female).
| Officers per 1,000 residents here: | 3.50 |
| New York average: | 3.23 |
Full-time law enforcement employees in 2011, including police officers: 871 (738 officers - 649 male; 89 female).
| Officers per 1,000 residents here: | 3.49 |
| New York average: | 3.18 |
Full-time law enforcement employees in 2010, including police officers: 917 (772 officers - 683 male; 89 female).
| Officers per 1,000 residents here: | 3.67 |
| New York average: | 3.23 |
Full-time law enforcement employees in 2009, including police officers: 934 (773 officers - 685 male; 88 female).
| Officers per 1,000 residents here: | 3.76 |
| New York average: | 3.25 |
Full-time law enforcement employees in 2008, including police officers: 923 (759 officers - 671 male; 88 female).
| Officers per 1,000 residents here: | 3.70 |
| New York average: | 3.36 |
Full-time law enforcement employees in 2007, including police officers: 907 (734 officers - 653 male; 81 female).
| Officers per 1,000 residents here: | 3.55 |
| New York average: | 3.30 |
Full-time law enforcement employees in 2006, including police officers: 922 (725 officers - 645 male; 80 female).
| Officers per 1,000 residents here: | 3.43 |
| New York average: | 3.32 |
Full-time law enforcement employees in 2005, including police officers: 845 (676 officers - 600 male; 76 female).
| Officers per 1,000 residents here: | 3.18 |
| New York average: | 3.39 |
Full-time law enforcement employees in 2004, including police officers: 837 (673 officers - 602 male; 71 female).
| Officers per 1,000 residents here: | 3.12 |
| New York average: | 3.34 |
Full-time law enforcement employees in 2003, including police officers: 864 (677 officers - 607 male; 70 female).
| Officers per 1,000 residents here: | 3.11 |
| New York average: | 2.95 |

Zip codes: 14604, 14605, 14607, 14608, 14611, 14612, 14613, 14614, 14615, 14616, 14619, 14627.