Estimated zip code population in 2022: 34,705 Zip code population in 2010: 34,515 Zip code population in 2000: 35,665
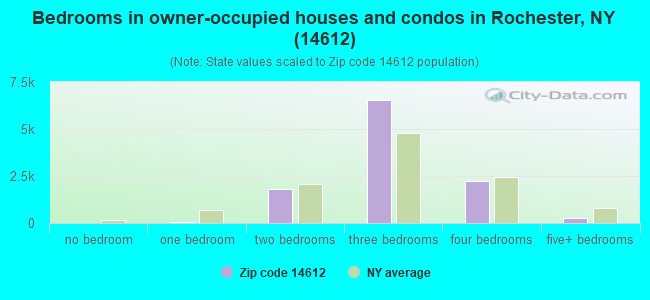
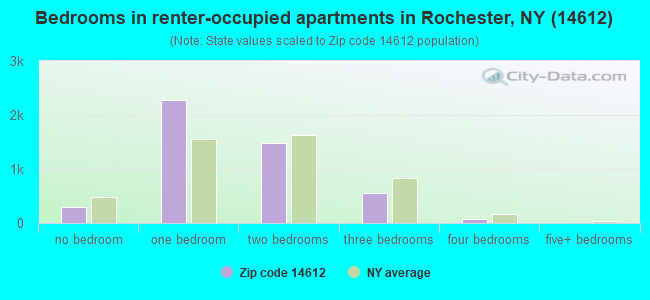
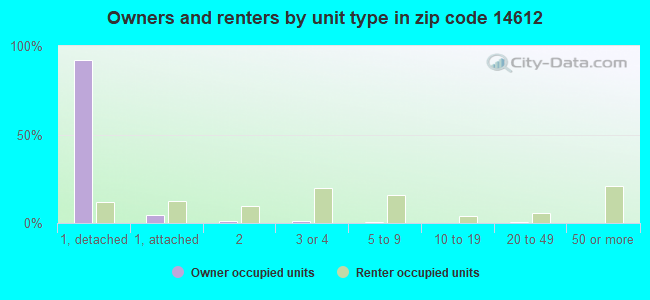
Houses and condos: 16,185 Renter-occupied apartments: 4,696
% of renters here:
30%
State:
46%
March 2022 cost of living index in zip code 14612: 102.0 (near average, U.S. average is 100)
Land area: 17.1 sq. mi. Water area: 2.7 sq. mi.
Population density: 2,032 people per square mile
(low).
OSM Map
General Map
Google Map
MSN Map
OSM Map
General Map
Google Map
MSN Map
OSM Map
General Map
Google Map
MSN Map
OSM Map
General Map
Google Map
MSN Map
Please wait while loading the map...
Real estate property taxes paid for housing units in 2022:
This zip code:
2.6% ($4,867)
New York:
1.5% ($6,180)
Median real estate property taxes paid for housing units with mortgages in 2022: $5,225 (2.7%) Median real estate property taxes paid for housing units with no mortgage in 2022: $4,518 (2.5%)
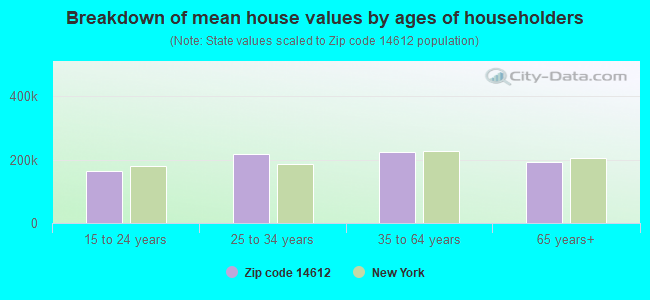
Estimated median house/condo value in 2022: $184,824
14612:
$184,824
New York:
$400,400
According to our research of New York and other state lists, there were 26 registered sex offenders living in 14612 zip code as of April 27, 2024. The ratio of all residents to sex offenders in zip code 14612 is 1,323 to 1. The ratio of registered sex offenders to all residents in this zip code is lower than the state average.
Median resident age:
This zip code:
44.9 years
New York median age:
40.0 years
Average household size:
This zip code:
2.2 people
New York:
2.5 people
Averages for the 2020 tax year for zip code 14612, filed in 2021:
Average Adjusted Gross Income (AGI) in 2020: $62,089 (Individual Income Tax Returns)
Here:
$62,089
State:
$90,930
Salary/wage: $53,446 (reported on 80.1% of returns)
Here:
$53,446
State:
$72,104
(% of AGI for various income ranges: 1029.8% for AGIs below $25k, 3318.5% for AGIs $25k-50k, 6116.9% for AGIs $50k-75k, 8762.9% for AGIs $75k-100k, 16138.7% for AGIs $100k-200k, 54995.0% for AGIs over 200k)
Taxable interest for individuals: $866 (reported on 48.2% of returns)
This zip code:
$866
New York:
$3,075
(% of AGI for various income ranges: 18.6% for AGIs below $25k, 21.8% for AGIs $25k-50k, 53.8% for AGIs $50k-75k, 80.5% for AGIs $75k-100k, 138.6% for AGIs $100k-200k, 875.6% for AGIs over 200k)
Ordinary dividends: $3,873 (reported on 22.3% of returns)
Here:
$3,873
State:
$11,095
(% of AGI for various income ranges: 25.8% for AGIs below $25k, 31.9% for AGIs $25k-50k, 83.0% for AGIs $50k-75k, 166.1% for AGIs $75k-100k, 260.8% for AGIs $100k-200k, 2983.3% for AGIs over 200k)
Net capital gain/loss in AGI: +$8,120 (reported on 18.8% of returns)
Here:
+$8,120
State:
+$44,925
(% of AGI for various income ranges: 10.9% for AGIs below $25k, 27.1% for AGIs $25k-50k, 105.1% for AGIs $50k-75k, 186.0% for AGIs $75k-100k, 487.1% for AGIs $100k-200k, 7652.2% for AGIs over 200k)
Profit/loss from business: +$11,024 (reported on 11.2% of returns)
Here:
+$11,024
State:
+$14,940
(% of AGI for various income ranges: 68.8% for AGIs below $25k, 95.2% for AGIs $25k-50k, 159.0% for AGIs $50k-75k, 233.9% for AGIs $75k-100k, 363.6% for AGIs $100k-200k, 2112.2% for AGIs over 200k)
Taxable individual retirement arrangement distribution: $18,315 (reported on 14.7% of returns)
14612:
$18,315
New York:
$19,609
(% of AGI for various income ranges: 116.2% for AGIs below $25k, 171.4% for AGIs $25k-50k, 374.5% for AGIs $50k-75k, 600.9% for AGIs $75k-100k, 1075.9% for AGIs $100k-200k, 2464.4% for AGIs over 200k)
Self-employed (Keogh) retirement plans: $20,938 (reported on 0.4% of returns)
14612:
$20,938
New York:
$32,497
(% of AGI for various income ranges: 4.5% for AGIs below $25k, 33.1% for AGIs $100k-200k, 526.1% for AGIs over 200k)
Total itemized deductions: $26,541 (reported on 6.1% of returns)
Here:
$26,541
State:
$39,326
(% of AGI for various income ranges: 51.0% for AGIs below $25k, 90.8% for AGIs $25k-50k, 253.3% for AGIs $50k-75k, 391.5% for AGIs $75k-100k, 508.1% for AGIs $100k-200k, 2996.1% for AGIs over 200k)
Charity contributions: $7,744 (reported on 4.7% of returns)
Here:
$7,744
State:
$15,420
(% of AGI for various income ranges: 3.6% for AGIs below $25k, 8.9% for AGIs $25k-50k, 32.3% for AGIs $50k-75k, 59.7% for AGIs $75k-100k, 134.5% for AGIs $100k-200k, 1418.3% for AGIs over 200k)
Taxes paid: $8,506 (reported on 6.1% of returns)
14612:
$8,506
State:
$9,183
(% of AGI for various income ranges: 10.8% for AGIs below $25k, 26.6% for AGIs $25k-50k, 100.1% for AGIs $50k-75k, 159.8% for AGIs $75k-100k, 163.7% for AGIs $100k-200k, 641.7% for AGIs over 200k)
Earned income credit: $1,989 (reported on 10.8% of returns)
Here:
$1,989
State:
$2,138
(% of AGI for various income ranges: 57.5% for AGIs below $25k, 45.8% for AGIs $25k-50k)
Percentage of individuals using paid preparers for their 2020 taxes: 95.2%
Here:
95%
State:
95%
(% for various income ranges: 94.0% for AGIs below $25k, 95.6% for AGIs $25k-50k, 94.8% for AGIs $50k-75k, 95.9% for AGIs $75k-100k, 96.5% for AGIs $100k-200k, 96.0% for AGIs over 200k)
Averages for the 2012 tax year for zip code 14612, filed in 2013:
Average Adjusted Gross Income (AGI) in 2012: $52,638 (Individual Income Tax Returns)
Here:
$52,638
State:
$77,088
Salary/wage: $46,132 (reported on 83.6% of returns)
Here:
$46,132
State:
$60,593
(% of AGI for various income ranges: 71.4% for AGIs below $25k, 76.9% for AGIs $25k-50k, 74.0% for AGIs $50k-75k, 72.7% for AGIs $75k-100k, 78.1% for AGIs $100k-200k, 55.2% for AGIs over 200k)
Taxable interest for individuals: $741 (reported on 51.3% of returns)
This zip code:
$741
New York:
$3,125
(% of AGI for various income ranges: 0.9% for AGIs below $25k, 0.6% for AGIs $25k-50k, 0.7% for AGIs $50k-75k, 0.5% for AGIs $75k-100k, 0.6% for AGIs $100k-200k, 1.5% for AGIs over 200k)
Ordinary dividends: $3,110 (reported on 24.0% of returns)
Here:
$3,110
State:
$10,299
(% of AGI for various income ranges: 1.9% for AGIs below $25k, 1.1% for AGIs $25k-50k, 1.2% for AGIs $50k-75k, 1.2% for AGIs $75k-100k, 1.3% for AGIs $100k-200k, 2.7% for AGIs over 200k)
Net capital gain/loss in AGI: +$2,395 (reported on 17.2% of returns)
Here:
+$2,395
State:
+$42,474
(% of AGI for various income ranges: 0.4% for AGIs $50k-75k, 0.5% for AGIs $75k-100k, 0.9% for AGIs $100k-200k, 3.6% for AGIs over 200k)
Profit/loss from business: +$11,548 (reported on 10.9% of returns)
Here:
+$11,548
State:
+$16,168
(% of AGI for various income ranges: 4.2% for AGIs below $25k, 2.7% for AGIs $25k-50k, 1.9% for AGIs $50k-75k, 1.6% for AGIs $75k-100k, 1.7% for AGIs $100k-200k, 4.4% for AGIs over 200k)
Taxable individual retirement arrangement distribution: $13,804 (reported on 14.2% of returns)
14612:
$13,804
New York:
$17,621
(% of AGI for various income ranges: 5.1% for AGIs below $25k, 3.8% for AGIs $25k-50k, 4.0% for AGIs $50k-75k, 4.5% for AGIs $75k-100k, 3.4% for AGIs $100k-200k, 1.8% for AGIs over 200k)
Self-employment retirement plans: $14,636 (reported on 0.6% of returns)
14612:
$14,636
New York:
$27,330
(% of AGI for various income ranges: 0.2% for AGIs $50k-75k, 0.2% for AGIs $100k-200k, 0.8% for AGIs over 200k)
Total itemized deductions: $19,438 (22% of AGI, reported on 37.7% of returns)
Here:
$19,438
State:
$34,985
Here:
21.6% of AGI
State:
21.3% of AGI
(% of AGI for various income ranges: 9.7% for AGIs below $25k, 10.7% for AGIs $25k-50k, 13.9% for AGIs $50k-75k, 14.7% for AGIs $75k-100k, 16.4% for AGIs $100k-200k, 14.5% for AGIs over 200k)
Charity contributions: $2,491 (reported on 32.3% of returns)
Here:
$2,491
State:
$5,572
(% of AGI for various income ranges: 0.7% for AGIs below $25k, 0.9% for AGIs $25k-50k, 1.5% for AGIs $50k-75k, 1.7% for AGIs $75k-100k, 2.0% for AGIs $100k-200k, 1.6% for AGIs over 200k)
Taxes paid: $10,051 (reported on 37.5% of returns)
14612:
$10,051
State:
$18,656
(% of AGI for various income ranges: 3.3% for AGIs below $25k, 4.6% for AGIs $25k-50k, 6.5% for AGIs $50k-75k, 7.7% for AGIs $75k-100k, 9.2% for AGIs $100k-200k, 9.2% for AGIs over 200k)
Earned income credit: $1,873 (reported on 12.3% of returns)
Here:
$1,873
State:
$2,230
(% of AGI for various income ranges: 4.0% for AGIs below $25k, 0.7% for AGIs $25k-50k)
Percentage of individuals using paid preparers for their 2012 taxes: 51.5%
Here:
51%
State:
66%
(% for various income ranges: 45.0% for AGIs below $25k, 48.3% for AGIs $25k-50k, 56.5% for AGIs $50k-75k, 60.5% for AGIs $75k-100k, 59.7% for AGIs $100k-200k, 77.8% for AGIs over 200k)
Averages for the 2004 tax year for zip code 14612, filed in 2005:
Average Adjusted Gross Income (AGI) in 2004: $44,908 (Individual Income Tax Returns)
Here:
$44,908
State:
$59,519
Salary/wage: $41,486 (reported on 86.1% of returns)
Here:
$41,486
State:
$50,673
(% of AGI for various income ranges: 101.4% for AGIs below $10k, 71.1% for AGIs $10k-25k, 79.1% for AGIs $25k-50k, 78.5% for AGIs $50k-75k, 84.5% for AGIs $75k-100k, 78.1% for AGIs over 100k)
Taxable interest for individuals: $818 (reported on 63.9% of returns)
This zip code:
$818
New York:
$2,377
(% of AGI for various income ranges: 4.0% for AGIs below $10k, 1.9% for AGIs $10k-25k, 1.3% for AGIs $25k-50k, 1.1% for AGIs $50k-75k, 0.6% for AGIs $75k-100k, 1.1% for AGIs over 100k)
Taxable dividends: $1,512 (reported on 32.8% of returns)
Here:
$1,512
State:
$5,394
(% of AGI for various income ranges: 3.5% for AGIs below $10k, 1.7% for AGIs $10k-25k, 1.0% for AGIs $25k-50k, 0.8% for AGIs $50k-75k, 0.9% for AGIs $75k-100k, 1.3% for AGIs over 100k)
Net capital gain/loss: +$2,548 (reported on 23.1% of returns)
Here:
+$2,548
State:
+$23,581
(% of AGI for various income ranges: -2.6% for AGIs below $10k, 0.3% for AGIs $10k-25k, 0.4% for AGIs $25k-50k, 0.6% for AGIs $50k-75k, 0.9% for AGIs $75k-100k, 3.3% for AGIs over 100k)
Profit/loss from business: +$9,771 (reported on 11.2% of returns)
Here:
+$9,771
State:
+$13,809
(% of AGI for various income ranges: 7.7% for AGIs below $10k, 3.4% for AGIs $10k-25k, 2.3% for AGIs $25k-50k, 2.0% for AGIs $50k-75k, 1.4% for AGIs $75k-100k, 3.1% for AGIs over 100k)
IRA payment deduction: $2,789 (reported on 2.6% of returns)
14612:
$2,789
New York:
$3,115
(% of AGI for various income ranges: 0.2% for AGIs below $10k, 0.3% for AGIs $10k-25k, 0.3% for AGIs $25k-50k, 0.1% for AGIs $50k-75k, 0.1% for AGIs $75k-100k, 0.1% for AGIs over 100k)
Self-employed pension: $12,374 (reported on 0.8% of returns)
Here:
$12,374
New York:
$19,016
(% of AGI for various income ranges: 0.1% for AGIs $25k-50k, 0.1% for AGIs $50k-75k, 0.1% for AGIs $75k-100k, 0.5% for AGIs over 100k)
Total itemized deductions: $16,348 (22% of AGI, reported on 42.1% of returns)
Here:
$16,348
State:
$25,864
Here:
21.8% of AGI
State:
21.9% of AGI
(% of AGI for various income ranges: 11.0% for AGIs below $10k, 9.5% for AGIs $10k-25k, 13.4% for AGIs $25k-50k, 16.3% for AGIs $50k-75k, 17.4% for AGIs $75k-100k, 16.3% for AGIs over 100k)
Charity contributions deductions: $2,347 (3% of AGI, reported on 39.3% of returns)
Here:
$2,347
State:
$4,439
Here:
3.1% of AGI
State:
3.6% of AGI
(% of AGI for various income ranges: 0.5% for AGIs below $10k, 0.9% for AGIs $10k-25k, 1.6% for AGIs $25k-50k, 2.1% for AGIs $50k-75k, 2.3% for AGIs $75k-100k, 2.5% for AGIs over 100k)
Total tax: $5,785 (reported on 79.2% of returns)
14612:
$5,785
State:
$11,730
(% of AGI for various income ranges: 2.6% for AGIs below $10k, 4.4% for AGIs $10k-25k, 7.5% for AGIs $25k-50k, 8.8% for AGIs $50k-75k, 9.8% for AGIs $75k-100k, 15.6% for AGIs over 100k)
Earned income credit: $1,481 (reported on 9.3% of returns)
Here:
$1,481
State:
$1,757
Percentage of individuals using paid preparers for their 2004 taxes: 58.5%
Here:
59%
State:
67%
(% for various income ranges: 48.1% for AGIs below $10k, 60.4% for AGIs $10k-25k, 59.8% for AGIs $25k-50k, 63.7% for AGIs $50k-75k, 60.2% for AGIs $75k-100k, 62.4% for AGIs over 100k)
Likely homosexual households (counted as self-reported same-sex unmarried-partner households)
Lesbian couples: 0.1% of all households
Gay men: 0.1% of all households
Household received Food Stamps/SNAP in the past 12 months: 2,211 Household did not receive Food Stamps/SNAP in the past 12 months: 13,415
Women who had a birth in the past 12 months: 365 (179 now married, 189 unmarried) Women who did not have a birth in the past 12 months: 7,259 (2,975 now married, 4,267 unmarried)
Housing units in zip code 14612 with a mortgage: 6,947 (1,320 second mortgage, 1,277 both second mortgage and home equity loan) Houses without a mortgage: 593
Median monthly owner costs for units with a mortgage: $1,526 Median monthly owner costs for units without a mortgage: $729
Residents with income below the poverty level in 2022:
This zip code:
8.4%
Whole state:
14.3%
Residents with income below 50% of the poverty level in 2022:
This zip code:
3.8%
Whole state:
6.8%
Median number of rooms in houses and condos:
Here:
6.4
State:
6.3
Median number of rooms in apartments:
Here:
3.9
State:
3.8
Notable locations in this zip code not listed on our city pages
Notable locations in zip code 14612: Charlotte Yacht Club (A), Ontario Beach Park (B), Shore Acres Golf Course (C), Genesee Dock (D), Latta Lea Par 3 Golf Course (E), Lakeshore Country Club (F), Cutter Farms (G), Riverview Yacht Basin (H), Pelican River Marina (I), Edna Tina Wilson Living Center (J), Latta Road Nursing Home (K), The Shore Winds (L), Greece Senior and Community Center (M), Greece Public Library (N), Charlotte Lighthouse (O), Greece History Center and Museum (P), Town of Greece Courthouse (Q), Greece Town Hall (R), Rochester Fire Department Engine 19 (S), Charlotte Lake River Homes (T). Display/hide their locations on the map
Shopping Centers: Shoremont Plaza Shopping Center (1), Parkway Commons Shopping Center (2), Country Side Corners Shopping Center (3). Display/hide their locations on the map
Churches in zip code 14612 include: Saint Marks Church (A), Trinity Church (B), Lakeview Community Church (C), Calvary Chapel of Greece (D), Christian Community Church (E), Tabernacle of Joyful Praise (F), Greece Assembly of God Church (G), Holy Cross Church (H), Islamic Association Masjid (I). Display/hide their locations on the map
Cemeteries: Riverside Cemetery (1), Beth Hamedresh Hagodel Cemetery (2), Charlotte Cemetery (3), Holy Sepulchre Cemetery (4). Display/hide their locations on the map
Creeks: Paddy Hill Creek (A), Slater Creek (B), Smith Creek (C), Fleming Creek (D), Round Pond Creek (E), Buttonwood Creek (F), Northrup Creek (G), Larkin Creek (H), Kirk Creek (I). Display/hide their locations on the map
4,093 married couples with children.
1,913 single-parent households (695 men, 1,218 women).
91.6% of residents of 14612 zip code speak English at home.
3.5% of residents speak Spanish at home (86% very well, 8% well, 6% not well).
2.9% of residents speak other Indo-European language at home (48% very well, 29% well, 23% not well).
0.9% of residents speak Asian or Pacific Island language at home (43% very well, 31% well, 26% not well).
1.1% of residents speak other language at home (59% very well, 41% well).
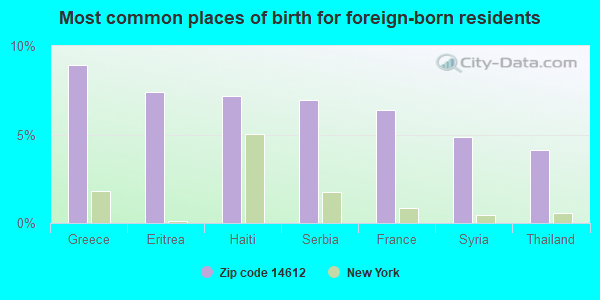
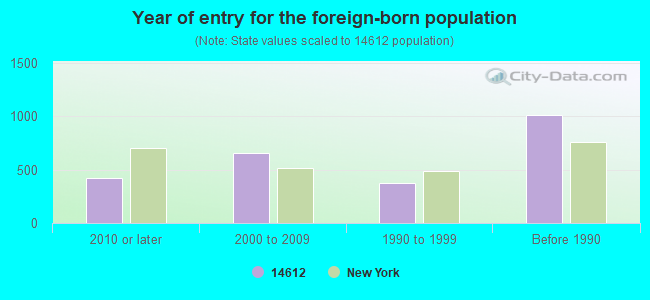
Foreign born population: 1,986 (5.7%) (76.2% of them are naturalized citizens)
Major facilities with environmental interests located in this zip code:
GREECE CTL SCH/ADMIN BLDG & GRD BUS (1790 LATTA RD in ROCHESTER, NY)
(Integrated Compliance Information System) - ICIS-02-2005-0877, ENFORCEMENT/COMPLIANCE ACTIVITY FORMAL ENFORCEMENT ACTION (Integrated Compliance Information System) - ICIS-02-2005-0877, ENFORCEMENT/COMPLIANCE ACTIVITY COMPLIANCE ACTIVITY (Tracking inspections of insecticide, fungicide, and rodenticide, and toxic substances) (Resource Conservation and Recovery Act (tracking hazardous waste)) Alternative names: GREECE CENTRAL SCHOOL DISTRICT
4800 DEWEY ENTERPRISE INC (4800 DEWEY AVENUE in ROCHESTER, NY)
Small Quantity Generators, between 100 kg and 1000 kg of hazardous waste/month (Resource Conservation and Recovery Act (tracking hazardous waste)) - notification - ICIS-, ENFORCEMENT/COMPLIANCE ACTIVITY
ARCADIA MS (130 ISLND COTTAGE RD in ROCHESTER, NY)
(National Center for Education Statistics) - STATE ID-260501060023 Organizations: GREECE CSD (SCHOOL DISTRICT)
GREECE ARCADIA HS ( in ROCHESTER, NY)
(National Center for Education Statistics) - STATE ID-260501060010 Organizations: GREECE CSD (SCHOOL DISTRICT)
GREECE-ATHENA HS ( in ROCHESTER, NY)
(National Center for Education Statistics) - STATE ID-260501060019 Organizations: GREECE CSD (SCHOOL DISTRICT)
GREECE-ATHENA MS ( in ROCHESTER, NY)
(National Center for Education Statistics) - STATE ID-260501060020 Organizations: GREECE CSD (SCHOOL DISTRICT)
CSX TRANSPORTATION INC (RIVER ST & LATTA RD in ROCHESTER, NY)
Large Quantity Generators, more that 1000 kg of hazardous waste/month (Resource Conservation and Recovery Act (tracking hazardous waste)) - notification Alternative names: C S X TRANSPORTATION INC
ANDROS MFG CORP (30 HOJACK PK in ROCHESTER, NY)
(Resource Conservation and Recovery Act (tracking hazardous waste)) Organizations: FRED STEENHOFF (CONTACT/OPERATOR)
ENFORCEMENT/COMPLIANCE ACTIVITY (Integrated Compliance Information System) Small Quantity Generators, between 100 kg and 1000 kg of hazardous waste/month (Resource Conservation and Recovery Act (tracking hazardous waste)) - notification Organizations: THE SOUTHLAND CORP (CONTACT/OWNER)
Alternative names: 7-ELEVEN 21412
ARCADIA HIGH SCHOOL (120 ISLAND COTTAGE RD in ROCHESTER, NY)
(Resource Conservation and Recovery Act (tracking hazardous waste))
GREECE LUMBER & BUILDING SUPPLY (427 LATTA RD in ROCHESTER, NY)
(Resource Conservation and Recovery Act (tracking hazardous waste))
Housing units lacking complete plumbing facilities: 0.5% Housing units lacking complete kitchen facilities: 1.2%
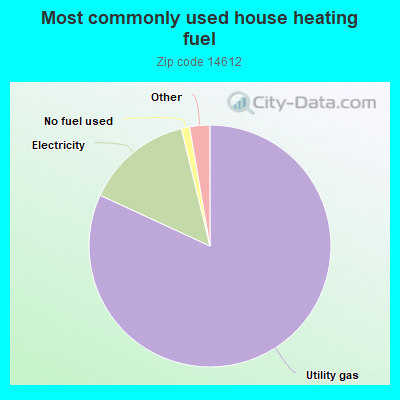
81.9%Utility gas
14.3%Electricity
1.1%No fuel used
0.9%Other fuel
0.7%Bottled, tank, or LP gas
0.5%Wood
Population in 1990: 35,820.
Place of birth for U.S.-born residents:
This state: 28,593
Northeast: 1,464
Midwest: 577
South: 1,108
West: 352
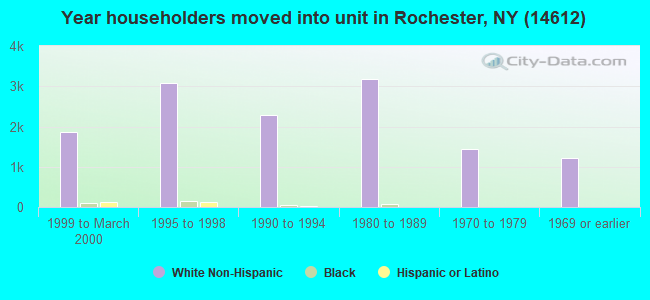
65% of the 14612 zip code residents lived in the same house 5 years ago. Out of people who lived in different houses, 82% lived in this county. Out of people who lived in different counties, 50% lived in New York.
89% of the 14612 zip code residents lived in the same house 1 year ago. Out of people who lived in different houses, 77% moved from this county. Out of people who lived in different houses, 7% moved from different county within same state. Out of people who lived in different houses, 14% moved from different state. Out of people who lived in different houses, 1% moved from abroad.
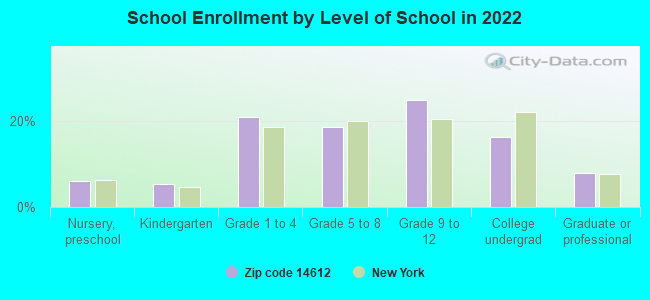
Private vs. public school enrollment:
Students in private schools in grades 1 to 8 (elementary and middle school): 584
Here:
21.4%
New York:
15.6%
Students in private schools in grades 9 to 12 (high school): 295
Here:
17.1%
New York:
15.0%
Students in private undergraduate colleges: 268
Here:
23.9%
New York:
39.2%
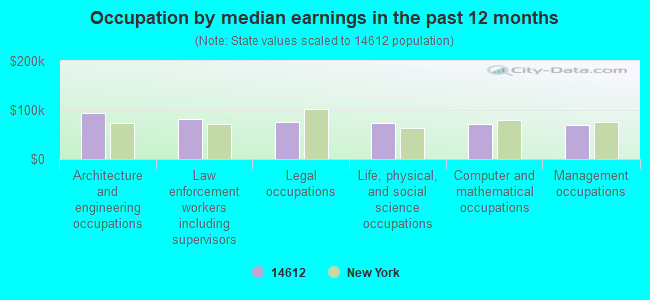
Occupation by median earnings in the past 12 months ($)
93,038Architecture and engineering occupations
82,591Law enforcement workers including supervisors
75,327Legal occupations
73,256Life, physical, and social science occupations
72,335Computer and mathematical occupations
70,069Management occupations
Companies with federal contracts located in this zip code:
N Y STATE PAINTING, INC (88 PEARSON LN in ROCHESTER, NY; small business)
$3,790 with Navy for Maintenance, Repair or Alteration of Real Property -- Other Administrative Facilities and Service Buildings. Signed on 2001-09-28. Completion date: 2001-11-07.
FOREST HILL RESTAURANT AND CAT (41 EAST MANITOU RD in ROCHESTER, NY; small business)
$3,528 with Army for Food Services. Signed on 2003-12-11. Completion date: 2003-12-08.
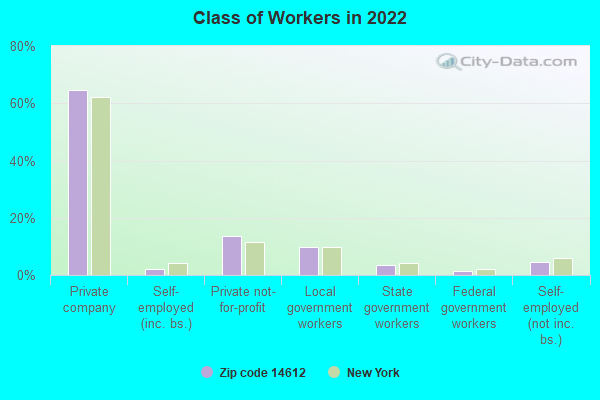
Top industries in this zip code by the number of employees in 2005:
Health Care and Social Assistance: Nursing Care Facilities (250-499 employees: 1 establishment, 100-249 employees: 1 establishment, 50-99 employees: 1 establishment, 20-49 employees: 1 establishment)
2002 - 2018 National Fire Incident Reporting System (NFIRS) incidents
Based on the data from the years 2002 - 2018 the average number of fire incidents per year is 104. The highest number of fires - 191 took place in 2016, and the least - 35 in 2010. The data has a rising trend.
When looking into fire subcategories, the most incidents belonged to: Structure Fires (44.9%), and Outside Fires (41.5%).
Fire incident types reported to NFIRS in Zip Code 14612

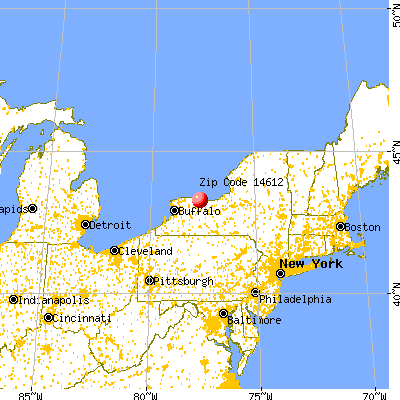


 Nearest zip codes: 14616, 14626, 14615, 14613, 14617, 14606.


 Based on the data from the years 2002 - 2018 the average number of fire incidents per year is 104. The highest number of fires - 191 took place in 2016, and the least - 35 in 2010. The data has a rising trend.
 When looking into fire subcategories, the most incidents belonged to: Structure Fires (44.9%), and Outside Fires (41.5%).