Estimated zip code population in 2022: 26,817
Zip code population in 2010: 28,534
Zip code population in 2000: 27,119
Houses and condos: 12,319
Renter-occupied apartments: 3,568
% of renters here:
30%State:
46%
March 2022 cost of living index in zip code 14616: 102.0
(near average, U.S. average is 100)
Land area: 5.9
sq. mi.
Water area: 0.0
sq. mi.
Population density: 4,513 people per square mile (average).
OSM Map
General Map
Google Map
MSN Map
OSM Map
General Map
Google Map
MSN Map
OSM Map
General Map
Google Map
MSN Map
OSM Map
General Map
Google Map
MSN Map
Please wait while loading the map...
Real estate property taxes paid for housing units in 2022:
This zip code:
2.9% ($3,987)New York:
1.5% ($6,180)
Median real estate property taxes paid for housing units with mortgages in 2022: $4,128 (3.0%)
Median real estate property taxes paid for housing units with no mortgage in 2022: $3,614 (2.7%)
Profiles of local businesses
Business Search - 14 Million verified businesses
Males: 12,541 Females: 14,275
For population 25 years and over in 14616:
High school or higher: 90.9%Bachelor's degree or higher: 24.4%Graduate or professional degree: 6.8%Unemployed: 4.8%Mean travel time to work (commute): 20.3 minutes
For population 15 years and over in 14616:
Never married: 37.3%Now married: 40.4%Separated: 2.6%Widowed: 6.2%Divorced: 13.5%
Zip code 14616 compared to state average:
Median house value significantly below state average. Foreign-born population percentage significantly below state average. Renting percentage below state average. Percentage of population with a bachelor's degree or higher below state average. 18,322 68.3% White 3,309 12.3% Black 3,301 12.3% Hispanic or Latino 1,125 4.2% Two or more races 685 2.6% Asian 63 0.2% Some other race 7 0.03% American Indian
Data:
Median household income ($)
Median household income (% change since 2000)
Household income diversity
Ratio of average income to average house value (%)
Ratio of average income to average rent
Median household income ($) - White
Median household income ($) - Black or African American
Median household income ($) - Asian
Median household income ($) - Hispanic or Latino
Median household income ($) - American Indian and Alaska Native
Median household income ($) - Multirace
Median household income ($) - Other Race
Median household income for houses/condos with a mortgage ($)
Median household income for apartments without a mortgage ($)
Races - White alone (%)
Races - White alone (% change since 2000)
Races - Black alone (%)
Races - Black alone (% change since 2000)
Races - American Indian alone (%)
Races - American Indian alone (% change since 2000)
Races - Asian alone (%)
Races - Asian alone (% change since 2000)
Races - Hispanic (%)
Races - Hispanic (% change since 2000)
Races - Native Hawaiian and Other Pacific Islander alone (%)
Races - Native Hawaiian and Other Pacific Islander alone (% change since 2000)
Races - Two or more races (%)
Races - Two or more races (% change since 2000)
Races - Other race alone (%)
Races - Other race alone (% change since 2000)
Racial diversity
Unemployment (%)
Unemployment (% change since 2000)
Unemployment (%) - White
Unemployment (%) - Black or African American
Unemployment (%) - Asian
Unemployment (%) - Hispanic or Latino
Unemployment (%) - American Indian and Alaska Native
Unemployment (%) - Multirace
Unemployment (%) - Other Race
Population density (people per square mile)
Population - Males (%)
Population - Females (%)
Population - Males (%) - White
Population - Males (%) - Black or African American
Population - Males (%) - Asian
Population - Males (%) - Hispanic or Latino
Population - Males (%) - American Indian and Alaska Native
Population - Males (%) - Multirace
Population - Males (%) - Other Race
Population - Females (%) - White
Population - Females (%) - Black or African American
Population - Females (%) - Asian
Population - Females (%) - Hispanic or Latino
Population - Females (%) - American Indian and Alaska Native
Population - Females (%) - Multirace
Population - Females (%) - Other Race
Coronavirus confirmed cases (Apr 27, 2024)
Deaths caused by coronavirus (Apr 27, 2024)
Coronavirus confirmed cases (per 100k population) (Apr 27, 2024)
Deaths caused by coronavirus (per 100k population) (Apr 27, 2024)
Daily increase in number of cases (Apr 27, 2024)
Weekly increase in number of cases (Apr 27, 2024)
Cases doubled (in days) (Apr 27, 2024)
Hospitalized patients (Apr 18, 2022)
Negative test results (Apr 18, 2022)
Total test results (Apr 18, 2022)
COVID Vaccine doses distributed (per 100k population) (Sep 19, 2023)
COVID Vaccine doses administered (per 100k population) (Sep 19, 2023)
COVID Vaccine doses distributed (Sep 19, 2023)
COVID Vaccine doses administered (Sep 19, 2023)
Likely homosexual households (%)
Likely homosexual households (% change since 2000)
Likely homosexual households - Lesbian couples (%)
Likely homosexual households - Lesbian couples (% change since 2000)
Likely homosexual households - Gay men (%)
Likely homosexual households - Gay men (% change since 2000)
Cost of living index
Median gross rent ($)
Median contract rent ($)
Median monthly housing costs ($)
Median house or condo value ($)
Median house or condo value ($ change since 2000)
Mean house or condo value by units in structure - 1, detached ($)
Mean house or condo value by units in structure - 1, attached ($)
Mean house or condo value by units in structure - 2 ($)
Mean house or condo value by units in structure by units in structure - 3 or 4 ($)
Mean house or condo value by units in structure - 5 or more ($)
Mean house or condo value by units in structure - Boat, RV, van, etc. ($)
Mean house or condo value by units in structure - Mobile home ($)
Median house or condo value ($) - White
Median house or condo value ($) - Black or African American
Median house or condo value ($) - Asian
Median house or condo value ($) - Hispanic or Latino
Median house or condo value ($) - American Indian and Alaska Native
Median house or condo value ($) - Multirace
Median house or condo value ($) - Other Race
Median resident age
Resident age diversity
Median resident age - Males
Median resident age - Females
Median resident age - White
Median resident age - Black or African American
Median resident age - Asian
Median resident age - Hispanic or Latino
Median resident age - American Indian and Alaska Native
Median resident age - Multirace
Median resident age - Other Race
Median resident age - Males - White
Median resident age - Males - Black or African American
Median resident age - Males - Asian
Median resident age - Males - Hispanic or Latino
Median resident age - Males - American Indian and Alaska Native
Median resident age - Males - Multirace
Median resident age - Males - Other Race
Median resident age - Females - White
Median resident age - Females - Black or African American
Median resident age - Females - Asian
Median resident age - Females - Hispanic or Latino
Median resident age - Females - American Indian and Alaska Native
Median resident age - Females - Multirace
Median resident age - Females - Other Race
Commute - mean travel time to work (minutes)
Travel time to work - Less than 5 minutes (%)
Travel time to work - Less than 5 minutes (% change since 2000)
Travel time to work - 5 to 9 minutes (%)
Travel time to work - 5 to 9 minutes (% change since 2000)
Travel time to work - 10 to 19 minutes (%)
Travel time to work - 10 to 19 minutes (% change since 2000)
Travel time to work - 20 to 29 minutes (%)
Travel time to work - 20 to 29 minutes (% change since 2000)
Travel time to work - 30 to 39 minutes (%)
Travel time to work - 30 to 39 minutes (% change since 2000)
Travel time to work - 40 to 59 minutes (%)
Travel time to work - 40 to 59 minutes (% change since 2000)
Travel time to work - 60 to 89 minutes (%)
Travel time to work - 60 to 89 minutes (% change since 2000)
Travel time to work - 90 or more minutes (%)
Travel time to work - 90 or more minutes (% change since 2000)
Marital status - Never married (%)
Marital status - Now married (%)
Marital status - Separated (%)
Marital status - Widowed (%)
Marital status - Divorced (%)
Median family income ($)
Median family income (% change since 2000)
Median non-family income ($)
Median non-family income (% change since 2000)
Median per capita income ($)
Median per capita income (% change since 2000)
Median family income ($) - White
Median family income ($) - Black or African American
Median family income ($) - Asian
Median family income ($) - Hispanic or Latino
Median family income ($) - American Indian and Alaska Native
Median family income ($) - Multirace
Median family income ($) - Other Race
Median year house/condo built
Median year apartment built
Year house built - Built 2005 or later (%)
Year house built - Built 2000 to 2004 (%)
Year house built - Built 1990 to 1999 (%)
Year house built - Built 1980 to 1989 (%)
Year house built - Built 1970 to 1979 (%)
Year house built - Built 1960 to 1969 (%)
Year house built - Built 1950 to 1959 (%)
Year house built - Built 1940 to 1949 (%)
Year house built - Built 1939 or earlier (%)
Average household size
Household density (households per square mile)
Average household size - White
Average household size - Black or African American
Average household size - Asian
Average household size - Hispanic or Latino
Average household size - American Indian and Alaska Native
Average household size - Multirace
Average household size - Other Race
Occupied housing units (%)
Vacant housing units (%)
Owner occupied housing units (%)
Renter occupied housing units (%)
Vacancy status - For rent (%)
Vacancy status - For sale only (%)
Vacancy status - Rented or sold, not occupied (%)
Vacancy status - For seasonal, recreational, or occasional use (%)
Vacancy status - For migrant workers (%)
Vacancy status - Other vacant (%)
Residents with income below the poverty level (%)
Residents with income below 50% of the poverty level (%)
Children below poverty level (%)
Poor families by family type - Married-couple family (%)
Poor families by family type - Male, no wife present (%)
Poor families by family type - Female, no husband present (%)
Poverty status for native-born residents (%)
Poverty status for foreign-born residents (%)
Poverty among high school graduates not in families (%)
Poverty among people who did not graduate high school not in families (%)
Residents with income below the poverty level (%) - White
Residents with income below the poverty level (%) - Black or African American
Residents with income below the poverty level (%) - Asian
Residents with income below the poverty level (%) - Hispanic or Latino
Residents with income below the poverty level (%) - American Indian and Alaska Native
Residents with income below the poverty level (%) - Multirace
Residents with income below the poverty level (%) - Other Race
Air pollution - Air Quality Index (AQI)
Air pollution - CO
Air pollution - NO2
Air pollution - SO2
Air pollution - Ozone
Air pollution - PM10
Air pollution - PM25
Air pollution - Pb
Crime - Murders per 100,000 population
Crime - Rapes per 100,000 population
Crime - Robberies per 100,000 population
Crime - Assaults per 100,000 population
Crime - Burglaries per 100,000 population
Crime - Thefts per 100,000 population
Crime - Auto thefts per 100,000 population
Crime - Arson per 100,000 population
Crime - City-data.com crime index
Crime - Violent crime index
Crime - Property crime index
Crime - Murders per 100,000 population (5 year average)
Crime - Rapes per 100,000 population (5 year average)
Crime - Robberies per 100,000 population (5 year average)
Crime - Assaults per 100,000 population (5 year average)
Crime - Burglaries per 100,000 population (5 year average)
Crime - Thefts per 100,000 population (5 year average)
Crime - Auto thefts per 100,000 population (5 year average)
Crime - Arson per 100,000 population (5 year average)
Crime - City-data.com crime index (5 year average)
Crime - Violent crime index (5 year average)
Crime - Property crime index (5 year average)
1996 Presidential Elections Results (%) - Democratic Party (Clinton)
1996 Presidential Elections Results (%) - Republican Party (Dole)
1996 Presidential Elections Results (%) - Other
2000 Presidential Elections Results (%) - Democratic Party (Gore)
2000 Presidential Elections Results (%) - Republican Party (Bush)
2000 Presidential Elections Results (%) - Other
2004 Presidential Elections Results (%) - Democratic Party (Kerry)
2004 Presidential Elections Results (%) - Republican Party (Bush)
2004 Presidential Elections Results (%) - Other
2008 Presidential Elections Results (%) - Democratic Party (Obama)
2008 Presidential Elections Results (%) - Republican Party (McCain)
2008 Presidential Elections Results (%) - Other
2012 Presidential Elections Results (%) - Democratic Party (Obama)
2012 Presidential Elections Results (%) - Republican Party (Romney)
2012 Presidential Elections Results (%) - Other
2016 Presidential Elections Results (%) - Democratic Party (Clinton)
2016 Presidential Elections Results (%) - Republican Party (Trump)
2016 Presidential Elections Results (%) - Other
2020 Presidential Elections Results (%) - Democratic Party (Biden)
2020 Presidential Elections Results (%) - Republican Party (Trump)
2020 Presidential Elections Results (%) - Other
Ancestries Reported - Arab (%)
Ancestries Reported - Czech (%)
Ancestries Reported - Danish (%)
Ancestries Reported - Dutch (%)
Ancestries Reported - English (%)
Ancestries Reported - French (%)
Ancestries Reported - French Canadian (%)
Ancestries Reported - German (%)
Ancestries Reported - Greek (%)
Ancestries Reported - Hungarian (%)
Ancestries Reported - Irish (%)
Ancestries Reported - Italian (%)
Ancestries Reported - Lithuanian (%)
Ancestries Reported - Norwegian (%)
Ancestries Reported - Polish (%)
Ancestries Reported - Portuguese (%)
Ancestries Reported - Russian (%)
Ancestries Reported - Scotch-Irish (%)
Ancestries Reported - Scottish (%)
Ancestries Reported - Slovak (%)
Ancestries Reported - Subsaharan African (%)
Ancestries Reported - Swedish (%)
Ancestries Reported - Swiss (%)
Ancestries Reported - Ukrainian (%)
Ancestries Reported - United States (%)
Ancestries Reported - Welsh (%)
Ancestries Reported - West Indian (%)
Ancestries Reported - Other (%)
Educational Attainment - No schooling completed (%)
Educational Attainment - Less than high school (%)
Educational Attainment - High school or equivalent (%)
Educational Attainment - Less than 1 year of college (%)
Educational Attainment - 1 or more years of college (%)
Educational Attainment - Associate degree (%)
Educational Attainment - Bachelor's degree (%)
Educational Attainment - Master's degree (%)
Educational Attainment - Professional school degree (%)
Educational Attainment - Doctorate degree (%)
School Enrollment - Nursery, preschool (%)
School Enrollment - Kindergarten (%)
School Enrollment - Grade 1 to 4 (%)
School Enrollment - Grade 5 to 8 (%)
School Enrollment - Grade 9 to 12 (%)
School Enrollment - College undergrad (%)
School Enrollment - Graduate or professional (%)
School Enrollment - Not enrolled in school (%)
School enrollment - Public schools (%)
School enrollment - Private schools (%)
School enrollment - Not enrolled (%)
Median number of rooms in houses and condos
Median number of rooms in apartments
Housing units lacking complete plumbing facilities (%)
Housing units lacking complete kitchen facilities (%)
Density of houses
Urban houses (%)
Rural houses (%)
Households with people 60 years and over (%)
Households with people 65 years and over (%)
Households with people 75 years and over (%)
Households with one or more nonrelatives (%)
Households with no nonrelatives (%)
Population in households (%)
Family households (%)
Nonfamily households (%)
Population in families (%)
Family households with own children (%)
Median number of bedrooms in owner occupied houses
Mean number of bedrooms in owner occupied houses
Median number of bedrooms in renter occupied houses
Mean number of bedrooms in renter occupied houses
Median number of vehichles in owner occupied houses
Mean number of vehichles in owner occupied houses
Median number of vehichles in renter occupied houses
Mean number of vehichles in renter occupied houses
Mortgage status - with mortgage (%)
Mortgage status - with second mortgage (%)
Mortgage status - with home equity loan (%)
Mortgage status - with both second mortgage and home equity loan (%)
Mortgage status - without a mortgage (%)
Average family size
Average family size - White
Average family size - Black or African American
Average family size - Asian
Average family size - Hispanic or Latino
Average family size - American Indian and Alaska Native
Average family size - Multirace
Average family size - Other Race
Geographical mobility - Same house 1 year ago (%)
Geographical mobility - Moved within same county (%)
Geographical mobility - Moved from different county within same state (%)
Geographical mobility - Moved from different state (%)
Geographical mobility - Moved from abroad (%)
Place of birth - Born in state of residence (%)
Place of birth - Born in other state (%)
Place of birth - Native, outside of US (%)
Place of birth - Foreign born (%)
Housing units in structures - 1, detached (%)
Housing units in structures - 1, attached (%)
Housing units in structures - 2 (%)
Housing units in structures - 3 or 4 (%)
Housing units in structures - 5 to 9 (%)
Housing units in structures - 10 to 19 (%)
Housing units in structures - 20 to 49 (%)
Housing units in structures - 50 or more (%)
Housing units in structures - Mobile home (%)
Housing units in structures - Boat, RV, van, etc. (%)
House/condo owner moved in on average (years ago)
Renter moved in on average (years ago)
Year householder moved into unit - Moved in 1999 to March 2000 (%)
Year householder moved into unit - Moved in 1995 to 1998 (%)
Year householder moved into unit - Moved in 1990 to 1994 (%)
Year householder moved into unit - Moved in 1980 to 1989 (%)
Year householder moved into unit - Moved in 1970 to 1979 (%)
Year householder moved into unit - Moved in 1969 or earlier (%)
Means of transportation to work - Drove car alone (%)
Means of transportation to work - Carpooled (%)
Means of transportation to work - Public transportation (%)
Means of transportation to work - Bus or trolley bus (%)
Means of transportation to work - Streetcar or trolley car (%)
Means of transportation to work - Subway or elevated (%)
Means of transportation to work - Railroad (%)
Means of transportation to work - Ferryboat (%)
Means of transportation to work - Taxicab (%)
Means of transportation to work - Motorcycle (%)
Means of transportation to work - Bicycle (%)
Means of transportation to work - Walked (%)
Means of transportation to work - Other means (%)
Working at home (%)
Industry diversity
Most Common Industries - Agriculture, forestry, fishing and hunting, and mining (%)
Most Common Industries - Agriculture, forestry, fishing and hunting (%)
Most Common Industries - Mining, quarrying, and oil and gas extraction (%)
Most Common Industries - Construction (%)
Most Common Industries - Manufacturing (%)
Most Common Industries - Wholesale trade (%)
Most Common Industries - Retail trade (%)
Most Common Industries - Transportation and warehousing, and utilities (%)
Most Common Industries - Transportation and warehousing (%)
Most Common Industries - Utilities (%)
Most Common Industries - Information (%)
Most Common Industries - Finance and insurance, and real estate and rental and leasing (%)
Most Common Industries - Finance and insurance (%)
Most Common Industries - Real estate and rental and leasing (%)
Most Common Industries - Professional, scientific, and management, and administrative and waste management services (%)
Most Common Industries - Professional, scientific, and technical services (%)
Most Common Industries - Management of companies and enterprises (%)
Most Common Industries - Administrative and support and waste management services (%)
Most Common Industries - Educational services, and health care and social assistance (%)
Most Common Industries - Educational services (%)
Most Common Industries - Health care and social assistance (%)
Most Common Industries - Arts, entertainment, and recreation, and accommodation and food services (%)
Most Common Industries - Arts, entertainment, and recreation (%)
Most Common Industries - Accommodation and food services (%)
Most Common Industries - Other services, except public administration (%)
Most Common Industries - Public administration (%)
Occupation diversity
Most Common Occupations - Management, business, science, and arts occupations (%)
Most Common Occupations - Management, business, and financial occupations (%)
Most Common Occupations - Management occupations (%)
Most Common Occupations - Business and financial operations occupations (%)
Most Common Occupations - Computer, engineering, and science occupations (%)
Most Common Occupations - Computer and mathematical occupations (%)
Most Common Occupations - Architecture and engineering occupations (%)
Most Common Occupations - Life, physical, and social science occupations (%)
Most Common Occupations - Education, legal, community service, arts, and media occupations (%)
Most Common Occupations - Community and social service occupations (%)
Most Common Occupations - Legal occupations (%)
Most Common Occupations - Education, training, and library occupations (%)
Most Common Occupations - Arts, design, entertainment, sports, and media occupations (%)
Most Common Occupations - Healthcare practitioners and technical occupations (%)
Most Common Occupations - Health diagnosing and treating practitioners and other technical occupations (%)
Most Common Occupations - Health technologists and technicians (%)
Most Common Occupations - Service occupations (%)
Most Common Occupations - Healthcare support occupations (%)
Most Common Occupations - Protective service occupations (%)
Most Common Occupations - Fire fighting and prevention, and other protective service workers including supervisors (%)
Most Common Occupations - Law enforcement workers including supervisors (%)
Most Common Occupations - Food preparation and serving related occupations (%)
Most Common Occupations - Building and grounds cleaning and maintenance occupations (%)
Most Common Occupations - Personal care and service occupations (%)
Most Common Occupations - Sales and office occupations (%)
Most Common Occupations - Sales and related occupations (%)
Most Common Occupations - Office and administrative support occupations (%)
Most Common Occupations - Natural resources, construction, and maintenance occupations (%)
Most Common Occupations - Farming, fishing, and forestry occupations (%)
Most Common Occupations - Construction and extraction occupations (%)
Most Common Occupations - Installation, maintenance, and repair occupations (%)
Most Common Occupations - Production, transportation, and material moving occupations (%)
Most Common Occupations - Production occupations (%)
Most Common Occupations - Transportation occupations (%)
Most Common Occupations - Material moving occupations (%)
People in Group quarters - Institutionalized population (%)
People in Group quarters - Correctional institutions (%)
People in Group quarters - Federal prisons and detention centers (%)
People in Group quarters - Halfway houses (%)
People in Group quarters - Local jails and other confinement facilities (including police lockups) (%)
People in Group quarters - Military disciplinary barracks (%)
People in Group quarters - State prisons (%)
People in Group quarters - Other types of correctional institutions (%)
People in Group quarters - Nursing homes (%)
People in Group quarters - Hospitals/wards, hospices, and schools for the handicapped (%)
People in Group quarters - Hospitals/wards and hospices for chronically ill (%)
People in Group quarters - Hospices or homes for chronically ill (%)
People in Group quarters - Military hospitals or wards for chronically ill (%)
People in Group quarters - Other hospitals or wards for chronically ill (%)
People in Group quarters - Hospitals or wards for drug/alcohol abuse (%)
People in Group quarters - Mental (Psychiatric) hospitals or wards (%)
People in Group quarters - Schools, hospitals, or wards for the mentally retarded (%)
People in Group quarters - Schools, hospitals, or wards for the physically handicapped (%)
People in Group quarters - Institutions for the deaf (%)
People in Group quarters - Institutions for the blind (%)
People in Group quarters - Orthopedic wards and institutions for the physically handicapped (%)
People in Group quarters - Wards in general hospitals for patients who have no usual home elsewhere (%)
People in Group quarters - Wards in military hospitals for patients who have no usual home elsewhere (%)
People in Group quarters - Juvenile institutions (%)
People in Group quarters - Long-term care (%)
People in Group quarters - Homes for abused, dependent, and neglected children (%)
People in Group quarters - Residential treatment centers for emotionally disturbed children (%)
People in Group quarters - Training schools for juvenile delinquents (%)
People in Group quarters - Short-term care, detention or diagnostic centers for delinquent children (%)
People in Group quarters - Type of juvenile institution unknown (%)
People in Group quarters - Noninstitutionalized population (%)
People in Group quarters - College dormitories (includes college quarters off campus) (%)
People in Group quarters - Military quarters (%)
People in Group quarters - On base (%)
People in Group quarters - Barracks, unaccompanied personnel housing (UPH), (Enlisted/Officer), ;and similar group living quarters for military personnel (%)
People in Group quarters - Transient quarters for temporary residents (%)
People in Group quarters - Military ships (%)
People in Group quarters - Group homes (%)
People in Group quarters - Homes or halfway houses for drug/alcohol abuse (%)
People in Group quarters - Homes for the mentally ill (%)
People in Group quarters - Homes for the mentally retarded (%)
People in Group quarters - Homes for the physically handicapped (%)
People in Group quarters - Other group homes (%)
People in Group quarters - Religious group quarters (%)
People in Group quarters - Dormitories (%)
People in Group quarters - Agriculture workers' dormitories on farms (%)
People in Group quarters - Job Corps and vocational training facilities (%)
People in Group quarters - Other workers' dormitories (%)
People in Group quarters - Crews of maritime vessels (%)
People in Group quarters - Other nonhousehold living situations (%)
People in Group quarters - Other noninstitutional group quarters (%)
Residents speaking English at home (%)
Residents speaking English at home - Born in the United States (%)
Residents speaking English at home - Native, born elsewhere (%)
Residents speaking English at home - Foreign born (%)
Residents speaking Spanish at home (%)
Residents speaking Spanish at home - Born in the United States (%)
Residents speaking Spanish at home - Native, born elsewhere (%)
Residents speaking Spanish at home - Foreign born (%)
Residents speaking other language at home (%)
Residents speaking other language at home - Born in the United States (%)
Residents speaking other language at home - Native, born elsewhere (%)
Residents speaking other language at home - Foreign born (%)
Class of Workers - Employee of private company (%)
Class of Workers - Self-employed in own incorporated business (%)
Class of Workers - Private not-for-profit wage and salary workers (%)
Class of Workers - Local government workers (%)
Class of Workers - State government workers (%)
Class of Workers - Federal government workers (%)
Class of Workers - Self-employed workers in own not incorporated business and Unpaid family workers (%)
House heating fuel used in houses and condos - Utility gas (%)
House heating fuel used in houses and condos - Bottled, tank, or LP gas (%)
House heating fuel used in houses and condos - Electricity (%)
House heating fuel used in houses and condos - Fuel oil, kerosene, etc. (%)
House heating fuel used in houses and condos - Coal or coke (%)
House heating fuel used in houses and condos - Wood (%)
House heating fuel used in houses and condos - Solar energy (%)
House heating fuel used in houses and condos - Other fuel (%)
House heating fuel used in houses and condos - No fuel used (%)
House heating fuel used in apartments - Utility gas (%)
House heating fuel used in apartments - Bottled, tank, or LP gas (%)
House heating fuel used in apartments - Electricity (%)
House heating fuel used in apartments - Fuel oil, kerosene, etc. (%)
House heating fuel used in apartments - Coal or coke (%)
House heating fuel used in apartments - Wood (%)
House heating fuel used in apartments - Solar energy (%)
House heating fuel used in apartments - Other fuel (%)
House heating fuel used in apartments - No fuel used (%)
Armed forces status - In Armed Forces (%)
Armed forces status - Civilian (%)
Armed forces status - Civilian - Veteran (%)
Armed forces status - Civilian - Nonveteran (%)
Fatal accidents locations in years 2005-2021
Fatal accidents locations in 2005
Fatal accidents locations in 2006
Fatal accidents locations in 2007
Fatal accidents locations in 2008
Fatal accidents locations in 2009
Fatal accidents locations in 2010
Fatal accidents locations in 2011
Fatal accidents locations in 2012
Fatal accidents locations in 2013
Fatal accidents locations in 2014
Fatal accidents locations in 2015
Fatal accidents locations in 2016
Fatal accidents locations in 2017
Fatal accidents locations in 2018
Fatal accidents locations in 2019
Fatal accidents locations in 2020
Fatal accidents locations in 2021
Alcohol use - People drinking some alcohol every month (%)
Alcohol use - People not drinking at all (%)
Alcohol use - Average days/month drinking alcohol
Alcohol use - Average drinks/week
Alcohol use - Average days/year people drink much
Audiometry - Average condition of hearing (%)
Audiometry - People that can hear a whisper from across a quiet room (%)
Audiometry - People that can hear normal voice from across a quiet room (%)
Audiometry - Ears ringing, roaring, buzzing (%)
Audiometry - Had a job exposure to loud noise (%)
Audiometry - Had off-work exposure to loud noise (%)
Blood Pressure & Cholesterol - Has high blood pressure (%)
Blood Pressure & Cholesterol - Checking blood pressure at home (%)
Blood Pressure & Cholesterol - Frequently checking blood cholesterol (%)
Blood Pressure & Cholesterol - Has high cholesterol level (%)
Consumer Behavior - Money monthly spent on food at supermarket/grocery store
Consumer Behavior - Money monthly spent on food at other stores
Consumer Behavior - Money monthly spent on eating out
Consumer Behavior - Money monthly spent on carryout/delivered foods
Consumer Behavior - Income spent on food at supermarket/grocery store (%)
Consumer Behavior - Income spent on food at other stores (%)
Consumer Behavior - Income spent on eating out (%)
Consumer Behavior - Income spent on carryout/delivered foods (%)
Current Health Status - General health condition (%)
Current Health Status - Blood donors (%)
Current Health Status - Has blood ever tested for HIV virus (%)
Current Health Status - Left-handed people (%)
Dermatology - People using sunscreen (%)
Diabetes - Diabetics (%)
Diabetes - Had a blood test for high blood sugar (%)
Diabetes - People taking insulin (%)
Diet Behavior & Nutrition - Diet health (%)
Diet Behavior & Nutrition - Milk product consumption (# of products/month)
Diet Behavior & Nutrition - Meals not home prepared (#/week)
Diet Behavior & Nutrition - Meals from fast food or pizza place (#/week)
Diet Behavior & Nutrition - Ready-to-eat foods (#/month)
Diet Behavior & Nutrition - Frozen meals/pizza (#/month)
Drug Use - People that ever used marijuana or hashish (%)
Drug Use - Ever used hard drugs (%)
Drug Use - Ever used any form of cocaine (%)
Drug Use - Ever used heroin (%)
Drug Use - Ever used methamphetamine (%)
Health Insurance - People covered by health insurance (%)
Kidney Conditions-Urology - Avg. # of times urinating at night
Medical Conditions - People with asthma (%)
Medical Conditions - People with anemia (%)
Medical Conditions - People with psoriasis (%)
Medical Conditions - People with overweight (%)
Medical Conditions - Elderly people having difficulties in thinking or remembering (%)
Medical Conditions - People who ever received blood transfusion (%)
Medical Conditions - People having trouble seeing even with glass/contacts (%)
Medical Conditions - People with arthritis (%)
Medical Conditions - People with gout (%)
Medical Conditions - People with congestive heart failure (%)
Medical Conditions - People with coronary heart disease (%)
Medical Conditions - People with angina pectoris (%)
Medical Conditions - People who ever had heart attack (%)
Medical Conditions - People who ever had stroke (%)
Medical Conditions - People with emphysema (%)
Medical Conditions - People with thyroid problem (%)
Medical Conditions - People with chronic bronchitis (%)
Medical Conditions - People with any liver condition (%)
Medical Conditions - People who ever had cancer or malignancy (%)
Mental Health - People who have little interest in doing things (%)
Mental Health - People feeling down, depressed, or hopeless (%)
Mental Health - People who have trouble sleeping or sleeping too much (%)
Mental Health - People feeling tired or having little energy (%)
Mental Health - People with poor appetite or overeating (%)
Mental Health - People feeling bad about themself (%)
Mental Health - People who have trouble concentrating on things (%)
Mental Health - People moving or speaking slowly or too fast (%)
Mental Health - People having thoughts they would be better off dead (%)
Oral Health - Average years since last visit a dentist
Oral Health - People embarrassed because of mouth (%)
Oral Health - People with gum disease (%)
Oral Health - General health of teeth and gums (%)
Oral Health - Average days a week using dental floss/device
Oral Health - Average days a week using mouthwash for dental problem
Oral Health - Average number of teeth
Pesticide Use - Households using pesticides to control insects (%)
Pesticide Use - Households using pesticides to kill weeds (%)
Physical Activity - People doing vigorous-intensity work activities (%)
Physical Activity - People doing moderate-intensity work activities (%)
Physical Activity - People walking or bicycling (%)
Physical Activity - People doing vigorous-intensity recreational activities (%)
Physical Activity - People doing moderate-intensity recreational activities (%)
Physical Activity - Average hours a day doing sedentary activities
Physical Activity - Average hours a day watching TV or videos
Physical Activity - Average hours a day using computer
Physical Functioning - People having limitations keeping them from working (%)
Physical Functioning - People limited in amount of work they can do (%)
Physical Functioning - People that need special equipment to walk (%)
Physical Functioning - People experiencing confusion/memory problems (%)
Physical Functioning - People requiring special healthcare equipment (%)
Prescription Medications - Average number of prescription medicines taking
Preventive Aspirin Use - Adults 40+ taking low-dose aspirin (%)
Reproductive Health - Vaginal deliveries (%)
Reproductive Health - Cesarean deliveries (%)
Reproductive Health - Deliveries resulted in a live birth (%)
Reproductive Health - Pregnancies resulted in a delivery (%)
Reproductive Health - Women breastfeeding newborns (%)
Reproductive Health - Women that had a hysterectomy (%)
Reproductive Health - Women that had both ovaries removed (%)
Reproductive Health - Women that have ever taken birth control pills (%)
Reproductive Health - Women taking birth control pills (%)
Reproductive Health - Women that have ever used Depo-Provera or injectables (%)
Reproductive Health - Women that have ever used female hormones (%)
Sexual Behavior - People 18+ that ever had sex (vaginal, anal, or oral) (%)
Sexual Behavior - Males 18+ that ever had vaginal sex with a woman (%)
Sexual Behavior - Males 18+ that ever performed oral sex on a woman (%)
Sexual Behavior - Males 18+ that ever had anal sex with a woman (%)
Sexual Behavior - Males 18+ that ever had any sex with a man (%)
Sexual Behavior - Females 18+ that ever had vaginal sex with a man (%)
Sexual Behavior - Females 18+ that ever performed oral sex on a man (%)
Sexual Behavior - Females 18+ that ever had anal sex with a man (%)
Sexual Behavior - Females 18+ that ever had any kind of sex with a woman (%)
Sexual Behavior - Average age people first had sex
Sexual Behavior - Average number of female sex partners in lifetime (males 18+)
Sexual Behavior - Average number of female vaginal sex partners in lifetime (males 18+)
Sexual Behavior - Average age people first performed oral sex on a woman (18+)
Sexual Behavior - Average number of woman performed oral sex on in lifetime (18+)
Sexual Behavior - Average number of male sex partners in lifetime (males 18+)
Sexual Behavior - Average number of male anal sex partners in lifetime (males 18+)
Sexual Behavior - Average age people first performed oral sex on a man (18+)
Sexual Behavior - Average number of male oral sex partners in lifetime (18+)
Sexual Behavior - People using protection when performing oral sex (%)
Sexual Behavior - Average number of times people have vaginal or anal sex a year
Sexual Behavior - People having sex without condom (%)
Sexual Behavior - Average number of male sex partners in lifetime (females 18+)
Sexual Behavior - Average number of male vaginal sex partners in lifetime (females 18+)
Sexual Behavior - Average number of female sex partners in lifetime (females 18+)
Sexual Behavior - Circumcised males 18+ (%)
Sleep Disorders - Average hours sleeping at night
Sleep Disorders - People that has trouble sleeping (%)
Smoking-Cigarette Use - People smoking cigarettes (%)
Taste & Smell - People 40+ having problems with smell (%)
Taste & Smell - People 40+ having problems with taste (%)
Taste & Smell - People 40+ that ever had wisdom teeth removed (%)
Taste & Smell - People 40+ that ever had tonsils teeth removed (%)
Taste & Smell - People 40+ that ever had a loss of consciousness because of a head injury (%)
Taste & Smell - People 40+ that ever had a broken nose or other serious injury to face or skull (%)
Taste & Smell - People 40+ that ever had two or more sinus infections (%)
Weight - Average height (inches)
Weight - Average weight (pounds)
Weight - Average BMI
Weight - People that are obese (%)
Weight - People that ever were obese (%)
Weight - People trying to lose weight (%)
100%
urban population.
Estimated median house/condo value in 2022: $136,142
14616:
$136,142New York:
$400,400
Median resident age: This zip code:
37.7 yearsNew York median age:
40.0 years
Average household size: This zip code:
2.3 peopleNew York:
2.5 people
Averages for the 2020 tax year for zip code 14616, filed in 2021:
Average Adjusted Gross Income (AGI) in 2020: $47,026 (Individual Income Tax Returns) Here:
$47,026State:
$90,930
Salary/wage: $41,372 (reported on 82.0% of returns )Here:
$41,372State:
$72,104
(% of AGI for various income ranges: 1043.8% for AGIs below $25k , 3416.9% for AGIs $25k-50k , 6257.8% for AGIs $50k-75k , 8584.2% for AGIs $75k-100k , 15505.6% for AGIs $100k-200k , 47790.0% for AGIs over 200k ) Taxable interest for individuals: $805 (reported on 38.5% of returns )This zip code:
$805New York:
$3,075
(% of AGI for various income ranges: 14.7% for AGIs below $25k , 15.6% for AGIs $25k-50k , 33.9% for AGIs $50k-75k , 70.4% for AGIs $75k-100k , 155.6% for AGIs $100k-200k , 2737.5% for AGIs over 200k ) Ordinary dividends: $3,502 (reported on 14.5% of returns )(% of AGI for various income ranges: 20.3% for AGIs below $25k , 18.3% for AGIs $25k-50k , 54.4% for AGIs $50k-75k , 123.9% for AGIs $75k-100k , 271.2% for AGIs $100k-200k , 5227.5% for AGIs over 200k ) Net capital gain/loss in AGI: +$6,983 (reported on 12.1% of returns )Here:
+$6,983State:
+$44,925
(% of AGI for various income ranges: 5.2% for AGIs below $25k , 11.9% for AGIs $25k-50k , 60.2% for AGIs $50k-75k , 122.0% for AGIs $75k-100k , 409.4% for AGIs $100k-200k , 17405.0% for AGIs over 200k ) Profit/loss from business: +$9,503 (reported on 9.5% of returns )Here:
+$9,503State:
+$14,940
(% of AGI for various income ranges: 63.1% for AGIs below $25k , 50.2% for AGIs $25k-50k , 99.7% for AGIs $50k-75k , 133.6% for AGIs $75k-100k , 381.5% for AGIs $100k-200k , 8557.5% for AGIs over 200k ) Taxable individual retirement arrangement distribution: $15,822 (reported on 11.6% of returns )14616:
$15,822New York:
$19,609
(% of AGI for various income ranges: 93.5% for AGIs below $25k , 101.6% for AGIs $25k-50k , 277.3% for AGIs $50k-75k , 517.0% for AGIs $75k-100k , 1046.3% for AGIs $100k-200k , 6187.5% for AGIs over 200k ) Self-employed (Keogh) retirement plans: $20,000 (reported on 0.2% of returns )14616:
$20,000New York:
$32,497
(% of AGI for various income ranges: 61.9% for AGIs $75k-100k ) Total itemized deductions: $25,148 (reported on 4.0% of returns )Here:
$25,148State:
$39,326
(% of AGI for various income ranges: 38.4% for AGIs below $25k , 57.9% for AGIs $25k-50k , 189.1% for AGIs $50k-75k , 283.6% for AGIs $75k-100k , 710.6% for AGIs $100k-200k ) Charity contributions: $5,511 (reported on 2.9% of returns )(% of AGI for various income ranges: 1.4% for AGIs below $25k , 10.3% for AGIs $25k-50k , 24.0% for AGIs $50k-75k , 53.0% for AGIs $75k-100k , 140.4% for AGIs $100k-200k ) Taxes paid: $7,558 (reported on 4.0% of returns )(% of AGI for various income ranges: 6.1% for AGIs below $25k , 16.8% for AGIs $25k-50k , 69.2% for AGIs $50k-75k , 111.0% for AGIs $75k-100k , 175.1% for AGIs $100k-200k ) Earned income credit: $2,235 (reported on 18.0% of returns )(% of AGI for various income ranges: 85.4% for AGIs below $25k , 68.5% for AGIs $25k-50k , 0.9% for AGIs $50k-75k ) Percentage of individuals using paid preparers for their 2020 taxes: 95.4%(% for various income ranges: 94.5% for AGIs below $25k , 96.0% for AGIs $25k-50k , 95.7% for AGIs $50k-75k , 96.3% for AGIs $75k-100k , 94.8% for AGIs $100k-200k , 92.9% for AGIs over 200k )
Averages for the 2012 tax year for zip code 14616, filed in 2013:
Average Adjusted Gross Income (AGI) in 2012: $40,830 (Individual Income Tax Returns) Here:
$40,830State:
$77,088
Salary/wage: $36,706 (reported on 82.9% of returns )Here:
$36,706State:
$60,593
(% of AGI for various income ranges: 71.5% for AGIs below $25k , 79.4% for AGIs $25k-50k , 77.2% for AGIs $50k-75k , 75.3% for AGIs $75k-100k , 74.1% for AGIs $100k-200k , 40.7% for AGIs over 200k ) Taxable interest for individuals: $559 (reported on 46.1% of returns )This zip code:
$559New York:
$3,125
(% of AGI for various income ranges: 0.9% for AGIs below $25k , 0.4% for AGIs $25k-50k , 0.5% for AGIs $50k-75k , 0.5% for AGIs $75k-100k , 0.7% for AGIs $100k-200k , 2.1% for AGIs over 200k ) Ordinary dividends: $2,694 (reported on 18.7% of returns )(% of AGI for various income ranges: 1.3% for AGIs below $25k , 0.8% for AGIs $25k-50k , 0.9% for AGIs $50k-75k , 0.9% for AGIs $75k-100k , 1.6% for AGIs $100k-200k , 4.9% for AGIs over 200k ) Net capital gain/loss in AGI: +$2,284 (reported on 12.7% of returns )Here:
+$2,284State:
+$42,474
(% of AGI for various income ranges: 0.3% for AGIs $50k-75k , 0.6% for AGIs $75k-100k , 1.0% for AGIs $100k-200k , 9.2% for AGIs over 200k ) Profit/loss from business: +$9,747 (reported on 9.1% of returns )Here:
+$9,747State:
+$16,168
(% of AGI for various income ranges: 3.9% for AGIs below $25k , 1.6% for AGIs $25k-50k , 1.0% for AGIs $50k-75k , 1.2% for AGIs $75k-100k , 2.4% for AGIs $100k-200k , 9.4% for AGIs over 200k ) Taxable individual retirement arrangement distribution: $11,734 (reported on 13.2% of returns )14616:
$11,734New York:
$17,621
(% of AGI for various income ranges: 4.6% for AGIs below $25k , 3.2% for AGIs $25k-50k , 3.5% for AGIs $50k-75k , 4.3% for AGIs $75k-100k , 5.1% for AGIs $100k-200k ) Self-employment retirement plans: $15,775 (reported on 0.3% of returns )14616:
$15,775New York:
$27,330
Total itemized deductions: $15,554 (22% of AGI, reported on 29.1% of returns )Here:
$15,554State:
$34,985
Here:
22.1% of AGIState:
21.3% of AGI
(% of AGI for various income ranges: 6.4% for AGIs below $25k , 9.7% for AGIs $25k-50k , 11.2% for AGIs $50k-75k , 13.2% for AGIs $75k-100k , 14.1% for AGIs $100k-200k , 13.0% for AGIs over 200k ) Charity contributions: $2,285 (reported on 23.3% of returns )(% of AGI for various income ranges: 0.5% for AGIs below $25k , 0.9% for AGIs $25k-50k , 1.3% for AGIs $50k-75k , 1.7% for AGIs $75k-100k , 2.0% for AGIs $100k-200k , 2.2% for AGIs over 200k ) Taxes paid: $7,526 (reported on 29.1% of returns )14616:
$7,526State:
$18,656
(% of AGI for various income ranges: 2.1% for AGIs below $25k , 4.1% for AGIs $25k-50k , 5.1% for AGIs $50k-75k , 6.4% for AGIs $75k-100k , 8.1% for AGIs $100k-200k , 8.4% for AGIs over 200k ) Earned income credit: $2,123 (reported on 18.5% of returns )(% of AGI for various income ranges: 5.4% for AGIs below $25k , 1.0% for AGIs $25k-50k ) Percentage of individuals using paid preparers for their 2012 taxes: 49.4%(% for various income ranges: 44.8% for AGIs below $25k , 48.8% for AGIs $25k-50k , 55.1% for AGIs $50k-75k , 57.5% for AGIs $75k-100k , 58.3% for AGIs $100k-200k , 71.4% for AGIs over 200k )
Averages for the 2004 tax year for zip code 14616, filed in 2005:
Average Adjusted Gross Income (AGI) in 2004: $36,907 (Individual Income Tax Returns) Here:
$36,907State:
$59,519
Salary/wage: $34,537 (reported on 83.2% of returns )Here:
$34,537State:
$50,673
(% of AGI for various income ranges: 84.4% for AGIs below $10k , 68.9% for AGIs $10k-25k , 80.3% for AGIs $25k-50k , 79.6% for AGIs $50k-75k , 81.2% for AGIs $75k-100k , 73.3% for AGIs over 100k ) Taxable interest for individuals: $800 (reported on 60.7% of returns )This zip code:
$800New York:
$2,377
(% of AGI for various income ranges: 4.6% for AGIs below $10k , 2.1% for AGIs $10k-25k , 1.1% for AGIs $25k-50k , 1.1% for AGIs $50k-75k , 0.9% for AGIs $75k-100k , 1.5% for AGIs over 100k ) Taxable dividends: $1,651 (reported on 28.3% of returns )(% of AGI for various income ranges: 4.1% for AGIs below $10k , 1.6% for AGIs $10k-25k , 0.9% for AGIs $25k-50k , 0.9% for AGIs $50k-75k , 1.0% for AGIs $75k-100k , 2.1% for AGIs over 100k ) Net capital gain/loss: +$1,767 (reported on 18.5% of returns )Here:
+$1,767State:
+$23,581
(% of AGI for various income ranges: -3.4% for AGIs below $10k , 0.1% for AGIs $10k-25k , 0.3% for AGIs $25k-50k , 0.5% for AGIs $50k-75k , 1.0% for AGIs $75k-100k , 3.3% for AGIs over 100k ) Profit/loss from business: +$8,022 (reported on 9.4% of returns )Here:
+$8,022State:
+$13,809
(% of AGI for various income ranges: 4.6% for AGIs below $10k , 3.3% for AGIs $10k-25k , 1.3% for AGIs $25k-50k , 1.4% for AGIs $50k-75k , 1.5% for AGIs $75k-100k , 3.5% for AGIs over 100k ) IRA payment deduction: $2,329 (reported on 2.1% of returns )14616:
$2,329New York:
$3,115
(% of AGI for various income ranges: 0.1% for AGIs below $10k , 0.2% for AGIs $10k-25k , 0.2% for AGIs $25k-50k , 0.1% for AGIs $50k-75k , 0.1% for AGIs $75k-100k , 0.0% for AGIs over 100k ) Self-employed pension: $15,172 (reported on 0.4% of returns )Here:
$15,172New York:
$19,016
(% of AGI for various income ranges: 0.2% for AGIs $10k-25k , 0.1% for AGIs $50k-75k , 0.2% for AGIs $75k-100k , 0.7% for AGIs over 100k ) Total itemized deductions: $13,819 (22% of AGI, reported on 34.8% of returns )Here:
$13,819State:
$25,864
Here:
22.4% of AGIState:
21.9% of AGI
(% of AGI for various income ranges: 8.0% for AGIs below $10k , 8.3% for AGIs $10k-25k , 12.2% for AGIs $25k-50k , 13.8% for AGIs $50k-75k , 15.3% for AGIs $75k-100k , 15.3% for AGIs over 100k ) Charity contributions deductions: $2,105 (3% of AGI, reported on 32.0% of returns )Here:
3.3% of AGIState:
3.6% of AGI
(% of AGI for various income ranges: 0.6% for AGIs below $10k , 0.9% for AGIs $10k-25k , 1.4% for AGIs $25k-50k , 1.8% for AGIs $50k-75k , 2.3% for AGIs $75k-100k , 2.9% for AGIs over 100k ) Total tax: $4,413 (reported on 75.5% of returns )14616:
$4,413State:
$11,730
(% of AGI for various income ranges: 2.0% for AGIs below $10k , 4.0% for AGIs $10k-25k , 7.0% for AGIs $25k-50k , 9.0% for AGIs $50k-75k , 10.3% for AGIs $75k-100k , 15.9% for AGIs over 100k ) Earned income credit: $1,582 (reported on 13.8% of returns )Percentage of individuals using paid preparers for their 2004 taxes: 59.8%(% for various income ranges: 51.7% for AGIs below $10k , 62.2% for AGIs $10k-25k , 60.4% for AGIs $25k-50k , 64.0% for AGIs $50k-75k , 62.5% for AGIs $75k-100k , 59.2% for AGIs over 100k )
Estimated median household income in 2022: This zip code:
$62,213New York:
$79,557
Nearest zip codes: 14615 ,
14612 ,
14613 ,
14626 ,
14617 ,
14621 .
Rochester Zip Code Map
Percentage of family households: This zip code:
41.6%New York:
41.3%
Percentage of households with unmarried partners: This zip code:
7.9%New York:
42.3%
Likely homosexual households (counted as self-reported same-sex unmarried-partner households)
Lesbian couples: 0.1% of all households Gay men: 0.0% of all households
Household received Food Stamps/SNAP in the past 12 months: 2,005Household did not receive Food Stamps/SNAP in the past 12 months: 9,810
Women who had a birth in the past 12 months: 172 (118 now married , 53 unmarried) Women who did not have a birth in the past 12 months: 6,292 (2,023 now married , 4,282 unmarried)
Housing units in zip code 14616 with a mortgage: 5,840 (803
second mortgage , 89
home equity loan , 685
both second mortgage and home equity loan )
Houses without a mortgage: 360
Median monthly owner costs for units with a mortgage: $1,229
Median monthly owner costs for units without a mortgage: $565
Residents with income below the poverty level in 2022:
This zip code:
14.4%Whole state:
14.3%
Residents with income below 50% of the poverty level in 2022:
This zip code:
8.0%Whole state:
6.8%
Median number of rooms in houses and condos: Median number of rooms in apartments: Notable locations in this zip code not listed on our city pages
Click to draw/clear zip code borders Notable locations in zip code 14616: (A) , Grandeville Home (B) , The Crossings at Greece (C) , Young - at - Heart Senior Center (D) , Monroe County Public Library Barnard Crossing Branch (E) , Saint Joseph's Villa of Rochester (F) , Barnard Fire Department (G) . Display/hide their locations on the map
Shopping Centers: (1) , North Pointe Plaza Shopping Center (2) , Dewey Latta Plaza Shopping Center (3) . Display/hide their locations on the map
Churches in zip code 14616 include: (A) , West Side Church (B) , Aldersgate United Methodist (C) , Bethany Presbyterian Church (D) , Borromeo Prayer Center (E) , Church of Christ (F) , Covenant Presbyterian Church (G) , English Road Alliance Church (H) , First Spanish Church of the Nazarene (I) . Display/hide their locations on the map
Cemetery: (1) . Display/hide its location on the map
Year house built (houses)
0 2020 or later211 2010 to 2019431 2000 to 2009572 1990 to 19991,113 1980 to 19891,469 1970 to 19792,169 1960 to 19693,063 1950 to 19591,461 1940 to 19491,694 1939 or earlier
Zip code 14616 household income distribution in 2022 873 Less than $10,000327 $10,000 to $14,999326 $15,000 to $19,999528 $20,000 to $24,999379 $25,000 to $29,999745 $30,000 to $34,999540 $35,000 to $39,999548 $40,000 to $44,999559 $45,000 to $49,999827 $50,000 to $59,9991,467 $60,000 to $74,9992,150 $75,000 to $99,9991,006 $100,000 to $124,999770 $125,000 to $149,999494 $150,000 to $199,999353 $200,000 or moreEstimate of home value of owner-occupied houses/condos in 2022 in zip code 14616 100 Less than $10,00040 $10,000 to $14,99994 $15,000 to $19,99926 $20,000 to $24,9999 $40,000 to $49,999100 $50,000 to $59,999117 $60,000 to $69,999147 $70,000 to $79,999281 $80,000 to $89,999490 $90,000 to $99,9991,881 $100,000 to $124,9991,522 $125,000 to $149,999972 $150,000 to $174,999518 $175,000 to $199,999486 $200,000 to $249,999301 $250,000 to $299,999134 $300,000 to $399,99944 $400,000 to $499,99922 $500,000 to $749,99911 $1,000,000 to $1,499,999Rent paid by renters in 2022 in zip code 14616 73 Less than $10012 $200 to $24935 $250 to $29929 $300 to $349125 $600 to $649258 $650 to $699148 $700 to $749253 $750 to $799465 $800 to $899605 $900 to $999979 $1,000 to $1,249185 $1,250 to $1,499238 $1,500 to $1,99977 $2,000 to $2,49988 $2,500 to $2,99939 No cash rent
Median gross rent in 2022: $1,112.
Median price asked for vacant for-sale houses and condos in 2022: $191,867.
Estimated median house (or condo) value in 2022 for: White Non-Hispanic householders: $135,977Black or African American householders: $130,703American Indian or Alaska Native householders: $40,710Asian householders: $127,736Some other race householders: $193,664Two or more races householders: $173,721Hispanic or Latino householders: $182,786Estimated median house or condo value in 2022: $136,142
14616:
$136,142New York:
$400,400
Lower value quartile - upper value quartile: $113,044 - $165,924
Mean price in 2022: Detached houses: $129,600Here:
$129,600State:
$476,719
Townhouses or other attached units: $192,354Here:
$192,354State:
$699,270
In 2-unit structures: $166,706Here:
$166,706State:
$713,077
In 3-to-4-unit structures: $669,935Here:
$669,935State:
$764,568
In 5-or-more-unit structures: $245,501Here:
$245,501State:
$912,009
Mobile homes: $13,431Here:
$13,431State:
$88,925
Housing units in structures:
One, detached: 8,385One, attached: 901Two: 2163 or 4: 8365 to 9: 1,31810 to 19: 1920 to 49: 2150 or more: 528Mobile homes: 31Boats, RVs, vans, etc.: 14Unemployment : 4.8%
Means of transportation to work in zip code 14616 78.0% 10,247 Drove a car alone7.9% 1,037 Carpooled1.4% 181 Bus or trolley bus0.1% 10 Streetcar or trolley car0.1% 12 Ferryboat0.5% 67 Motorcycle0.9% 119 Walked1.1% 147 Other means10.1% 1,323 Worked at homeTravel time to work (commute) in zip code 14616 172 Less than 5 minutes1,081 5 to 9 minutes2,160 10 to 14 minutes2,544 15 to 19 minutes2,679 20 to 24 minutes851 25 to 29 minutes1,447 30 to 34 minutes115 35 to 39 minutes143 40 to 44 minutes236 45 to 59 minutes101 60 to 89 minutes146 90 or more minutes
Percentage of zip code residents living and working in this county: 99.3%
Household type by relationship:
Households: 26,817
Male householders: 5,189 (1,891 living alone ), Female householders: 6,626 (2,379 living alone )4,008 spouses (3,970 opposite-sex spouses ), 1,176 unmarried partners , (1,139 opposite-sex unmarried partners ), 8,029 children (7,682 natural , 85 adopted , 259 stepchildren ), 486 grandchildren , 112 brothers or sisters , 319 parents , 9 foster children , 243 other relatives , 663 non-relatives In group quarters: 59 (-1 institutionalized population )
Size of family households: 3,003 2-persons , 1,499 3-persons , 1,128 4-persons , 484 5-persons , 370 6-persons , 82 7-or-more-persons
Size of nonfamily households: 4,269 1-person , 972 2-persons , 16 4-persons , 20 5-persons , 11 6-persons
2,999 married couples with children. single-parent households (673 men , 2,334 women ).
89.0% of residents of 14616 zip code speak English at home. of residents speak Spanish at home (79% very well, 13% well, 6% not well, 2% not at all ).of residents speak other Indo-European language at home (70% very well, 10% well, 20% not well ).of residents speak Asian or Pacific Island language at home (38% very well, 16% well, 33% not well, 13% not at all ).of residents speak other language at home (47% very well, 53% not well ).
Foreign born population: 1,558 (5.8%)
(73.7%
of them are naturalized citizens )
This zip code:
5.8%Whole state:
22.7%
14% Haiti 10% Greece 8% Chile 6% Sweden 6% France 5% Thailand 5% Belarus 20% Italian 8% German 7% English 6% Irish 5% American 4% Polish 3% European
Year of entry for the foreign-born population
592 2010 or later 439 2000 to 2009 183 1990 to 1999 1,067 Before 1990
There are
173 Medical Specialists in Zip Code 14616 .
Facilities with environmental interests located in this zip code:
GERALD P HEUSINGER ENT INC (2500 DEWEY AVE in ROCHESTER, NY)
(Resource Conservation and Recovery Act (tracking hazardous waste))
GEYSSENS NURSERY & LANDSCAPING (3446 MT READ BLVD in ROCHESTER, NY)
(Resource Conservation and Recovery Act (tracking hazardous waste))
GOODYEAR AUTO SERVICE CENTER (3925 DEWEY AVE in GREECE, NY)
(Resource Conservation and Recovery Act (tracking hazardous waste))
HIGHWAY OIL INC 106 (2970 DEWEY AVE in ROCHESTER, NY)
(Resource Conservation and Recovery Act (tracking hazardous waste))
CUMBERLAND FARMS 3207 (3167 DEWEY AVE & BRIARCLIFF in ROCHESTER, NY)
(Resource Conservation and Recovery Act (tracking hazardous waste))
GREECE GARAGE INC (399 STONE RD in ROCHESTER, NY)
Conditionally Exempt Small Quantity Generators, less than 100 kg/month of hazardous waste (Resource Conservation and Recovery Act (tracking hazardous waste)) - notification Organizations: COLIN WILLIAMS (CONTACT/OWNER)
IOLA CAMPUS (350 E HENRIETTA RD in ROCHESTER, NY)
Small Quantity Generators, between 100 kg and 1000 kg of hazardous waste/month (Resource Conservation and Recovery Act (tracking hazardous waste))
Housing units lacking complete plumbing facilities: 0.3%
Housing units lacking complete kitchen facilities: 1.1%
80.1% Utility gas 15.1% Electricity 1.9% Fuel oil, kerosene, etc. 1.3% Bottled, tank, or LP gas 1.2% No fuel used
Population in 1990: 26,500. Population change in the 1990s: +619 (+2.3%).
Place of birth for U.S.-born residents:
This state: 21,554Northeast: 1,104Midwest: 672South: 753West: 388
65% of the 14616 zip code residents lived in the same house 5 years ago.
Out of people who lived in different houses, 84% lived in this county.
Out of people who lived in different counties, 50% lived in New York.
93% of the 14616 zip code residents lived in the same house 1 year ago.
Out of people who lived in different houses, 82% moved from this county.
Out of people who lived in different houses, 5% moved from different county within same state.
Out of people who lived in different houses, 7% moved from different state.
Out of people who lived in different houses, 3% moved from abroad.
Private vs. public school enrollment:
Students in private schools in grades 1 to 8 (elementary and middle school): 185
Students in private schools in grades 9 to 12 (high school): 104
Students in private undergraduate colleges: 377
Occupation by median earnings in the past 12 months ($)
81,298 Law enforcement workers including supervisors 74,966 Legal occupations 70,393 Computer and mathematical occupations 67,834 Business and financial operations occupations 64,523 Health diagnosing and treating practitioners and other technical occupations 58,511 Management occupations
Top industries in this zip code by the number of employees in 2005:
Health Care and Social Assistance: Child and Youth Services (250-499 employees: 1 establishment)Accommodation and Food Services: Limited-Service Restaurants (20-49: 8, 10-19: 4, 5-9: 1, 1-4: 2)Accommodation and Food Services: Full-Service Restaurants (50-99: 1, 20-49: 2, 10-19: 1, 5-9: 3, 1-4: 6)Health Care and Social Assistance: Offices of Dentists (10-19: 7, 5-9: 6, 1-4: 6)Other Services (except Public Administration): Religious Organizations (20-49: 1, 10-19: 3, 5-9: 4, 1-4: 3)Health Care and Social Assistance: Residential Mental Retardation Facilities (50-99: 1, 10-19: 2, 5-9: 1)Finance and Insurance: Commercial Banking (10-19: 3, 5-9: 5)
People in group quarters in 2010:
245 people in workers' group living quarters and job corps centers
96 people in nursing facilities/skilled-nursing facilities
23 people in group homes intended for adults
8 people in other noninstitutional facilities
People in group quarters in 2000:
145 people in nursing homes
112 people in religious group quarters
20 people in homes for the mentally retarded
Fatal accident statistics in 2014:
Fatal accident count: 2Vehicles involved in fatal accidents: 2Fatal accidents caused by drunken drivers: 0Fatalities: 2Persons involved in fatal accidents: 2Pedestrians involved in fatal accidents: 2
Fatal accident statistics in 2013:
Fatal accident count: 1Vehicles involved in fatal accidents: 1Fatal accidents caused by drunken drivers: 1Fatalities: 1Persons involved in fatal accidents: 2Pedestrians involved in fatal accidents: 0
Home Mortgage Disclosure Act Aggregated Statistics For Year 2009(Based on 5 full and 10 partial tracts) A) FHA, FSA/RHS & VA B) Conventional C) Refinancings D) Home Improvement Loans F) Non-occupant Loans on Number Average Value Number Average Value Number Average Value Number Average Value Number Average Value
LOANS ORIGINATED 407 $87,903 121 $79,540 321 $75,410 128 $10,888 25 $56,447 APPLICATIONS APPROVED, NOT ACCEPTED 10 $83,196 6 $76,788 30 $79,857 24 $10,277 3 $54,293 APPLICATIONS DENIED 47 $86,880 16 $85,947 148 $75,594 103 $11,254 13 $48,902 APPLICATIONS WITHDRAWN 32 $92,329 7 $141,179 83 $80,036 6 $8,283 2 $81,500 FILES CLOSED FOR INCOMPLETENESS 1 $103,000 0 $0 28 $80,497 0 $0 1 $12,000
Aggregated Statistics For Year 2008(Based on 5 full and 10 partial tracts) A) FHA, FSA/RHS & VA B) Conventional C) Refinancings D) Home Improvement Loans E) Loans on Dwellings For 5+ Families F) Non-occupant Loans on G) Loans On Manufactured Number Average Value Number Average Value Number Average Value Number Average Value Number Average Value Number Average Value Number Average Value
LOANS ORIGINATED 279 $92,263 295 $77,459 226 $74,681 132 $13,449 1 $1,543,170 38 $63,161 0 $0 APPLICATIONS APPROVED, NOT ACCEPTED 11 $73,008 13 $103,788 42 $85,682 28 $20,344 1 $429,480 4 $210,635 3 $43,257 APPLICATIONS DENIED 32 $84,279 48 $70,705 284 $83,434 127 $21,445 2 $167,900 9 $50,402 6 $30,315 APPLICATIONS WITHDRAWN 19 $84,361 9 $68,192 137 $88,223 10 $35,914 0 $0 2 $53,285 0 $0 FILES CLOSED FOR INCOMPLETENESS 4 $71,478 9 $82,481 21 $101,000 3 $49,600 0 $0 2 $76,605 0 $0
Aggregated Statistics For Year 2007(Based on 5 full and 10 partial tracts) A) FHA, FSA/RHS & VA B) Conventional C) Refinancings D) Home Improvement Loans E) Loans on Dwellings For 5+ Families F) Non-occupant Loans on G) Loans On Manufactured Number Average Value Number Average Value Number Average Value Number Average Value Number Average Value Number Average Value Number Average Value
LOANS ORIGINATED 222 $88,252 485 $77,758 342 $75,667 183 $22,092 2 $1,405,760 45 $71,379 0 $0 APPLICATIONS APPROVED, NOT ACCEPTED 12 $85,567 45 $71,723 79 $69,961 33 $17,150 0 $0 12 $63,144 4 $48,470 APPLICATIONS DENIED 36 $91,336 107 $84,757 560 $74,959 169 $20,630 0 $0 27 $67,242 0 $0 APPLICATIONS WITHDRAWN 12 $87,595 53 $80,414 225 $78,768 29 $44,729 0 $0 8 $60,150 0 $0 FILES CLOSED FOR INCOMPLETENESS 2 $106,120 24 $73,840 53 $92,711 1 $60,000 1 $1,928,960 1 $89,210 0 $0
Aggregated Statistics For Year 2006(Based on 5 full and 10 partial tracts) A) FHA, FSA/RHS & VA B) Conventional C) Refinancings D) Home Improvement Loans E) Loans on Dwellings For 5+ Families F) Non-occupant Loans on G) Loans On Manufactured Number Average Value Number Average Value Number Average Value Number Average Value Number Average Value Number Average Value Number Average Value
LOANS ORIGINATED 202 $87,721 652 $68,458 397 $68,865 262 $16,780 3 $4,298,367 45 $64,310 1 $112,220 APPLICATIONS APPROVED, NOT ACCEPTED 9 $76,422 63 $66,832 97 $71,083 49 $18,182 1 $71,580 7 $47,419 0 $0 APPLICATIONS DENIED 12 $95,371 109 $70,617 683 $77,369 262 $27,243 0 $0 28 $48,939 4 $40,078 APPLICATIONS WITHDRAWN 12 $84,670 74 $58,597 318 $77,247 19 $54,634 0 $0 8 $69,262 0 $0 FILES CLOSED FOR INCOMPLETENESS 2 $75,565 16 $74,316 98 $91,577 4 $7,420 0 $0 3 $102,567 0 $0
Aggregated Statistics For Year 2005(Based on 5 full and 10 partial tracts) A) FHA, FSA/RHS & VA B) Conventional C) Refinancings D) Home Improvement Loans E) Loans on Dwellings For 5+ Families F) Non-occupant Loans on G) Loans On Manufactured Number Average Value Number Average Value Number Average Value Number Average Value Number Average Value Number Average Value Number Average Value
LOANS ORIGINATED 211 $89,716 674 $71,742 501 $69,380 192 $17,198 1 $1,449,600 53 $61,777 0 $0 APPLICATIONS APPROVED, NOT ACCEPTED 10 $76,541 35 $71,353 87 $72,921 47 $16,751 0 $0 4 $47,472 3 $35,803 APPLICATIONS DENIED 14 $83,334 74 $73,200 658 $78,828 200 $25,064 0 $0 24 $37,164 8 $67,456 APPLICATIONS WITHDRAWN 14 $79,107 51 $80,291 336 $87,220 39 $66,992 0 $0 7 $82,513 1 $30,200 FILES CLOSED FOR INCOMPLETENESS 3 $96,840 33 $84,762 140 $95,482 13 $44,509 0 $0 3 $70,663 1 $90,600
Aggregated Statistics For Year 2004(Based on 5 full and 10 partial tracts) A) FHA, FSA/RHS & VA B) Conventional C) Refinancings D) Home Improvement Loans E) Loans on Dwellings For 5+ Families F) Non-occupant Loans on G) Loans On Manufactured Number Average Value Number Average Value Number Average Value Number Average Value Number Average Value Number Average Value Number Average Value
LOANS ORIGINATED 211 $83,532 559 $72,431 602 $72,436 176 $17,020 3 $14,947,153 52 $59,405 0 $0 APPLICATIONS APPROVED, NOT ACCEPTED 16 $84,892 35 $81,840 104 $77,762 37 $17,874 0 $0 4 $51,555 2 $11,995 APPLICATIONS DENIED 27 $72,955 90 $64,856 592 $77,649 173 $26,525 0 $0 35 $49,708 10 $46,546 APPLICATIONS WITHDRAWN 11 $69,047 36 $74,339 408 $75,413 31 $49,535 0 $0 9 $94,959 1 $54,360 FILES CLOSED FOR INCOMPLETENESS 12 $92,004 17 $79,005 153 $84,771 8 $28,734 0 $0 4 $73,175 0 $0
Aggregated Statistics For Year 2003(Based on 5 full and 10 partial tracts) A) FHA, FSA/RHS & VA B) Conventional C) Refinancings D) Home Improvement Loans E) Loans on Dwellings For 5+ Families F) Non-occupant Loans on Number Average Value Number Average Value Number Average Value Number Average Value Number Average Value Number Average Value
LOANS ORIGINATED 247 $81,692 510 $75,047 1,246 $69,857 129 $10,706 2 $700,000 58 $53,535 APPLICATIONS APPROVED, NOT ACCEPTED 10 $98,358 31 $68,607 179 $72,372 21 $9,123 0 $0 4 $50,388 APPLICATIONS DENIED 27 $78,509 60 $62,485 584 $76,813 95 $11,503 0 $0 35 $58,978 APPLICATIONS WITHDRAWN 6 $75,783 35 $65,402 327 $75,733 10 $17,250 0 $0 4 $89,975 FILES CLOSED FOR INCOMPLETENESS 5 $69,774 3 $102,817 61 $74,579 3 $30,643 0 $0 4 $56,278
Aggregated Statistics For Year 2002(Based on 5 full and 8 partial tracts) A) FHA, FSA/RHS & VA B) Conventional C) Refinancings D) Home Improvement Loans F) Non-occupant Loans on Number Average Value Number Average Value Number Average Value Number Average Value Number Average Value
LOANS ORIGINATED 283 $76,790 438 $64,361 651 $68,135 152 $10,125 46 $55,307 APPLICATIONS APPROVED, NOT ACCEPTED 8 $70,325 29 $64,846 131 $65,735 26 $11,979 8 $57,945 APPLICATIONS DENIED 23 $75,297 63 $61,819 333 $65,836 106 $14,156 9 $50,890 APPLICATIONS WITHDRAWN 5 $69,256 27 $62,477 290 $73,840 20 $25,252 11 $60,265 FILES CLOSED FOR INCOMPLETENESS 6 $70,747 5 $51,594 81 $73,806 0 $0 0 $0
Aggregated Statistics For Year 2001(Based on 5 full and 8 partial tracts) A) FHA, FSA/RHS & VA B) Conventional C) Refinancings D) Home Improvement Loans E) Loans on Dwellings For 5+ Families F) Non-occupant Loans on Number Average Value Number Average Value Number Average Value Number Average Value Number Average Value Number Average Value
LOANS ORIGINATED 308 $72,193 322 $64,371 468 $63,794 122 $10,687 2 $424,975 38 $50,315 APPLICATIONS APPROVED, NOT ACCEPTED 3 $81,927 25 $74,372 76 $62,411 37 $16,174 0 $0 5 $64,552 APPLICATIONS DENIED 34 $74,634 70 $60,977 464 $62,066 102 $15,657 0 $0 4 $55,392 APPLICATIONS WITHDRAWN 15 $79,469 26 $72,245 252 $72,540 16 $11,116 0 $0 1 $34,360 FILES CLOSED FOR INCOMPLETENESS 12 $82,167 5 $71,056 39 $64,063 3 $9,830 0 $0 0 $0
Aggregated Statistics For Year 2000(Based on 5 full and 8 partial tracts) A) FHA, FSA/RHS & VA B) Conventional C) Refinancings D) Home Improvement Loans E) Loans on Dwellings For 5+ Families F) Non-occupant Loans on Number Average Value Number Average Value Number Average Value Number Average Value Number Average Value Number Average Value
LOANS ORIGINATED 249 $67,767 375 $63,394 219 $53,518 147 $11,300 2 $7,442,895 19 $47,668 APPLICATIONS APPROVED, NOT ACCEPTED 8 $69,719 31 $66,373 65 $53,733 66 $15,882 0 $0 1 $61,320 APPLICATIONS DENIED 25 $74,692 63 $61,007 347 $50,240 145 $19,043 0 $0 11 $62,123 APPLICATIONS WITHDRAWN 11 $61,297 10 $60,082 129 $51,870 16 $14,952 0 $0 8 $47,701 FILES CLOSED FOR INCOMPLETENESS 9 $71,931 6 $59,293 42 $70,131 1 $50,000 0 $0 4 $76,422
Aggregated Statistics For Year 1999(Based on 3 full and 5 partial tracts) A) FHA, FSA/RHS & VA B) Conventional C) Refinancings D) Home Improvement Loans F) Non-occupant Loans on Number Average Value Number Average Value Number Average Value Number Average Value Number Average Value
LOANS ORIGINATED 164 $74,184 175 $109,773 252 $62,417 95 $13,695 13 $64,185 APPLICATIONS APPROVED, NOT ACCEPTED 2 $73,865 12 $62,364 61 $63,314 23 $14,064 3 $59,823 APPLICATIONS DENIED 13 $70,584 19 $108,794 177 $62,584 79 $16,138 16 $78,311 APPLICATIONS WITHDRAWN 10 $74,780 20 $107,566 106 $62,417 21 $39,669 1 $53,880 FILES CLOSED FOR INCOMPLETENESS 3 $58,513 1 $123,340 23 $81,564 0 $0 1 $33,820
Private Mortgage Insurance Companies Aggregated Statistics For Year 2009(Based on 5 full and 10 partial tracts) A) Conventional B) Refinancings Number Average Value Number Average Value
LOANS ORIGINATED 38 $99,089 30 $91,534 APPLICATIONS APPROVED, NOT ACCEPTED 3 $96,470 4 $108,310 APPLICATIONS DENIED 7 $85,439 5 $126,972 APPLICATIONS WITHDRAWN 0 $0 0 $0 FILES CLOSED FOR INCOMPLETENESS 0 $0 0 $0
Aggregated Statistics For Year 2008(Based on 5 full and 10 partial tracts) A) Conventional B) Refinancings C) Non-occupant Loans on Number Average Value Number Average Value Number Average Value
LOANS ORIGINATED 181 $83,614 39 $87,194 18 $63,379 APPLICATIONS APPROVED, NOT ACCEPTED 16 $92,031 16 $101,996 2 $85,950 APPLICATIONS DENIED 10 $73,234 1 $120,800 0 $0 APPLICATIONS WITHDRAWN 9 $73,679 1 $50,820 1 $50,820 FILES CLOSED FOR INCOMPLETENESS 1 $85,900 4 $90,972 2 $94,945
Aggregated Statistics For Year 2007(Based on 5 full and 10 partial tracts) A) Conventional B) Refinancings C) Non-occupant Loans on Number Average Value Number Average Value Number Average Value
LOANS ORIGINATED 241 $84,919 50 $90,039 8 $60,271 APPLICATIONS APPROVED, NOT ACCEPTED 24 $92,900 6 $126,965 0 $0 APPLICATIONS DENIED 5 $66,372 3 $81,567 2 $30,980 APPLICATIONS WITHDRAWN 7 $78,564 8 $87,166 2 $61,045 FILES CLOSED FOR INCOMPLETENESS 0 $0 1 $77,310 0 $0
Aggregated Statistics For Year 2006(Based on 5 full and 10 partial tracts) A) Conventional B) Refinancings C) Non-occupant Loans on Number Average Value Number Average Value Number Average Value
LOANS ORIGINATED 203 $81,387 19 $89,938 8 $63,826 APPLICATIONS APPROVED, NOT ACCEPTED 26 $78,432 13 $79,638 4 $58,200 APPLICATIONS DENIED 6 $70,957 0 $0 0 $0 APPLICATIONS WITHDRAWN 13 $81,213 4 $92,728 0 $0 FILES CLOSED FOR INCOMPLETENESS 0 $0 0 $0 0 $0
Aggregated Statistics For Year 2005(Based on 5 full and 10 partial tracts) A) Conventional B) Refinancings C) Non-occupant Loans on Number Average Value Number Average Value Number Average Value
LOANS ORIGINATED 223 $83,355 59 $78,458 8 $75,318 APPLICATIONS APPROVED, NOT ACCEPTED 26 $80,980 15 $77,754 5 $40,416 APPLICATIONS DENIED 2 $71,690 1 $96,640 1 $96,640 APPLICATIONS WITHDRAWN 13 $77,516 3 $95,247 2 $69,755 FILES CLOSED FOR INCOMPLETENESS 3 $69,307 0 $0 0 $0
Aggregated Statistics For Year 2004(Based on 5 full and 10 partial tracts) A) Conventional B) Refinancings C) Non-occupant Loans on Number Average Value Number Average Value Number Average Value
LOANS ORIGINATED 260 $76,699 113 $82,276 9 $57,023 APPLICATIONS APPROVED, NOT ACCEPTED 24 $73,265 18 $86,518 3 $33,537 APPLICATIONS DENIED 12 $66,742 1 $86,000 2 $62,645 APPLICATIONS WITHDRAWN 6 $67,150 1 $95,240 2 $70,530 FILES CLOSED FOR INCOMPLETENESS 3 $71,587 4 $60,962 4 $60,962
Aggregated Statistics For Year 2003(Based on 5 full and 10 partial tracts) A) Conventional B) Refinancings C) Non-occupant Loans on Number Average Value Number Average Value Number Average Value
LOANS ORIGINATED 264 $79,225 277 $80,755 13 $58,068 APPLICATIONS APPROVED, NOT ACCEPTED 30 $71,449 51 $78,050 6 $56,840 APPLICATIONS DENIED 7 $65,709 4 $80,185 2 $61,035 APPLICATIONS WITHDRAWN 2 $92,110 10 $74,345 0 $0 FILES CLOSED FOR INCOMPLETENESS 0 $0 1 $69,120 0 $0
Aggregated Statistics For Year 2002(Based on 5 full and 8 partial tracts) A) Conventional B) Refinancings C) Non-occupant Loans on Number Average Value Number Average Value Number Average Value
LOANS ORIGINATED 199 $70,669 130 $78,848 13 $57,105 APPLICATIONS APPROVED, NOT ACCEPTED 25 $71,094 25 $82,055 6 $55,633 APPLICATIONS DENIED 7 $67,716 2 $115,285 0 $0 APPLICATIONS WITHDRAWN 2 $79,890 5 $93,892 0 $0 FILES CLOSED FOR INCOMPLETENESS 0 $0 2 $69,960 0 $0
Aggregated Statistics For Year 2001(Based on 5 full and 8 partial tracts) A) Conventional B) Refinancings C) Non-occupant Loans on Number Average Value Number Average Value Number Average Value
LOANS ORIGINATED 141 $68,730 82 $75,315 9 $51,194 APPLICATIONS APPROVED, NOT ACCEPTED 29 $65,987 13 $64,371 1 $56,000 APPLICATIONS DENIED 1 $97,650 0 $0 0 $0 APPLICATIONS WITHDRAWN 3 $60,873 0 $0 0 $0 FILES CLOSED FOR INCOMPLETENESS 0 $0 0 $0 0 $0
Aggregated Statistics For Year 2000(Based on 5 full and 8 partial tracts) A) Conventional B) Refinancings C) Non-occupant Loans on Number Average Value Number Average Value Number Average Value
LOANS ORIGINATED 186 $68,151 11 $75,332 6 $64,560 APPLICATIONS APPROVED, NOT ACCEPTED 21 $66,178 3 $64,357 4 $37,478 APPLICATIONS DENIED 10 $68,439 1 $89,390 2 $74,600 APPLICATIONS WITHDRAWN 0 $0 0 $0 0 $0 FILES CLOSED FOR INCOMPLETENESS 0 $0 0 $0 0 $0
Aggregated Statistics For Year 1999(Based on 3 full and 5 partial tracts) A) Conventional B) Refinancings C) Non-occupant Loans on Number Average Value Number Average Value Number Average Value
LOANS ORIGINATED 91 $74,933 32 $80,052 0 $0 APPLICATIONS APPROVED, NOT ACCEPTED 6 $78,900 8 $82,210 1 $53,000 APPLICATIONS DENIED 6 $60,383 1 $72,760 0 $0 APPLICATIONS WITHDRAWN 2 $90,535 1 $55,000 0 $0 FILES CLOSED FOR INCOMPLETENESS 1 $92,590 1 $135,820 0 $0
2002 - 2018 National Fire Incident Reporting System (NFIRS) incidents See full 2006 National Fire Incident Reporting System statistics for zip code 14616, New York
Most common first names in zip code 14616 among deceased individuals Name Count Lived (average)
John 295 75.6 years Mary 287 80.3 years William 230 76.3 years Joseph 188 77.5 years Robert 172 73.3 years George 155 76.3 years Charles 128 77.0 years Helen 127 79.1 years Margaret 124 77.8 years James 122 73.3 years
Most common last names in zip code 14616 among deceased individuals Last name Count Lived (average)
Smith 68 77.3 years Miller 50 76.3 years Brown 29 79.9 years Williams 28 73.6 years Young 28 73.5 years Johnson 23 78.8 years Davis 23 77.3 years Wilson 22 77.4 years Baker 21 80.1 years White 21 75.7 years
Businesses in zip code 14616
Name Count Name Count
ALDI 1 McDonald's 1 AT&T 1 Pizza Hut 1 Advance Auto Parts 1 RadioShack 1 Blockbuster 1 Rite Aid 2 Burger King 1 Subway 2 CVS 1 T-Mobile 1 Curves 1 Tim Hortons 2 Domino's Pizza 1 Toys"R"Us 1 Dunkin Donuts 1 UPS 1 GNC 2 Verizon Wireless 2 H&R Block 2 Walgreens 1 Kohl's 1 Wendy's 2 Little Caesars Pizza 1

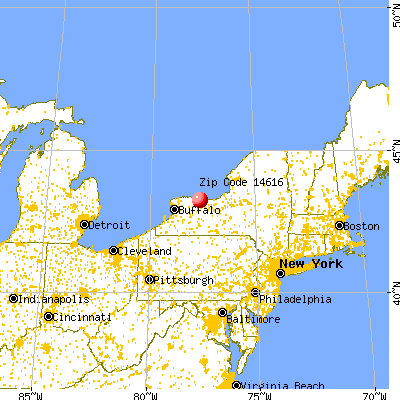


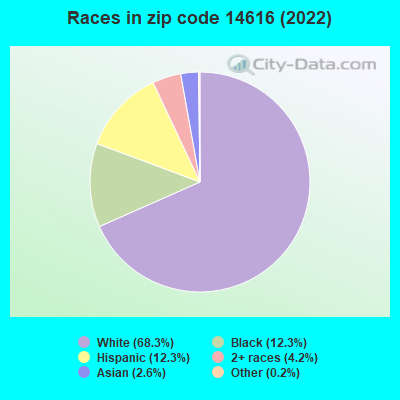


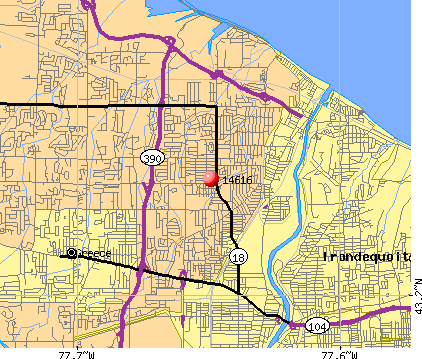 Nearest zip codes: 14615, 14612, 14613, 14626, 14617, 14621.

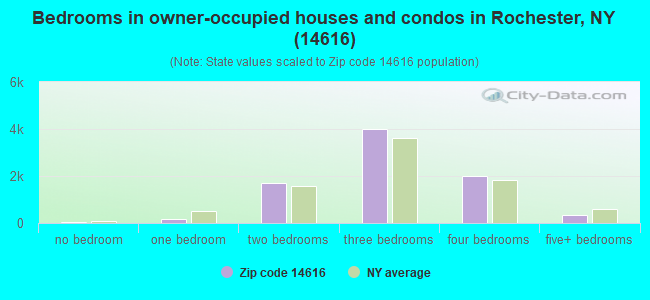
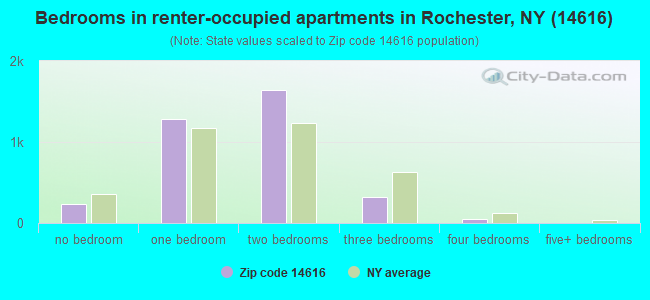
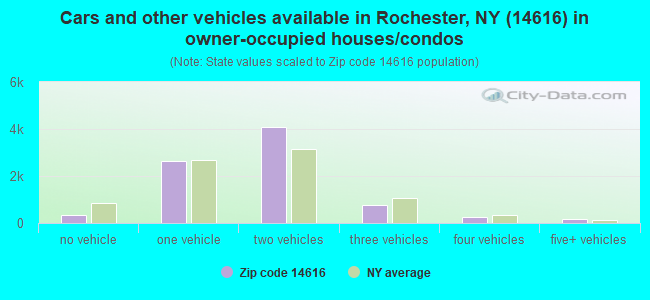
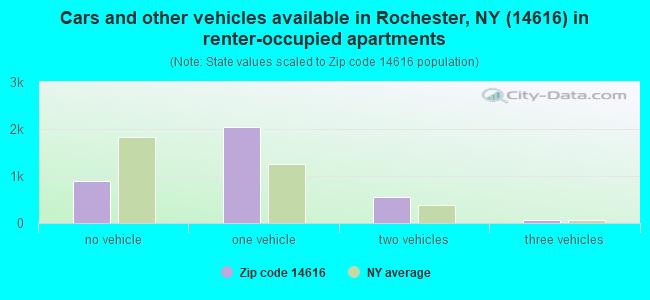


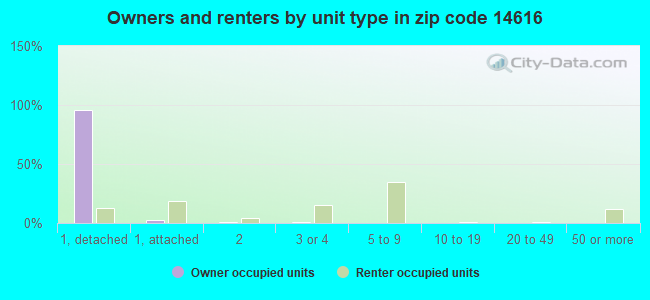
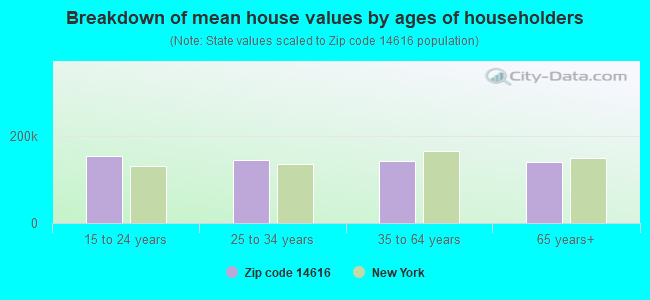


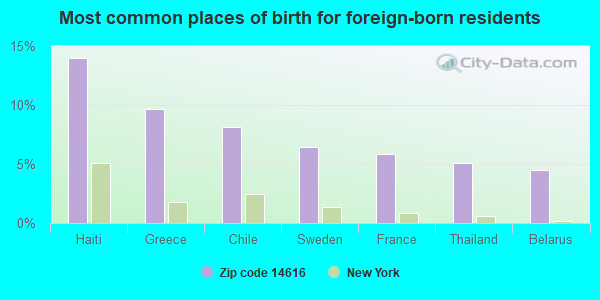
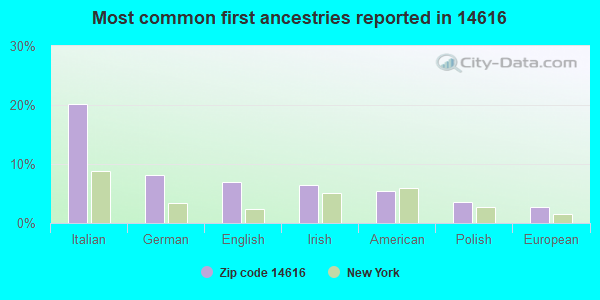
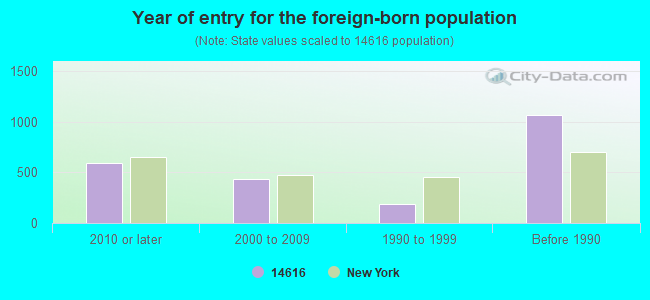


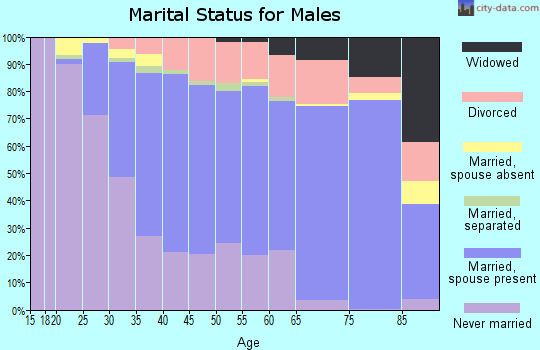

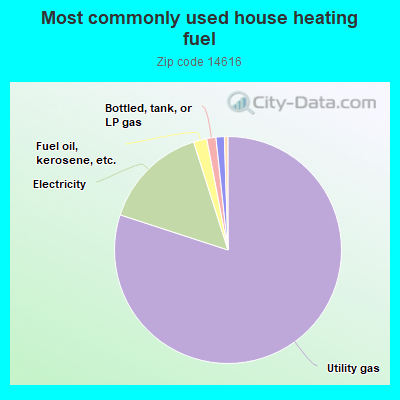
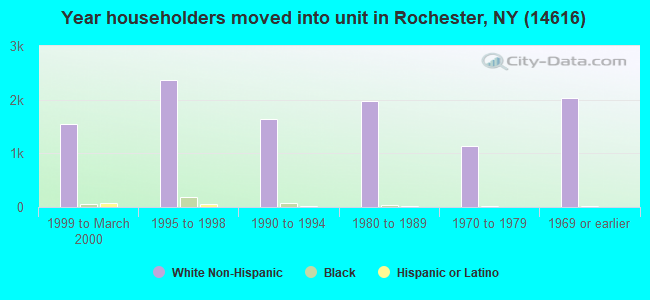
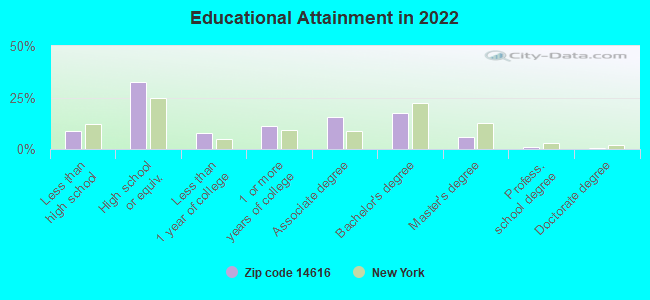
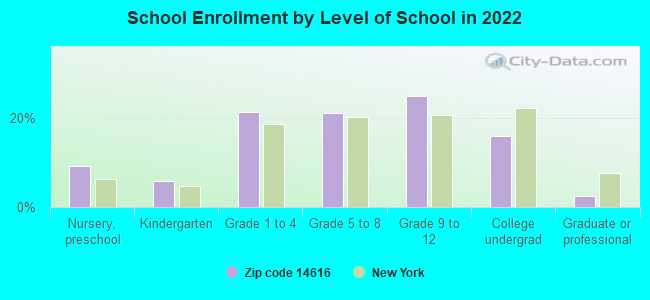
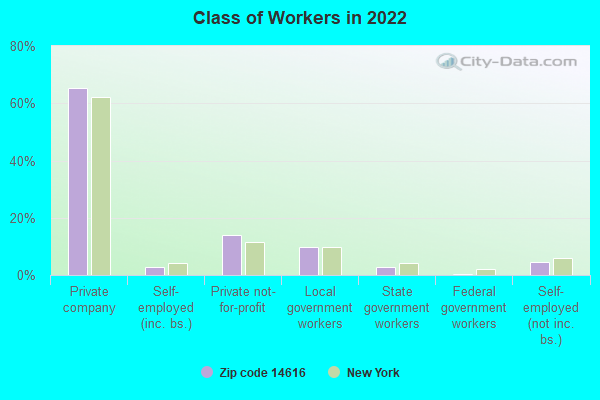
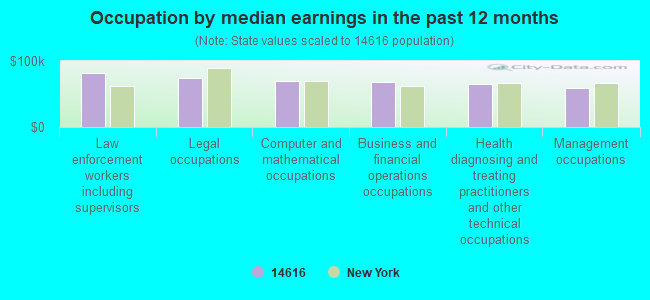
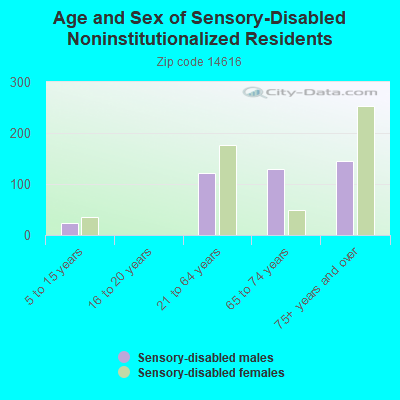
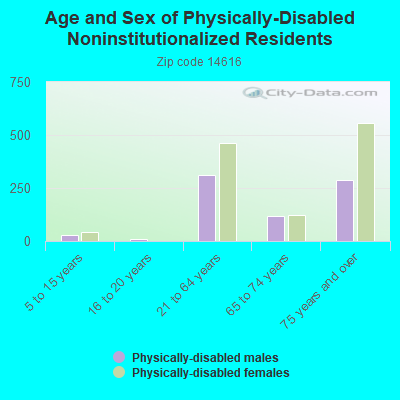
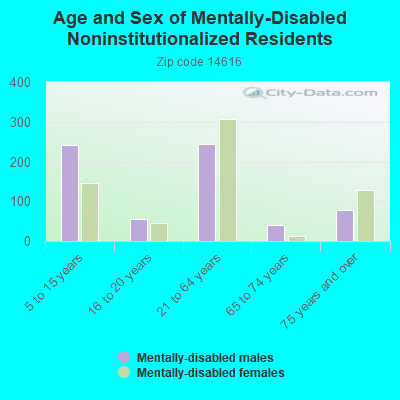
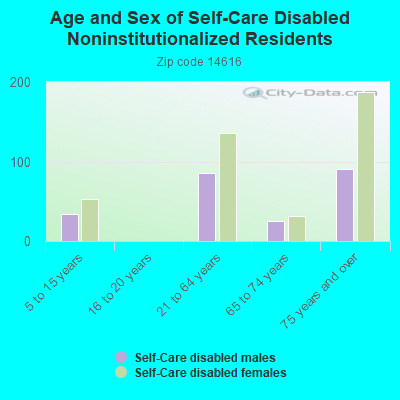
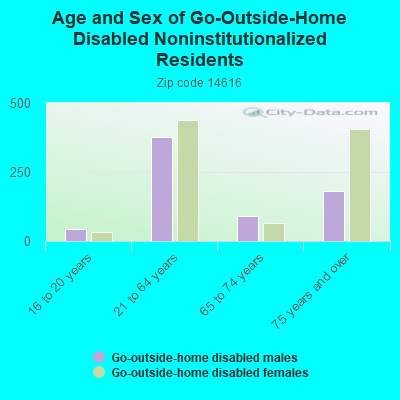
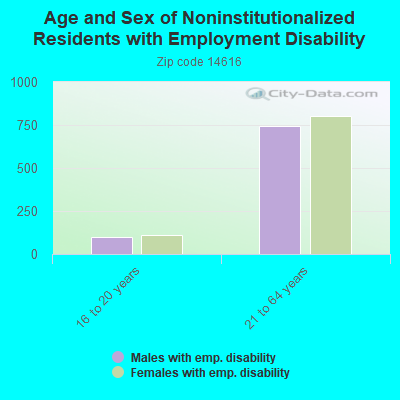
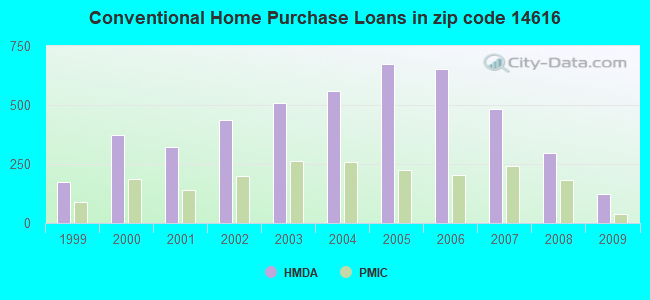
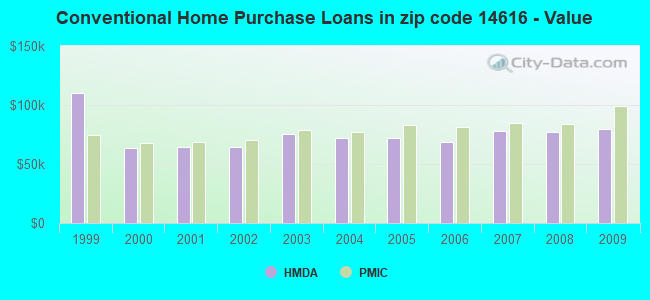
 Based on the data from the years 2002 - 2018 the average number of fire incidents per year is 99. The highest number of fires - 204 took place in 2007, and the least - 13 in 2005. The data has a declining trend.
 When looking into fire subcategories, the most incidents belonged to: Structure Fires (56.3%), and Outside Fires (34.0%).