Estimated zip code population in 2022: 21,641 Zip code population in 2010: 22,789 Zip code population in 2000: 22,967
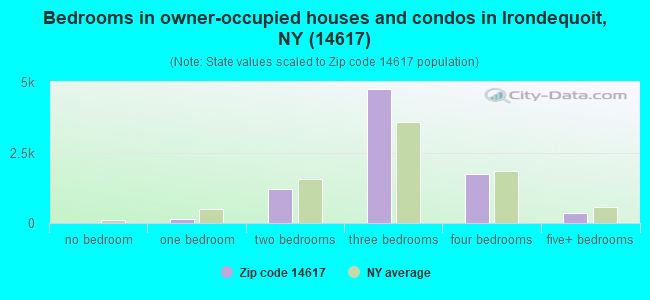
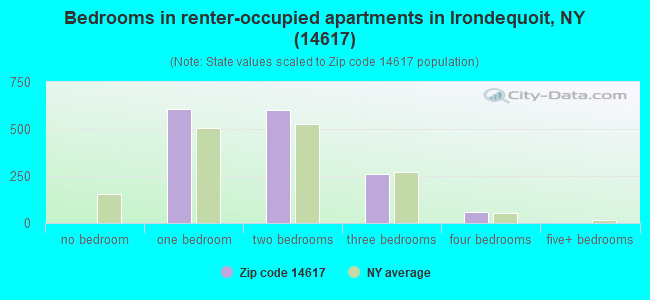
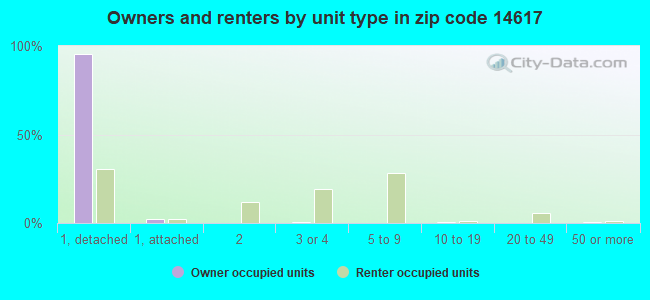
Houses and condos: 10,062 Renter-occupied apartments: 1,540
% of renters here:
16%
State:
46%
March 2022 cost of living index in zip code 14617: 102.0 (near average, U.S. average is 100)
Land area: 7.7 sq. mi. Water area: 0.4 sq. mi.
Population density: 2,818 people per square mile
(average).
OSM Map
General Map
Google Map
MSN Map
OSM Map
General Map
Google Map
MSN Map
OSM Map
General Map
Google Map
MSN Map
OSM Map
General Map
Google Map
MSN Map
Please wait while loading the map...
Real estate property taxes paid for housing units in 2022:
This zip code:
3.3% ($5,647)
New York:
1.5% ($6,180)
Median real estate property taxes paid for housing units with mortgages in 2022: $5,901 (3.4%) Median real estate property taxes paid for housing units with no mortgage in 2022: $5,139 (3.0%)
Business Search- 14 Million verified businesses
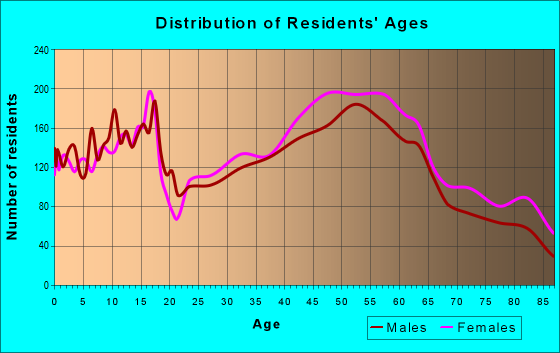
Males: 10,432
(48.2%)
Females: 11,208
(51.8%)
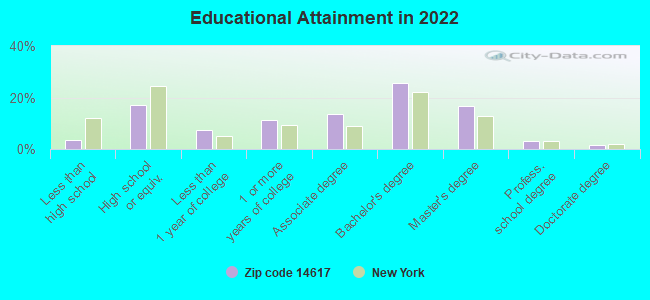
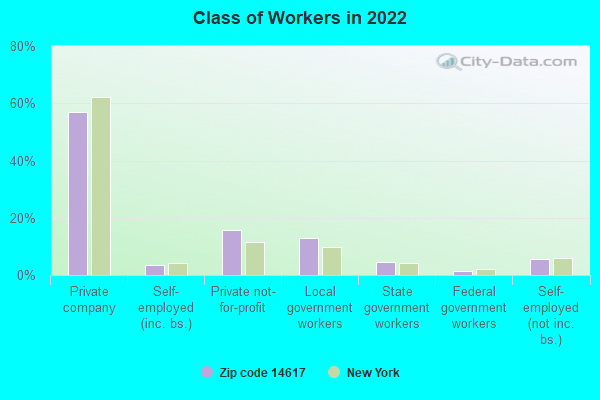
For population 25 years and over in 14617:
High school or higher: 96.9%
Bachelor's degree or higher: 47.1%
Graduate or professional degree: 21.6%
Unemployed: 3.7%
Mean travel time to work (commute): 21.3 minutes
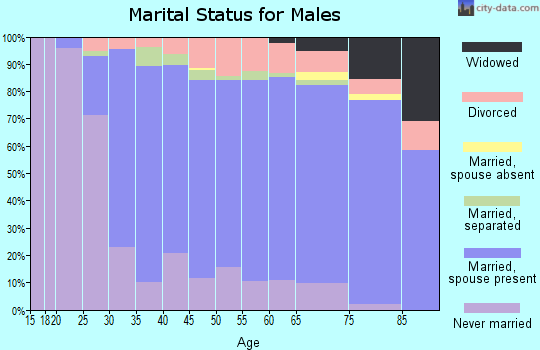
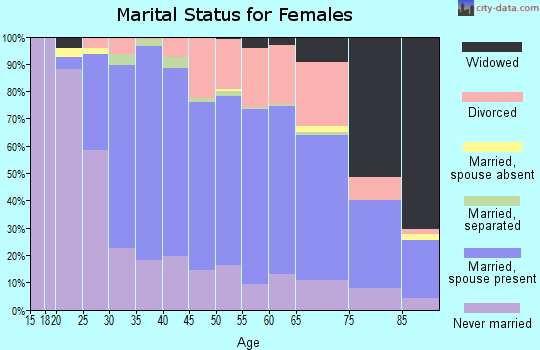
For population 15 years and over in 14617:
Never married: 28.0%
Now married: 53.9%
Separated: 1.2%
Widowed: 5.9%
Divorced: 10.9%
Zip code 14617 compared to state average:
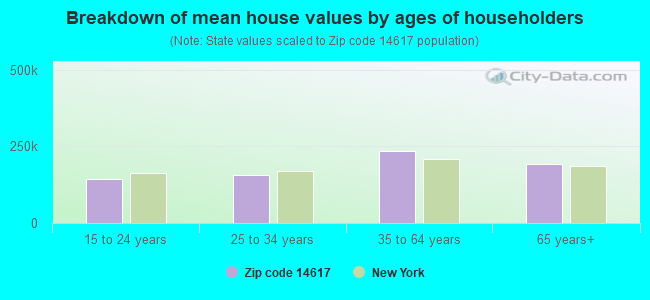
Median house value significantly below state average.
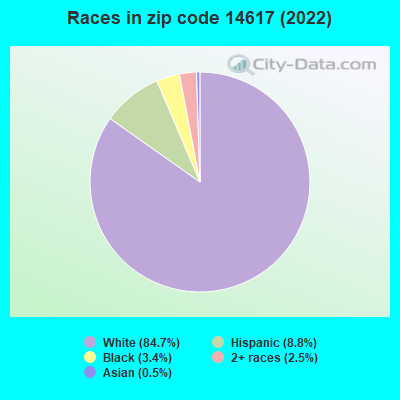
Black race population percentage significantly below state average.
Hispanic race population percentage below state average.
Median age above state average.
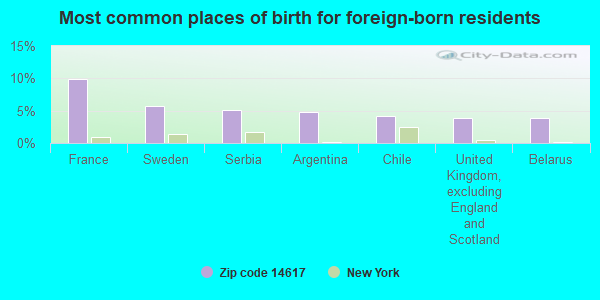
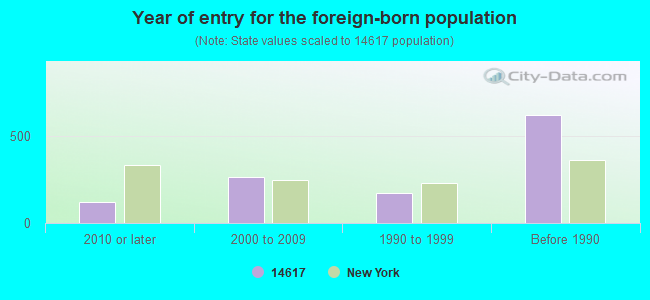
Foreign-born population percentage significantly below state average.
Renting percentage significantly below state average.
Estimated median house/condo value in 2022: $172,836
14617:
$172,836
New York:
$400,400
According to our research of New York and other state lists, there were 13 registered sex offenders living in 14617 zip code as of April 27, 2024. The ratio of all residents to sex offenders in zip code 14617 is 1,783 to 1. The ratio of registered sex offenders to all residents in this zip code is lower than the state average.
Median resident age:
This zip code:
44.6 years
New York median age:
40.0 years
Average household size:
This zip code:
2.2 people
New York:
2.5 people
Averages for the 2020 tax year for zip code 14617, filed in 2021:
Average Adjusted Gross Income (AGI) in 2020: $66,509 (Individual Income Tax Returns)
Here:
$66,509
State:
$90,930
Salary/wage: $57,991 (reported on 79.8% of returns)
Here:
$57,991
State:
$72,104
(% of AGI for various income ranges: 1042.4% for AGIs below $25k, 3424.9% for AGIs $25k-50k, 6181.8% for AGIs $50k-75k, 9200.7% for AGIs $75k-100k, 16876.8% for AGIs $100k-200k, 62223.6% for AGIs over 200k)
Taxable interest for individuals: $835 (reported on 49.7% of returns)
This zip code:
$835
New York:
$3,075
(% of AGI for various income ranges: 25.2% for AGIs below $25k, 23.8% for AGIs $25k-50k, 57.3% for AGIs $50k-75k, 72.8% for AGIs $75k-100k, 98.3% for AGIs $100k-200k, 1070.9% for AGIs over 200k)
Ordinary dividends: $5,020 (reported on 25.2% of returns)
Here:
$5,020
State:
$11,095
(% of AGI for various income ranges: 44.9% for AGIs below $25k, 51.2% for AGIs $25k-50k, 115.5% for AGIs $50k-75k, 171.8% for AGIs $75k-100k, 356.5% for AGIs $100k-200k, 4937.3% for AGIs over 200k)
Net capital gain/loss in AGI: +$9,782 (reported on 21.0% of returns)
Here:
+$9,782
State:
+$44,925
(% of AGI for various income ranges: 15.8% for AGIs below $25k, 39.8% for AGIs $25k-50k, 77.6% for AGIs $50k-75k, 175.7% for AGIs $75k-100k, 512.0% for AGIs $100k-200k, 13326.4% for AGIs over 200k)
Profit/loss from business: +$14,526 (reported on 13.5% of returns)
Here:
+$14,526
State:
+$14,940
(% of AGI for various income ranges: 87.8% for AGIs below $25k, 130.7% for AGIs $25k-50k, 211.9% for AGIs $50k-75k, 256.8% for AGIs $75k-100k, 603.5% for AGIs $100k-200k, 5264.5% for AGIs over 200k)
Taxable individual retirement arrangement distribution: $19,768 (reported on 14.7% of returns)
14617:
$19,768
New York:
$19,609
(% of AGI for various income ranges: 114.0% for AGIs below $25k, 189.1% for AGIs $25k-50k, 362.4% for AGIs $50k-75k, 608.7% for AGIs $75k-100k, 1013.3% for AGIs $100k-200k, 4133.6% for AGIs over 200k)
Self-employed (Keogh) retirement plans: $22,044 (reported on 0.7% of returns)
14617:
$22,044
New York:
$32,497
(% of AGI for various income ranges: 58.4% for AGIs $100k-200k, 1108.2% for AGIs over 200k)
Total itemized deductions: $25,472 (reported on 7.0% of returns)
Here:
$25,472
State:
$39,326
(% of AGI for various income ranges: 43.1% for AGIs below $25k, 122.0% for AGIs $25k-50k, 298.0% for AGIs $50k-75k, 426.1% for AGIs $75k-100k, 458.8% for AGIs $100k-200k, 3341.8% for AGIs over 200k)
Charity contributions: $7,475 (reported on 5.2% of returns)
Here:
$7,475
State:
$15,420
(% of AGI for various income ranges: 4.2% for AGIs below $25k, 13.4% for AGIs $25k-50k, 31.0% for AGIs $50k-75k, 55.3% for AGIs $75k-100k, 108.4% for AGIs $100k-200k, 1839.1% for AGIs over 200k)
Taxes paid: $8,354 (reported on 7.0% of returns)
14617:
$8,354
State:
$9,183
(% of AGI for various income ranges: 11.7% for AGIs below $25k, 37.3% for AGIs $25k-50k, 118.2% for AGIs $50k-75k, 186.2% for AGIs $75k-100k, 134.3% for AGIs $100k-200k, 699.1% for AGIs over 200k)
Earned income credit: $2,095 (reported on 9.6% of returns)
Here:
$2,095
State:
$2,138
(% of AGI for various income ranges: 63.1% for AGIs below $25k, 46.9% for AGIs $25k-50k, 0.6% for AGIs $50k-75k)
Percentage of individuals using paid preparers for their 2020 taxes: 94.6%
Here:
95%
State:
95%
(% for various income ranges: 93.3% for AGIs below $25k, 94.6% for AGIs $25k-50k, 94.9% for AGIs $50k-75k, 95.2% for AGIs $75k-100k, 96.0% for AGIs $100k-200k, 94.4% for AGIs over 200k)
Averages for the 2012 tax year for zip code 14617, filed in 2013:
Average Adjusted Gross Income (AGI) in 2012: $55,667 (Individual Income Tax Returns)
Here:
$55,667
State:
$77,088
Salary/wage: $48,612 (reported on 81.4% of returns)
Here:
$48,612
State:
$60,593
(% of AGI for various income ranges: 66.9% for AGIs below $25k, 73.6% for AGIs $25k-50k, 75.6% for AGIs $50k-75k, 74.5% for AGIs $75k-100k, 75.0% for AGIs $100k-200k, 48.2% for AGIs over 200k)
Taxable interest for individuals: $790 (reported on 54.5% of returns)
This zip code:
$790
New York:
$3,125
(% of AGI for various income ranges: 1.3% for AGIs below $25k, 0.7% for AGIs $25k-50k, 0.4% for AGIs $50k-75k, 0.7% for AGIs $75k-100k, 0.6% for AGIs $100k-200k, 1.7% for AGIs over 200k)
Ordinary dividends: $4,184 (reported on 28.6% of returns)
Here:
$4,184
State:
$10,299
(% of AGI for various income ranges: 3.3% for AGIs below $25k, 1.6% for AGIs $25k-50k, 1.5% for AGIs $50k-75k, 1.4% for AGIs $75k-100k, 1.9% for AGIs $100k-200k, 5.1% for AGIs over 200k)
Net capital gain/loss in AGI: +$5,450 (reported on 20.6% of returns)
Here:
+$5,450
State:
+$42,474
(% of AGI for various income ranges: 0.1% for AGIs $25k-50k, 0.3% for AGIs $50k-75k, 0.5% for AGIs $75k-100k, 1.2% for AGIs $100k-200k, 13.0% for AGIs over 200k)
Profit/loss from business: +$13,303 (reported on 13.0% of returns)
Here:
+$13,303
State:
+$16,168
(% of AGI for various income ranges: 4.9% for AGIs below $25k, 3.2% for AGIs $25k-50k, 2.1% for AGIs $50k-75k, 2.6% for AGIs $75k-100k, 2.7% for AGIs $100k-200k, 5.0% for AGIs over 200k)
Taxable individual retirement arrangement distribution: $14,909 (reported on 16.1% of returns)
14617:
$14,909
New York:
$17,621
(% of AGI for various income ranges: 6.5% for AGIs below $25k, 4.7% for AGIs $25k-50k, 3.6% for AGIs $50k-75k, 4.3% for AGIs $75k-100k, 4.1% for AGIs $100k-200k, 4.2% for AGIs over 200k)
Self-employment retirement plans: $17,009 (reported on 0.9% of returns)
14617:
$17,009
New York:
$27,330
(% of AGI for various income ranges: 0.3% for AGIs $50k-75k, 0.3% for AGIs $100k-200k, 1.2% for AGIs over 200k)
Total itemized deductions: $18,641 (21% of AGI, reported on 42.4% of returns)
Here:
$18,641
State:
$34,985
Here:
20.7% of AGI
State:
21.3% of AGI
(% of AGI for various income ranges: 12.1% for AGIs below $25k, 12.1% for AGIs $25k-50k, 14.1% for AGIs $50k-75k, 14.3% for AGIs $75k-100k, 15.6% for AGIs $100k-200k, 14.7% for AGIs over 200k)
Charity contributions: $2,568 (reported on 36.8% of returns)
Here:
$2,568
State:
$5,572
(% of AGI for various income ranges: 0.9% for AGIs below $25k, 1.2% for AGIs $25k-50k, 1.6% for AGIs $50k-75k, 1.7% for AGIs $75k-100k, 2.0% for AGIs $100k-200k, 2.3% for AGIs over 200k)
Taxes paid: $9,839 (reported on 42.4% of returns)
14617:
$9,839
State:
$18,656
(% of AGI for various income ranges: 4.0% for AGIs below $25k, 5.5% for AGIs $25k-50k, 7.0% for AGIs $50k-75k, 7.6% for AGIs $75k-100k, 9.1% for AGIs $100k-200k, 8.9% for AGIs over 200k)
Earned income credit: $1,844 (reported on 11.2% of returns)
Here:
$1,844
State:
$2,230
(% of AGI for various income ranges: 3.6% for AGIs below $25k, 0.8% for AGIs $25k-50k)
Percentage of individuals using paid preparers for their 2012 taxes: 52.8%
Here:
53%
State:
66%
(% for various income ranges: 46.6% for AGIs below $25k, 51.4% for AGIs $25k-50k, 56.3% for AGIs $50k-75k, 57.7% for AGIs $75k-100k, 59.2% for AGIs $100k-200k, 81.0% for AGIs over 200k)
Averages for the 2004 tax year for zip code 14617, filed in 2005:
Average Adjusted Gross Income (AGI) in 2004: $49,314 (Individual Income Tax Returns)
Here:
$49,314
State:
$59,519
Salary/wage: $43,317 (reported on 80.2% of returns)
Here:
$43,317
State:
$50,673
(% of AGI for various income ranges: 93.2% for AGIs below $10k, 61.0% for AGIs $10k-25k, 73.5% for AGIs $25k-50k, 75.2% for AGIs $50k-75k, 79.6% for AGIs $75k-100k, 61.2% for AGIs over 100k)
Taxable interest for individuals: $1,337 (reported on 67.8% of returns)
This zip code:
$1,337
New York:
$2,377
(% of AGI for various income ranges: 7.8% for AGIs below $10k, 3.6% for AGIs $10k-25k, 1.9% for AGIs $25k-50k, 1.3% for AGIs $50k-75k, 1.1% for AGIs $75k-100k, 1.9% for AGIs over 100k)
Taxable dividends: $2,595 (reported on 40.6% of returns)
Here:
$2,595
State:
$5,394
(% of AGI for various income ranges: 8.2% for AGIs below $10k, 3.5% for AGIs $10k-25k, 1.9% for AGIs $25k-50k, 1.7% for AGIs $50k-75k, 1.3% for AGIs $75k-100k, 2.5% for AGIs over 100k)
Net capital gain/loss: +$6,588 (reported on 28.8% of returns)
Here:
+$6,588
State:
+$23,581
(% of AGI for various income ranges: -1.8% for AGIs below $10k, 0.5% for AGIs $10k-25k, 0.6% for AGIs $25k-50k, 0.9% for AGIs $50k-75k, 0.9% for AGIs $75k-100k, 10.1% for AGIs over 100k)
Profit/loss from business: +$11,633 (reported on 12.8% of returns)
Here:
+$11,633
State:
+$13,809
(% of AGI for various income ranges: 7.0% for AGIs below $10k, 5.2% for AGIs $10k-25k, 2.9% for AGIs $25k-50k, 2.3% for AGIs $50k-75k, 2.4% for AGIs $75k-100k, 3.3% for AGIs over 100k)
IRA payment deduction: $2,958 (reported on 2.7% of returns)
14617:
$2,958
New York:
$3,115
(% of AGI for various income ranges: 0.2% for AGIs below $10k, 0.3% for AGIs $10k-25k, 0.3% for AGIs $25k-50k, 0.1% for AGIs $50k-75k, 0.1% for AGIs $75k-100k, 0.1% for AGIs over 100k)
Self-employed pension: $10,611 (reported on 1.0% of returns)
Here:
$10,611
New York:
$19,016
(% of AGI for various income ranges: 0.1% for AGIs $25k-50k, 0.1% for AGIs $50k-75k, 0.2% for AGIs $75k-100k, 0.4% for AGIs over 100k)
Total itemized deductions: $16,358 (21% of AGI, reported on 46.5% of returns)
Here:
$16,358
State:
$25,864
Here:
20.9% of AGI
State:
21.9% of AGI
(% of AGI for various income ranges: 13.7% for AGIs below $10k, 13.1% for AGIs $10k-25k, 15.0% for AGIs $25k-50k, 16.6% for AGIs $50k-75k, 17.3% for AGIs $75k-100k, 14.3% for AGIs over 100k)
Charity contributions deductions: $2,576 (3% of AGI, reported on 43.4% of returns)
Here:
$2,576
State:
$4,439
Here:
3.2% of AGI
State:
3.6% of AGI
(% of AGI for various income ranges: 0.9% for AGIs below $10k, 1.2% for AGIs $10k-25k, 1.9% for AGIs $25k-50k, 2.3% for AGIs $50k-75k, 2.5% for AGIs $75k-100k, 2.5% for AGIs over 100k)
Total tax: $7,024 (reported on 79.1% of returns)
14617:
$7,024
State:
$11,730
(% of AGI for various income ranges: 2.7% for AGIs below $10k, 4.2% for AGIs $10k-25k, 7.3% for AGIs $25k-50k, 8.9% for AGIs $50k-75k, 10.0% for AGIs $75k-100k, 17.4% for AGIs over 100k)
Earned income credit: $1,434 (reported on 8.8% of returns)
Here:
$1,434
State:
$1,757
Percentage of individuals using paid preparers for their 2004 taxes: 60.2%
Here:
60%
State:
67%
(% for various income ranges: 50.0% for AGIs below $10k, 63.4% for AGIs $10k-25k, 62.6% for AGIs $25k-50k, 62.0% for AGIs $50k-75k, 60.0% for AGIs $75k-100k, 65.9% for AGIs over 100k)
Likely homosexual households (counted as self-reported same-sex unmarried-partner households)
Lesbian couples: 0.4% of all households
Gay men: 0.2% of all households
Household received Food Stamps/SNAP in the past 12 months: 648 Household did not receive Food Stamps/SNAP in the past 12 months: 8,974
Women who had a birth in the past 12 months: 145 (102 now married, 43 unmarried) Women who did not have a birth in the past 12 months: 4,116 (1,831 now married, 2,269 unmarried)
Housing units in zip code 14617 with a mortgage: 5,341 (947 second mortgage, 899 both second mortgage and home equity loan) Houses without a mortgage: 377
Median monthly owner costs for units with a mortgage: $1,523 Median monthly owner costs for units without a mortgage: $718
Residents with income below the poverty level in 2022:
This zip code:
5.9%
Whole state:
14.3%
Residents with income below 50% of the poverty level in 2022:
This zip code:
3.6%
Whole state:
6.8%
Median number of rooms in houses and condos:
Here:
6.7
State:
6.3
Median number of rooms in apartments:
Here:
4.1
State:
3.8
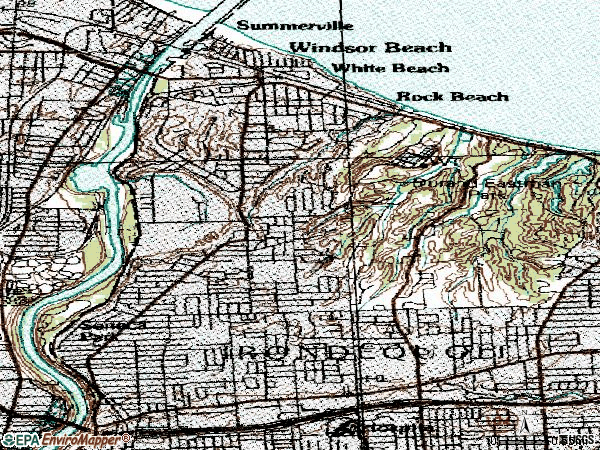
Notable locations in this zip code not listed on our city pages
Notable locations in zip code 14617: Genesee Yacht Club (A), Durand Eastman Golf Course (B), Frank E Van Lare Treatment Facility (C), Shumway Marine (D), Rochester Yacht Club (E), Irondequoit Community Center (F), Irondequoit Public Library Pauline Evans Branch (G), Irondequoit Town Courthouse (H), Irondequoit Town Hall (I), Saint Paul Boulevard Fire Department (J). Display/hide their locations on the map
Shopping Centers: Stutson Bridge Plaza Shopping Center (1), Ridge Hill Mall Shopping Center (2), Ridge - Hudson Plaza Shopping Center (3), Georgetown Plaza Shopping Center (4). Display/hide their locations on the map
Churches in zip code 14617 include: Christ the King Church (A), Summerville Presbyterian Church (B), Trinity Communion Church (C), Lutheran Church of the Resurrection (D), Saint John's Lutheran Church (E), Saint Josaphat's Ukrainian Church (F), Saint Margaret Mary Church (G), Saint Mary the Protectoress Ukrainian Orthodox Church (H), Saint Thomas the Apostle Church (I). Display/hide their locations on the map
2,942 married couples with children.
1,246 single-parent households (215 men, 1,031 women).
92.3% of residents of 14617 zip code speak English at home.
4.4% of residents speak Spanish at home (75% very well, 11% well, 13% not well, 1% not at all).
2.6% of residents speak other Indo-European language at home (72% very well, 16% well, 12% not well).
0.2% of residents speak Asian or Pacific Island language at home (100% very well).
0.5% of residents speak other language at home (31% very well, 28% well, 14% not well, 27% not at all).
Foreign born population: 924 (4.3%) (79.6% of them are naturalized citizens)
Facilities with environmental interests located in this zip code:
COLEBROOK SCHOOL ( in ROCHESTER, NY)
(Geographic Names Information System) (National Center for Education Statistics) - STATE ID-260803060009 Organizations: WEST IRONDEQUOIT CSD (SCHOOL DISTRICT)
IRONDEQUOIT HS ( in ROCHESTER, NY)
(National Center for Education Statistics) - STATE ID-260803060005 Organizations: WEST IRONDEQUOIT CSD (SCHOOL DISTRICT)
IROQUOIS MS ( in ROCHESTER, NY)
(National Center for Education Statistics) - STATE ID-260803060003 Organizations: WEST IRONDEQUOIT CSD (SCHOOL DISTRICT)
IRONDEQUOIT TOWN HALL (1280 TITUS AVE in ROCHESTER, NY)
(Resource Conservation and Recovery Act (tracking hazardous waste)) Organizations: TOWN OF IRONDEQUOIT (CONTACT/OPERATOR)
IRONDEQUOIT TOWN OF (MARINA DR RIGHT OF WAY FROM in IRONDEQUOIT, NY)
Large Quantity Generators, more that 1000 kg of hazardous waste/month (Resource Conservation and Recovery Act (tracking hazardous waste)) - notification Organizations: TOWN OF IRONDEQUOIT (CONTACT/OWNER)
CUMBERLAND FARMS #3225 (2292 HUDSON AVE in IRONDEQUOIT, NY)
GREGERICA DEVELOPMENT CORP (PATTONWOOD DR in IRONDEQUOIT, NY)
(Resource Conservation and Recovery Act (tracking hazardous waste))
IRONDEQUOIT TOWN OF - OPERATIONS (25 KINGS HWY in IRONDEQUOIT, NY)
Conditionally Exempt Small Quantity Generators, less than 100 kg/month of hazardous waste (Resource Conservation and Recovery Act (tracking hazardous waste)) - notification Organizations: TOWN OF IRONDEQUOIT (CONTACT/OWNER)
INDEPENDENT LIVING FOR SENIORS VIAHEALTH (2966 HUDSON AVENUE in ROCHESTER, NY)
ENFORCEMENT/COMPLIANCE ACTIVITY (Integrated Compliance Information System)
Housing units lacking complete plumbing facilities: 0.2% Housing units lacking complete kitchen facilities: 0.3%
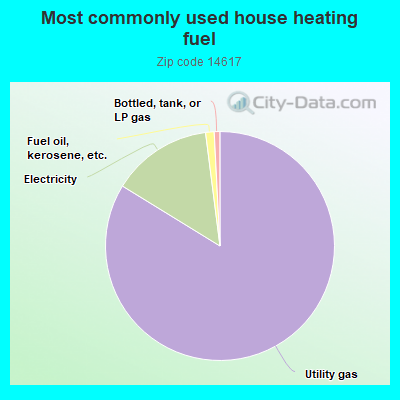
83.1%Utility gas
14.1%Electricity
1.2%Fuel oil, kerosene, etc.
0.8%Bottled, tank, or LP gas
Population in 1990: 24,296.
Place of birth for U.S.-born residents:
This state: 17,962
Northeast: 1,037
Midwest: 635
South: 483
West: 258
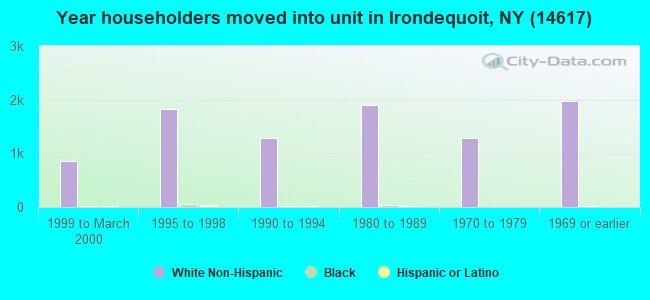
72% of the 14617 zip code residents lived in the same house 5 years ago. Out of people who lived in different houses, 86% lived in this county. Out of people who lived in different counties, 50% lived in New York.
93% of the 14617 zip code residents lived in the same house 1 year ago. Out of people who lived in different houses, 80% moved from this county. Out of people who lived in different houses, 16% moved from different county within same state. Out of people who lived in different houses, 1% moved from different state.
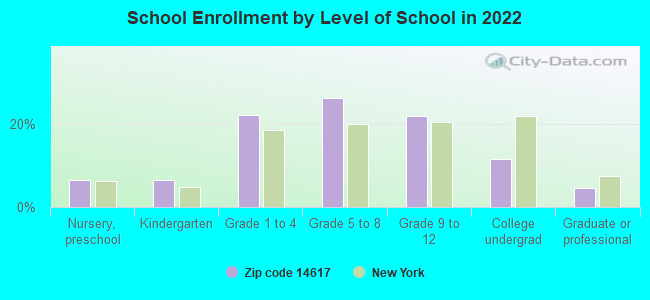
Private vs. public school enrollment:
Students in private schools in grades 1 to 8 (elementary and middle school): 153
Here:
6.9%
New York:
15.6%
Students in private schools in grades 9 to 12 (high school): 41
Here:
4.2%
New York:
15.0%
Students in private undergraduate colleges: 85
Here:
16.4%
New York:
39.2%
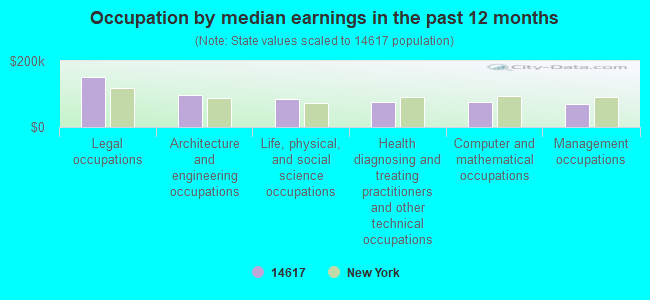
Occupation by median earnings in the past 12 months ($)
152,741Legal occupations
97,302Architecture and engineering occupations
85,093Life, physical, and social science occupations
75,223Health diagnosing and treating practitioners and other technical occupations
75,149Computer and mathematical occupations
70,316Management occupations
Companies with federal contracts located in this zip code:
BENDEX CONSTRUCTION COMPANY (150 CEDARGROVE DR in ROCHESTER, NY; small business) : $62,508 in 2 contractsin 2000
$38,508 with Army for Maintenance, Repair or Alteration of Real Property -- Family Housing Facilities. Taking place in MA. Signed on 2000-11-30. Completion date: 2001-05-30.
$24,000 with United States Coast Guard (disused code: now 7008) for Maintenance, Repair or Alteration of Real Property -- Other Administrative Facilities and Service Buildings. Signed on 2000-08-15. Completion date: 2000-11-15.
SHUMWAY MARINE (70 PATTONWOOD DR. in ROCHESTER, NY; small business)
$3,498 with U.S. Customs Service for Maintenance, Repair and Rebuilding of Equipment -- Ship and Marine Equipment. Signed on 2005-09-27. Completion date: 2005-09-30.
Top industries in this zip code by the number of employees in 2005:
2002 - 2018 National Fire Incident Reporting System (NFIRS) incidents
Based on the data from the years 2002 - 2018 the average number of fire incidents per year is 69. The highest number of fires - 112 took place in 2010, and the least - 11 in 2004. The data has a rising trend.
When looking into fire subcategories, the most incidents belonged to: Structure Fires (46.9%), and Outside Fires (33.0%).
Fire incident types reported to NFIRS in Zip Code 14617
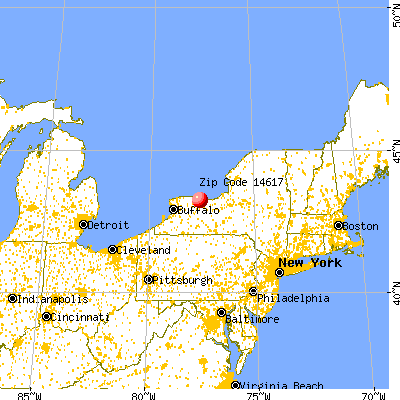


 Nearest zip codes: 14621, 14622, 14605, 14609, 14613, 14616.


 Based on the data from the years 2002 - 2018 the average number of fire incidents per year is 69. The highest number of fires - 112 took place in 2010, and the least - 11 in 2004. The data has a rising trend.
 When looking into fire subcategories, the most incidents belonged to: Structure Fires (46.9%), and Outside Fires (33.0%).