Estimated zip code population in 2022: 12,567
Zip code population in 2010: 12,108
Zip code population in 2000: 12,027
Houses and condos: 6,103
Renter-occupied apartments: 1,082
% of renters here:
18%State:
46%
March 2022 cost of living index in zip code 14622: 101.8
(near average, U.S. average is 100)
Land area: 4.6
sq. mi.
Water area: 1.0
sq. mi.
Population density: 2,727 people per square mile (average).
OSM Map
General Map
Google Map
MSN Map
OSM Map
General Map
Google Map
MSN Map
OSM Map
General Map
Google Map
MSN Map
OSM Map
General Map
Google Map
MSN Map
Please wait while loading the map...
Real estate property taxes paid for housing units in 2022:
This zip code:
3.3% ($4,959)New York:
1.5% ($6,180)
Median real estate property taxes paid for housing units with mortgages in 2022: $5,075 (3.4%)
Median real estate property taxes paid for housing units with no mortgage in 2022: $4,792 (3.0%)
Profiles of local businesses
Business Search - 14 Million verified businesses
Males: 6,297 Females: 6,270
For population 25 years and over in 14622:
High school or higher: 90.3%Bachelor's degree or higher: 33.3%Graduate or professional degree: 14.8%Unemployed: 3.6%Mean travel time to work (commute): 20.4 minutes
For population 15 years and over in 14622:
Never married: 27.3%Now married: 54.1%Separated: 1.5%Widowed: 5.4%Divorced: 11.7%
Zip code 14622 compared to state average:
Median house value significantly below state average. Black race population percentage below state average. Hispanic race population percentage below state average. Median age significantly above state average. Foreign-born population percentage significantly below state average. Renting percentage significantly below state average. Length of stay since moving in above state average. Number of college students below state average. 9,723 77.4% White 1,211 9.6% Hispanic or Latino 620 4.9% Black 534 4.3% Two or more races 420 3.3% Asian 51 0.4% Native Hawaiian and Other 5 0.04% American Indian
Data:
Median household income ($)
Median household income (% change since 2000)
Household income diversity
Ratio of average income to average house value (%)
Ratio of average income to average rent
Median household income ($) - White
Median household income ($) - Black or African American
Median household income ($) - Asian
Median household income ($) - Hispanic or Latino
Median household income ($) - American Indian and Alaska Native
Median household income ($) - Multirace
Median household income ($) - Other Race
Median household income for houses/condos with a mortgage ($)
Median household income for apartments without a mortgage ($)
Races - White alone (%)
Races - White alone (% change since 2000)
Races - Black alone (%)
Races - Black alone (% change since 2000)
Races - American Indian alone (%)
Races - American Indian alone (% change since 2000)
Races - Asian alone (%)
Races - Asian alone (% change since 2000)
Races - Hispanic (%)
Races - Hispanic (% change since 2000)
Races - Native Hawaiian and Other Pacific Islander alone (%)
Races - Native Hawaiian and Other Pacific Islander alone (% change since 2000)
Races - Two or more races (%)
Races - Two or more races (% change since 2000)
Races - Other race alone (%)
Races - Other race alone (% change since 2000)
Racial diversity
Unemployment (%)
Unemployment (% change since 2000)
Unemployment (%) - White
Unemployment (%) - Black or African American
Unemployment (%) - Asian
Unemployment (%) - Hispanic or Latino
Unemployment (%) - American Indian and Alaska Native
Unemployment (%) - Multirace
Unemployment (%) - Other Race
Population density (people per square mile)
Population - Males (%)
Population - Females (%)
Population - Males (%) - White
Population - Males (%) - Black or African American
Population - Males (%) - Asian
Population - Males (%) - Hispanic or Latino
Population - Males (%) - American Indian and Alaska Native
Population - Males (%) - Multirace
Population - Males (%) - Other Race
Population - Females (%) - White
Population - Females (%) - Black or African American
Population - Females (%) - Asian
Population - Females (%) - Hispanic or Latino
Population - Females (%) - American Indian and Alaska Native
Population - Females (%) - Multirace
Population - Females (%) - Other Race
Coronavirus confirmed cases (Apr 27, 2024)
Deaths caused by coronavirus (Apr 27, 2024)
Coronavirus confirmed cases (per 100k population) (Apr 27, 2024)
Deaths caused by coronavirus (per 100k population) (Apr 27, 2024)
Daily increase in number of cases (Apr 27, 2024)
Weekly increase in number of cases (Apr 27, 2024)
Cases doubled (in days) (Apr 27, 2024)
Hospitalized patients (Apr 18, 2022)
Negative test results (Apr 18, 2022)
Total test results (Apr 18, 2022)
COVID Vaccine doses distributed (per 100k population) (Sep 19, 2023)
COVID Vaccine doses administered (per 100k population) (Sep 19, 2023)
COVID Vaccine doses distributed (Sep 19, 2023)
COVID Vaccine doses administered (Sep 19, 2023)
Likely homosexual households (%)
Likely homosexual households (% change since 2000)
Likely homosexual households - Lesbian couples (%)
Likely homosexual households - Lesbian couples (% change since 2000)
Likely homosexual households - Gay men (%)
Likely homosexual households - Gay men (% change since 2000)
Cost of living index
Median gross rent ($)
Median contract rent ($)
Median monthly housing costs ($)
Median house or condo value ($)
Median house or condo value ($ change since 2000)
Mean house or condo value by units in structure - 1, detached ($)
Mean house or condo value by units in structure - 1, attached ($)
Mean house or condo value by units in structure - 2 ($)
Mean house or condo value by units in structure by units in structure - 3 or 4 ($)
Mean house or condo value by units in structure - 5 or more ($)
Mean house or condo value by units in structure - Boat, RV, van, etc. ($)
Mean house or condo value by units in structure - Mobile home ($)
Median house or condo value ($) - White
Median house or condo value ($) - Black or African American
Median house or condo value ($) - Asian
Median house or condo value ($) - Hispanic or Latino
Median house or condo value ($) - American Indian and Alaska Native
Median house or condo value ($) - Multirace
Median house or condo value ($) - Other Race
Median resident age
Resident age diversity
Median resident age - Males
Median resident age - Females
Median resident age - White
Median resident age - Black or African American
Median resident age - Asian
Median resident age - Hispanic or Latino
Median resident age - American Indian and Alaska Native
Median resident age - Multirace
Median resident age - Other Race
Median resident age - Males - White
Median resident age - Males - Black or African American
Median resident age - Males - Asian
Median resident age - Males - Hispanic or Latino
Median resident age - Males - American Indian and Alaska Native
Median resident age - Males - Multirace
Median resident age - Males - Other Race
Median resident age - Females - White
Median resident age - Females - Black or African American
Median resident age - Females - Asian
Median resident age - Females - Hispanic or Latino
Median resident age - Females - American Indian and Alaska Native
Median resident age - Females - Multirace
Median resident age - Females - Other Race
Commute - mean travel time to work (minutes)
Travel time to work - Less than 5 minutes (%)
Travel time to work - Less than 5 minutes (% change since 2000)
Travel time to work - 5 to 9 minutes (%)
Travel time to work - 5 to 9 minutes (% change since 2000)
Travel time to work - 10 to 19 minutes (%)
Travel time to work - 10 to 19 minutes (% change since 2000)
Travel time to work - 20 to 29 minutes (%)
Travel time to work - 20 to 29 minutes (% change since 2000)
Travel time to work - 30 to 39 minutes (%)
Travel time to work - 30 to 39 minutes (% change since 2000)
Travel time to work - 40 to 59 minutes (%)
Travel time to work - 40 to 59 minutes (% change since 2000)
Travel time to work - 60 to 89 minutes (%)
Travel time to work - 60 to 89 minutes (% change since 2000)
Travel time to work - 90 or more minutes (%)
Travel time to work - 90 or more minutes (% change since 2000)
Marital status - Never married (%)
Marital status - Now married (%)
Marital status - Separated (%)
Marital status - Widowed (%)
Marital status - Divorced (%)
Median family income ($)
Median family income (% change since 2000)
Median non-family income ($)
Median non-family income (% change since 2000)
Median per capita income ($)
Median per capita income (% change since 2000)
Median family income ($) - White
Median family income ($) - Black or African American
Median family income ($) - Asian
Median family income ($) - Hispanic or Latino
Median family income ($) - American Indian and Alaska Native
Median family income ($) - Multirace
Median family income ($) - Other Race
Median year house/condo built
Median year apartment built
Year house built - Built 2005 or later (%)
Year house built - Built 2000 to 2004 (%)
Year house built - Built 1990 to 1999 (%)
Year house built - Built 1980 to 1989 (%)
Year house built - Built 1970 to 1979 (%)
Year house built - Built 1960 to 1969 (%)
Year house built - Built 1950 to 1959 (%)
Year house built - Built 1940 to 1949 (%)
Year house built - Built 1939 or earlier (%)
Average household size
Household density (households per square mile)
Average household size - White
Average household size - Black or African American
Average household size - Asian
Average household size - Hispanic or Latino
Average household size - American Indian and Alaska Native
Average household size - Multirace
Average household size - Other Race
Occupied housing units (%)
Vacant housing units (%)
Owner occupied housing units (%)
Renter occupied housing units (%)
Vacancy status - For rent (%)
Vacancy status - For sale only (%)
Vacancy status - Rented or sold, not occupied (%)
Vacancy status - For seasonal, recreational, or occasional use (%)
Vacancy status - For migrant workers (%)
Vacancy status - Other vacant (%)
Residents with income below the poverty level (%)
Residents with income below 50% of the poverty level (%)
Children below poverty level (%)
Poor families by family type - Married-couple family (%)
Poor families by family type - Male, no wife present (%)
Poor families by family type - Female, no husband present (%)
Poverty status for native-born residents (%)
Poverty status for foreign-born residents (%)
Poverty among high school graduates not in families (%)
Poverty among people who did not graduate high school not in families (%)
Residents with income below the poverty level (%) - White
Residents with income below the poverty level (%) - Black or African American
Residents with income below the poverty level (%) - Asian
Residents with income below the poverty level (%) - Hispanic or Latino
Residents with income below the poverty level (%) - American Indian and Alaska Native
Residents with income below the poverty level (%) - Multirace
Residents with income below the poverty level (%) - Other Race
Air pollution - Air Quality Index (AQI)
Air pollution - CO
Air pollution - NO2
Air pollution - SO2
Air pollution - Ozone
Air pollution - PM10
Air pollution - PM25
Air pollution - Pb
Crime - Murders per 100,000 population
Crime - Rapes per 100,000 population
Crime - Robberies per 100,000 population
Crime - Assaults per 100,000 population
Crime - Burglaries per 100,000 population
Crime - Thefts per 100,000 population
Crime - Auto thefts per 100,000 population
Crime - Arson per 100,000 population
Crime - City-data.com crime index
Crime - Violent crime index
Crime - Property crime index
Crime - Murders per 100,000 population (5 year average)
Crime - Rapes per 100,000 population (5 year average)
Crime - Robberies per 100,000 population (5 year average)
Crime - Assaults per 100,000 population (5 year average)
Crime - Burglaries per 100,000 population (5 year average)
Crime - Thefts per 100,000 population (5 year average)
Crime - Auto thefts per 100,000 population (5 year average)
Crime - Arson per 100,000 population (5 year average)
Crime - City-data.com crime index (5 year average)
Crime - Violent crime index (5 year average)
Crime - Property crime index (5 year average)
1996 Presidential Elections Results (%) - Democratic Party (Clinton)
1996 Presidential Elections Results (%) - Republican Party (Dole)
1996 Presidential Elections Results (%) - Other
2000 Presidential Elections Results (%) - Democratic Party (Gore)
2000 Presidential Elections Results (%) - Republican Party (Bush)
2000 Presidential Elections Results (%) - Other
2004 Presidential Elections Results (%) - Democratic Party (Kerry)
2004 Presidential Elections Results (%) - Republican Party (Bush)
2004 Presidential Elections Results (%) - Other
2008 Presidential Elections Results (%) - Democratic Party (Obama)
2008 Presidential Elections Results (%) - Republican Party (McCain)
2008 Presidential Elections Results (%) - Other
2012 Presidential Elections Results (%) - Democratic Party (Obama)
2012 Presidential Elections Results (%) - Republican Party (Romney)
2012 Presidential Elections Results (%) - Other
2016 Presidential Elections Results (%) - Democratic Party (Clinton)
2016 Presidential Elections Results (%) - Republican Party (Trump)
2016 Presidential Elections Results (%) - Other
2020 Presidential Elections Results (%) - Democratic Party (Biden)
2020 Presidential Elections Results (%) - Republican Party (Trump)
2020 Presidential Elections Results (%) - Other
Ancestries Reported - Arab (%)
Ancestries Reported - Czech (%)
Ancestries Reported - Danish (%)
Ancestries Reported - Dutch (%)
Ancestries Reported - English (%)
Ancestries Reported - French (%)
Ancestries Reported - French Canadian (%)
Ancestries Reported - German (%)
Ancestries Reported - Greek (%)
Ancestries Reported - Hungarian (%)
Ancestries Reported - Irish (%)
Ancestries Reported - Italian (%)
Ancestries Reported - Lithuanian (%)
Ancestries Reported - Norwegian (%)
Ancestries Reported - Polish (%)
Ancestries Reported - Portuguese (%)
Ancestries Reported - Russian (%)
Ancestries Reported - Scotch-Irish (%)
Ancestries Reported - Scottish (%)
Ancestries Reported - Slovak (%)
Ancestries Reported - Subsaharan African (%)
Ancestries Reported - Swedish (%)
Ancestries Reported - Swiss (%)
Ancestries Reported - Ukrainian (%)
Ancestries Reported - United States (%)
Ancestries Reported - Welsh (%)
Ancestries Reported - West Indian (%)
Ancestries Reported - Other (%)
Educational Attainment - No schooling completed (%)
Educational Attainment - Less than high school (%)
Educational Attainment - High school or equivalent (%)
Educational Attainment - Less than 1 year of college (%)
Educational Attainment - 1 or more years of college (%)
Educational Attainment - Associate degree (%)
Educational Attainment - Bachelor's degree (%)
Educational Attainment - Master's degree (%)
Educational Attainment - Professional school degree (%)
Educational Attainment - Doctorate degree (%)
School Enrollment - Nursery, preschool (%)
School Enrollment - Kindergarten (%)
School Enrollment - Grade 1 to 4 (%)
School Enrollment - Grade 5 to 8 (%)
School Enrollment - Grade 9 to 12 (%)
School Enrollment - College undergrad (%)
School Enrollment - Graduate or professional (%)
School Enrollment - Not enrolled in school (%)
School enrollment - Public schools (%)
School enrollment - Private schools (%)
School enrollment - Not enrolled (%)
Median number of rooms in houses and condos
Median number of rooms in apartments
Housing units lacking complete plumbing facilities (%)
Housing units lacking complete kitchen facilities (%)
Density of houses
Urban houses (%)
Rural houses (%)
Households with people 60 years and over (%)
Households with people 65 years and over (%)
Households with people 75 years and over (%)
Households with one or more nonrelatives (%)
Households with no nonrelatives (%)
Population in households (%)
Family households (%)
Nonfamily households (%)
Population in families (%)
Family households with own children (%)
Median number of bedrooms in owner occupied houses
Mean number of bedrooms in owner occupied houses
Median number of bedrooms in renter occupied houses
Mean number of bedrooms in renter occupied houses
Median number of vehichles in owner occupied houses
Mean number of vehichles in owner occupied houses
Median number of vehichles in renter occupied houses
Mean number of vehichles in renter occupied houses
Mortgage status - with mortgage (%)
Mortgage status - with second mortgage (%)
Mortgage status - with home equity loan (%)
Mortgage status - with both second mortgage and home equity loan (%)
Mortgage status - without a mortgage (%)
Average family size
Average family size - White
Average family size - Black or African American
Average family size - Asian
Average family size - Hispanic or Latino
Average family size - American Indian and Alaska Native
Average family size - Multirace
Average family size - Other Race
Geographical mobility - Same house 1 year ago (%)
Geographical mobility - Moved within same county (%)
Geographical mobility - Moved from different county within same state (%)
Geographical mobility - Moved from different state (%)
Geographical mobility - Moved from abroad (%)
Place of birth - Born in state of residence (%)
Place of birth - Born in other state (%)
Place of birth - Native, outside of US (%)
Place of birth - Foreign born (%)
Housing units in structures - 1, detached (%)
Housing units in structures - 1, attached (%)
Housing units in structures - 2 (%)
Housing units in structures - 3 or 4 (%)
Housing units in structures - 5 to 9 (%)
Housing units in structures - 10 to 19 (%)
Housing units in structures - 20 to 49 (%)
Housing units in structures - 50 or more (%)
Housing units in structures - Mobile home (%)
Housing units in structures - Boat, RV, van, etc. (%)
House/condo owner moved in on average (years ago)
Renter moved in on average (years ago)
Year householder moved into unit - Moved in 1999 to March 2000 (%)
Year householder moved into unit - Moved in 1995 to 1998 (%)
Year householder moved into unit - Moved in 1990 to 1994 (%)
Year householder moved into unit - Moved in 1980 to 1989 (%)
Year householder moved into unit - Moved in 1970 to 1979 (%)
Year householder moved into unit - Moved in 1969 or earlier (%)
Means of transportation to work - Drove car alone (%)
Means of transportation to work - Carpooled (%)
Means of transportation to work - Public transportation (%)
Means of transportation to work - Bus or trolley bus (%)
Means of transportation to work - Streetcar or trolley car (%)
Means of transportation to work - Subway or elevated (%)
Means of transportation to work - Railroad (%)
Means of transportation to work - Ferryboat (%)
Means of transportation to work - Taxicab (%)
Means of transportation to work - Motorcycle (%)
Means of transportation to work - Bicycle (%)
Means of transportation to work - Walked (%)
Means of transportation to work - Other means (%)
Working at home (%)
Industry diversity
Most Common Industries - Agriculture, forestry, fishing and hunting, and mining (%)
Most Common Industries - Agriculture, forestry, fishing and hunting (%)
Most Common Industries - Mining, quarrying, and oil and gas extraction (%)
Most Common Industries - Construction (%)
Most Common Industries - Manufacturing (%)
Most Common Industries - Wholesale trade (%)
Most Common Industries - Retail trade (%)
Most Common Industries - Transportation and warehousing, and utilities (%)
Most Common Industries - Transportation and warehousing (%)
Most Common Industries - Utilities (%)
Most Common Industries - Information (%)
Most Common Industries - Finance and insurance, and real estate and rental and leasing (%)
Most Common Industries - Finance and insurance (%)
Most Common Industries - Real estate and rental and leasing (%)
Most Common Industries - Professional, scientific, and management, and administrative and waste management services (%)
Most Common Industries - Professional, scientific, and technical services (%)
Most Common Industries - Management of companies and enterprises (%)
Most Common Industries - Administrative and support and waste management services (%)
Most Common Industries - Educational services, and health care and social assistance (%)
Most Common Industries - Educational services (%)
Most Common Industries - Health care and social assistance (%)
Most Common Industries - Arts, entertainment, and recreation, and accommodation and food services (%)
Most Common Industries - Arts, entertainment, and recreation (%)
Most Common Industries - Accommodation and food services (%)
Most Common Industries - Other services, except public administration (%)
Most Common Industries - Public administration (%)
Occupation diversity
Most Common Occupations - Management, business, science, and arts occupations (%)
Most Common Occupations - Management, business, and financial occupations (%)
Most Common Occupations - Management occupations (%)
Most Common Occupations - Business and financial operations occupations (%)
Most Common Occupations - Computer, engineering, and science occupations (%)
Most Common Occupations - Computer and mathematical occupations (%)
Most Common Occupations - Architecture and engineering occupations (%)
Most Common Occupations - Life, physical, and social science occupations (%)
Most Common Occupations - Education, legal, community service, arts, and media occupations (%)
Most Common Occupations - Community and social service occupations (%)
Most Common Occupations - Legal occupations (%)
Most Common Occupations - Education, training, and library occupations (%)
Most Common Occupations - Arts, design, entertainment, sports, and media occupations (%)
Most Common Occupations - Healthcare practitioners and technical occupations (%)
Most Common Occupations - Health diagnosing and treating practitioners and other technical occupations (%)
Most Common Occupations - Health technologists and technicians (%)
Most Common Occupations - Service occupations (%)
Most Common Occupations - Healthcare support occupations (%)
Most Common Occupations - Protective service occupations (%)
Most Common Occupations - Fire fighting and prevention, and other protective service workers including supervisors (%)
Most Common Occupations - Law enforcement workers including supervisors (%)
Most Common Occupations - Food preparation and serving related occupations (%)
Most Common Occupations - Building and grounds cleaning and maintenance occupations (%)
Most Common Occupations - Personal care and service occupations (%)
Most Common Occupations - Sales and office occupations (%)
Most Common Occupations - Sales and related occupations (%)
Most Common Occupations - Office and administrative support occupations (%)
Most Common Occupations - Natural resources, construction, and maintenance occupations (%)
Most Common Occupations - Farming, fishing, and forestry occupations (%)
Most Common Occupations - Construction and extraction occupations (%)
Most Common Occupations - Installation, maintenance, and repair occupations (%)
Most Common Occupations - Production, transportation, and material moving occupations (%)
Most Common Occupations - Production occupations (%)
Most Common Occupations - Transportation occupations (%)
Most Common Occupations - Material moving occupations (%)
People in Group quarters - Institutionalized population (%)
People in Group quarters - Correctional institutions (%)
People in Group quarters - Federal prisons and detention centers (%)
People in Group quarters - Halfway houses (%)
People in Group quarters - Local jails and other confinement facilities (including police lockups) (%)
People in Group quarters - Military disciplinary barracks (%)
People in Group quarters - State prisons (%)
People in Group quarters - Other types of correctional institutions (%)
People in Group quarters - Nursing homes (%)
People in Group quarters - Hospitals/wards, hospices, and schools for the handicapped (%)
People in Group quarters - Hospitals/wards and hospices for chronically ill (%)
People in Group quarters - Hospices or homes for chronically ill (%)
People in Group quarters - Military hospitals or wards for chronically ill (%)
People in Group quarters - Other hospitals or wards for chronically ill (%)
People in Group quarters - Hospitals or wards for drug/alcohol abuse (%)
People in Group quarters - Mental (Psychiatric) hospitals or wards (%)
People in Group quarters - Schools, hospitals, or wards for the mentally retarded (%)
People in Group quarters - Schools, hospitals, or wards for the physically handicapped (%)
People in Group quarters - Institutions for the deaf (%)
People in Group quarters - Institutions for the blind (%)
People in Group quarters - Orthopedic wards and institutions for the physically handicapped (%)
People in Group quarters - Wards in general hospitals for patients who have no usual home elsewhere (%)
People in Group quarters - Wards in military hospitals for patients who have no usual home elsewhere (%)
People in Group quarters - Juvenile institutions (%)
People in Group quarters - Long-term care (%)
People in Group quarters - Homes for abused, dependent, and neglected children (%)
People in Group quarters - Residential treatment centers for emotionally disturbed children (%)
People in Group quarters - Training schools for juvenile delinquents (%)
People in Group quarters - Short-term care, detention or diagnostic centers for delinquent children (%)
People in Group quarters - Type of juvenile institution unknown (%)
People in Group quarters - Noninstitutionalized population (%)
People in Group quarters - College dormitories (includes college quarters off campus) (%)
People in Group quarters - Military quarters (%)
People in Group quarters - On base (%)
People in Group quarters - Barracks, unaccompanied personnel housing (UPH), (Enlisted/Officer), ;and similar group living quarters for military personnel (%)
People in Group quarters - Transient quarters for temporary residents (%)
People in Group quarters - Military ships (%)
People in Group quarters - Group homes (%)
People in Group quarters - Homes or halfway houses for drug/alcohol abuse (%)
People in Group quarters - Homes for the mentally ill (%)
People in Group quarters - Homes for the mentally retarded (%)
People in Group quarters - Homes for the physically handicapped (%)
People in Group quarters - Other group homes (%)
People in Group quarters - Religious group quarters (%)
People in Group quarters - Dormitories (%)
People in Group quarters - Agriculture workers' dormitories on farms (%)
People in Group quarters - Job Corps and vocational training facilities (%)
People in Group quarters - Other workers' dormitories (%)
People in Group quarters - Crews of maritime vessels (%)
People in Group quarters - Other nonhousehold living situations (%)
People in Group quarters - Other noninstitutional group quarters (%)
Residents speaking English at home (%)
Residents speaking English at home - Born in the United States (%)
Residents speaking English at home - Native, born elsewhere (%)
Residents speaking English at home - Foreign born (%)
Residents speaking Spanish at home (%)
Residents speaking Spanish at home - Born in the United States (%)
Residents speaking Spanish at home - Native, born elsewhere (%)
Residents speaking Spanish at home - Foreign born (%)
Residents speaking other language at home (%)
Residents speaking other language at home - Born in the United States (%)
Residents speaking other language at home - Native, born elsewhere (%)
Residents speaking other language at home - Foreign born (%)
Class of Workers - Employee of private company (%)
Class of Workers - Self-employed in own incorporated business (%)
Class of Workers - Private not-for-profit wage and salary workers (%)
Class of Workers - Local government workers (%)
Class of Workers - State government workers (%)
Class of Workers - Federal government workers (%)
Class of Workers - Self-employed workers in own not incorporated business and Unpaid family workers (%)
House heating fuel used in houses and condos - Utility gas (%)
House heating fuel used in houses and condos - Bottled, tank, or LP gas (%)
House heating fuel used in houses and condos - Electricity (%)
House heating fuel used in houses and condos - Fuel oil, kerosene, etc. (%)
House heating fuel used in houses and condos - Coal or coke (%)
House heating fuel used in houses and condos - Wood (%)
House heating fuel used in houses and condos - Solar energy (%)
House heating fuel used in houses and condos - Other fuel (%)
House heating fuel used in houses and condos - No fuel used (%)
House heating fuel used in apartments - Utility gas (%)
House heating fuel used in apartments - Bottled, tank, or LP gas (%)
House heating fuel used in apartments - Electricity (%)
House heating fuel used in apartments - Fuel oil, kerosene, etc. (%)
House heating fuel used in apartments - Coal or coke (%)
House heating fuel used in apartments - Wood (%)
House heating fuel used in apartments - Solar energy (%)
House heating fuel used in apartments - Other fuel (%)
House heating fuel used in apartments - No fuel used (%)
Armed forces status - In Armed Forces (%)
Armed forces status - Civilian (%)
Armed forces status - Civilian - Veteran (%)
Armed forces status - Civilian - Nonveteran (%)
Fatal accidents locations in years 2005-2021
Fatal accidents locations in 2005
Fatal accidents locations in 2006
Fatal accidents locations in 2007
Fatal accidents locations in 2008
Fatal accidents locations in 2009
Fatal accidents locations in 2010
Fatal accidents locations in 2011
Fatal accidents locations in 2012
Fatal accidents locations in 2013
Fatal accidents locations in 2014
Fatal accidents locations in 2015
Fatal accidents locations in 2016
Fatal accidents locations in 2017
Fatal accidents locations in 2018
Fatal accidents locations in 2019
Fatal accidents locations in 2020
Fatal accidents locations in 2021
Alcohol use - People drinking some alcohol every month (%)
Alcohol use - People not drinking at all (%)
Alcohol use - Average days/month drinking alcohol
Alcohol use - Average drinks/week
Alcohol use - Average days/year people drink much
Audiometry - Average condition of hearing (%)
Audiometry - People that can hear a whisper from across a quiet room (%)
Audiometry - People that can hear normal voice from across a quiet room (%)
Audiometry - Ears ringing, roaring, buzzing (%)
Audiometry - Had a job exposure to loud noise (%)
Audiometry - Had off-work exposure to loud noise (%)
Blood Pressure & Cholesterol - Has high blood pressure (%)
Blood Pressure & Cholesterol - Checking blood pressure at home (%)
Blood Pressure & Cholesterol - Frequently checking blood cholesterol (%)
Blood Pressure & Cholesterol - Has high cholesterol level (%)
Consumer Behavior - Money monthly spent on food at supermarket/grocery store
Consumer Behavior - Money monthly spent on food at other stores
Consumer Behavior - Money monthly spent on eating out
Consumer Behavior - Money monthly spent on carryout/delivered foods
Consumer Behavior - Income spent on food at supermarket/grocery store (%)
Consumer Behavior - Income spent on food at other stores (%)
Consumer Behavior - Income spent on eating out (%)
Consumer Behavior - Income spent on carryout/delivered foods (%)
Current Health Status - General health condition (%)
Current Health Status - Blood donors (%)
Current Health Status - Has blood ever tested for HIV virus (%)
Current Health Status - Left-handed people (%)
Dermatology - People using sunscreen (%)
Diabetes - Diabetics (%)
Diabetes - Had a blood test for high blood sugar (%)
Diabetes - People taking insulin (%)
Diet Behavior & Nutrition - Diet health (%)
Diet Behavior & Nutrition - Milk product consumption (# of products/month)
Diet Behavior & Nutrition - Meals not home prepared (#/week)
Diet Behavior & Nutrition - Meals from fast food or pizza place (#/week)
Diet Behavior & Nutrition - Ready-to-eat foods (#/month)
Diet Behavior & Nutrition - Frozen meals/pizza (#/month)
Drug Use - People that ever used marijuana or hashish (%)
Drug Use - Ever used hard drugs (%)
Drug Use - Ever used any form of cocaine (%)
Drug Use - Ever used heroin (%)
Drug Use - Ever used methamphetamine (%)
Health Insurance - People covered by health insurance (%)
Kidney Conditions-Urology - Avg. # of times urinating at night
Medical Conditions - People with asthma (%)
Medical Conditions - People with anemia (%)
Medical Conditions - People with psoriasis (%)
Medical Conditions - People with overweight (%)
Medical Conditions - Elderly people having difficulties in thinking or remembering (%)
Medical Conditions - People who ever received blood transfusion (%)
Medical Conditions - People having trouble seeing even with glass/contacts (%)
Medical Conditions - People with arthritis (%)
Medical Conditions - People with gout (%)
Medical Conditions - People with congestive heart failure (%)
Medical Conditions - People with coronary heart disease (%)
Medical Conditions - People with angina pectoris (%)
Medical Conditions - People who ever had heart attack (%)
Medical Conditions - People who ever had stroke (%)
Medical Conditions - People with emphysema (%)
Medical Conditions - People with thyroid problem (%)
Medical Conditions - People with chronic bronchitis (%)
Medical Conditions - People with any liver condition (%)
Medical Conditions - People who ever had cancer or malignancy (%)
Mental Health - People who have little interest in doing things (%)
Mental Health - People feeling down, depressed, or hopeless (%)
Mental Health - People who have trouble sleeping or sleeping too much (%)
Mental Health - People feeling tired or having little energy (%)
Mental Health - People with poor appetite or overeating (%)
Mental Health - People feeling bad about themself (%)
Mental Health - People who have trouble concentrating on things (%)
Mental Health - People moving or speaking slowly or too fast (%)
Mental Health - People having thoughts they would be better off dead (%)
Oral Health - Average years since last visit a dentist
Oral Health - People embarrassed because of mouth (%)
Oral Health - People with gum disease (%)
Oral Health - General health of teeth and gums (%)
Oral Health - Average days a week using dental floss/device
Oral Health - Average days a week using mouthwash for dental problem
Oral Health - Average number of teeth
Pesticide Use - Households using pesticides to control insects (%)
Pesticide Use - Households using pesticides to kill weeds (%)
Physical Activity - People doing vigorous-intensity work activities (%)
Physical Activity - People doing moderate-intensity work activities (%)
Physical Activity - People walking or bicycling (%)
Physical Activity - People doing vigorous-intensity recreational activities (%)
Physical Activity - People doing moderate-intensity recreational activities (%)
Physical Activity - Average hours a day doing sedentary activities
Physical Activity - Average hours a day watching TV or videos
Physical Activity - Average hours a day using computer
Physical Functioning - People having limitations keeping them from working (%)
Physical Functioning - People limited in amount of work they can do (%)
Physical Functioning - People that need special equipment to walk (%)
Physical Functioning - People experiencing confusion/memory problems (%)
Physical Functioning - People requiring special healthcare equipment (%)
Prescription Medications - Average number of prescription medicines taking
Preventive Aspirin Use - Adults 40+ taking low-dose aspirin (%)
Reproductive Health - Vaginal deliveries (%)
Reproductive Health - Cesarean deliveries (%)
Reproductive Health - Deliveries resulted in a live birth (%)
Reproductive Health - Pregnancies resulted in a delivery (%)
Reproductive Health - Women breastfeeding newborns (%)
Reproductive Health - Women that had a hysterectomy (%)
Reproductive Health - Women that had both ovaries removed (%)
Reproductive Health - Women that have ever taken birth control pills (%)
Reproductive Health - Women taking birth control pills (%)
Reproductive Health - Women that have ever used Depo-Provera or injectables (%)
Reproductive Health - Women that have ever used female hormones (%)
Sexual Behavior - People 18+ that ever had sex (vaginal, anal, or oral) (%)
Sexual Behavior - Males 18+ that ever had vaginal sex with a woman (%)
Sexual Behavior - Males 18+ that ever performed oral sex on a woman (%)
Sexual Behavior - Males 18+ that ever had anal sex with a woman (%)
Sexual Behavior - Males 18+ that ever had any sex with a man (%)
Sexual Behavior - Females 18+ that ever had vaginal sex with a man (%)
Sexual Behavior - Females 18+ that ever performed oral sex on a man (%)
Sexual Behavior - Females 18+ that ever had anal sex with a man (%)
Sexual Behavior - Females 18+ that ever had any kind of sex with a woman (%)
Sexual Behavior - Average age people first had sex
Sexual Behavior - Average number of female sex partners in lifetime (males 18+)
Sexual Behavior - Average number of female vaginal sex partners in lifetime (males 18+)
Sexual Behavior - Average age people first performed oral sex on a woman (18+)
Sexual Behavior - Average number of woman performed oral sex on in lifetime (18+)
Sexual Behavior - Average number of male sex partners in lifetime (males 18+)
Sexual Behavior - Average number of male anal sex partners in lifetime (males 18+)
Sexual Behavior - Average age people first performed oral sex on a man (18+)
Sexual Behavior - Average number of male oral sex partners in lifetime (18+)
Sexual Behavior - People using protection when performing oral sex (%)
Sexual Behavior - Average number of times people have vaginal or anal sex a year
Sexual Behavior - People having sex without condom (%)
Sexual Behavior - Average number of male sex partners in lifetime (females 18+)
Sexual Behavior - Average number of male vaginal sex partners in lifetime (females 18+)
Sexual Behavior - Average number of female sex partners in lifetime (females 18+)
Sexual Behavior - Circumcised males 18+ (%)
Sleep Disorders - Average hours sleeping at night
Sleep Disorders - People that has trouble sleeping (%)
Smoking-Cigarette Use - People smoking cigarettes (%)
Taste & Smell - People 40+ having problems with smell (%)
Taste & Smell - People 40+ having problems with taste (%)
Taste & Smell - People 40+ that ever had wisdom teeth removed (%)
Taste & Smell - People 40+ that ever had tonsils teeth removed (%)
Taste & Smell - People 40+ that ever had a loss of consciousness because of a head injury (%)
Taste & Smell - People 40+ that ever had a broken nose or other serious injury to face or skull (%)
Taste & Smell - People 40+ that ever had two or more sinus infections (%)
Weight - Average height (inches)
Weight - Average weight (pounds)
Weight - Average BMI
Weight - People that are obese (%)
Weight - People that ever were obese (%)
Weight - People trying to lose weight (%)
100%
urban population.
Estimated median house/condo value in 2022: $151,153
14622:
$151,153New York:
$400,400
According to our research of New York and other state lists, there were 5 registered sex offenders living in 14622 zip code as of April 27, 2024 . The ratio of all residents to sex offenders in zip code 14622 is 2,425 to 1.The ratio of registered sex offenders to all residents in this zip code is much lower than the state average.
Median resident age: This zip code:
48.1 yearsNew York median age:
40.0 years
Average household size: This zip code:
2.1 peopleNew York:
2.5 people
Averages for the 2020 tax year for zip code 14622, filed in 2021:
Average Adjusted Gross Income (AGI) in 2020: $54,993 (Individual Income Tax Returns) Here:
$54,993State:
$90,930
Salary/wage: $48,369 (reported on 79.2% of returns )Here:
$48,369State:
$72,104
(% of AGI for various income ranges: 985.3% for AGIs below $25k , 3431.3% for AGIs $25k-50k , 6245.4% for AGIs $50k-75k , 9420.4% for AGIs $75k-100k , 16552.9% for AGIs $100k-200k , 94175.0% for AGIs over 200k ) Taxable interest for individuals: $621 (reported on 45.9% of returns )This zip code:
$621New York:
$3,075
(% of AGI for various income ranges: 23.8% for AGIs below $25k , 18.8% for AGIs $25k-50k , 38.2% for AGIs $50k-75k , 46.7% for AGIs $75k-100k , 90.7% for AGIs $100k-200k , 1785.0% for AGIs over 200k ) Ordinary dividends: $4,083 (reported on 21.1% of returns )(% of AGI for various income ranges: 31.7% for AGIs below $25k , 34.3% for AGIs $25k-50k , 78.1% for AGIs $50k-75k , 182.7% for AGIs $75k-100k , 430.7% for AGIs $100k-200k , 7420.0% for AGIs over 200k ) Net capital gain/loss in AGI: +$6,561 (reported on 16.8% of returns )Here:
+$6,561State:
+$44,925
(% of AGI for various income ranges: 12.5% for AGIs below $25k , 21.6% for AGIs $25k-50k , 91.5% for AGIs $50k-75k , 183.1% for AGIs $75k-100k , 636.3% for AGIs $100k-200k , 13055.0% for AGIs over 200k ) Profit/loss from business: +$11,535 (reported on 12.0% of returns )Here:
+$11,535State:
+$14,940
(% of AGI for various income ranges: 73.2% for AGIs below $25k , 100.2% for AGIs $25k-50k , 92.8% for AGIs $50k-75k , 268.8% for AGIs $75k-100k , 709.3% for AGIs $100k-200k , 8425.0% for AGIs over 200k ) Taxable individual retirement arrangement distribution: $17,986 (reported on 13.7% of returns )14622:
$17,986New York:
$19,609
(% of AGI for various income ranges: 134.0% for AGIs below $25k , 159.4% for AGIs $25k-50k , 286.7% for AGIs $50k-75k , 501.5% for AGIs $75k-100k , 1273.2% for AGIs $100k-200k , 10220.0% for AGIs over 200k ) Self-employed (Keogh) retirement plans: $16,850 (reported on 0.6% of returns )14622:
$16,850New York:
$32,497
(% of AGI for various income ranges: 164.4% for AGIs $100k-200k ) Total itemized deductions: $22,737 (reported on 7.5% of returns )Here:
$22,737State:
$39,326
(% of AGI for various income ranges: 64.6% for AGIs below $25k , 92.7% for AGIs $25k-50k , 296.0% for AGIs $50k-75k , 403.3% for AGIs $75k-100k , 639.0% for AGIs $100k-200k , 9430.0% for AGIs over 200k ) Charity contributions: $5,351 (reported on 5.2% of returns )(% of AGI for various income ranges: 1.5% for AGIs below $25k , 10.1% for AGIs $25k-50k , 38.8% for AGIs $50k-75k , 67.3% for AGIs $75k-100k , 105.6% for AGIs $100k-200k , 2830.0% for AGIs over 200k ) Taxes paid: $8,227 (reported on 7.5% of returns )(% of AGI for various income ranges: 15.3% for AGIs below $25k , 33.2% for AGIs $25k-50k , 137.6% for AGIs $50k-75k , 202.7% for AGIs $75k-100k , 216.3% for AGIs $100k-200k , 1475.0% for AGIs over 200k ) Earned income credit: $1,845 (reported on 11.2% of returns )(% of AGI for various income ranges: 53.2% for AGIs below $25k , 43.4% for AGIs $25k-50k ) Percentage of individuals using paid preparers for their 2020 taxes: 95.3%(% for various income ranges: 94.2% for AGIs below $25k , 95.5% for AGIs $25k-50k , 95.3% for AGIs $50k-75k , 95.9% for AGIs $75k-100k , 96.0% for AGIs $100k-200k , 100.0% for AGIs over 200k )
Averages for the 2012 tax year for zip code 14622, filed in 2013:
Average Adjusted Gross Income (AGI) in 2012: $48,208 (Individual Income Tax Returns) Here:
$48,208State:
$77,088
Salary/wage: $41,841 (reported on 81.2% of returns )Here:
$41,841State:
$60,593
(% of AGI for various income ranges: 66.3% for AGIs below $25k , 76.0% for AGIs $25k-50k , 76.4% for AGIs $50k-75k , 77.4% for AGIs $75k-100k , 70.4% for AGIs $100k-200k , 39.0% for AGIs over 200k ) Taxable interest for individuals: $755 (reported on 51.3% of returns )This zip code:
$755New York:
$3,125
(% of AGI for various income ranges: 1.5% for AGIs below $25k , 0.6% for AGIs $25k-50k , 0.5% for AGIs $50k-75k , 0.5% for AGIs $75k-100k , 0.6% for AGIs $100k-200k , 2.1% for AGIs over 200k ) Ordinary dividends: $3,538 (reported on 22.7% of returns )(% of AGI for various income ranges: 1.9% for AGIs below $25k , 1.1% for AGIs $25k-50k , 1.0% for AGIs $50k-75k , 1.3% for AGIs $75k-100k , 2.3% for AGIs $100k-200k , 3.5% for AGIs over 200k ) Net capital gain/loss in AGI: +$2,416 (reported on 16.0% of returns )Here:
+$2,416State:
+$42,474
(% of AGI for various income ranges: 0.2% for AGIs $25k-50k , 0.3% for AGIs $50k-75k , 0.4% for AGIs $75k-100k , 1.9% for AGIs $100k-200k , 2.6% for AGIs over 200k ) Profit/loss from business: +$14,586 (reported on 11.7% of returns )Here:
+$14,586State:
+$16,168
(% of AGI for various income ranges: 5.7% for AGIs below $25k , 3.0% for AGIs $25k-50k , 1.6% for AGIs $50k-75k , 1.5% for AGIs $75k-100k , 2.9% for AGIs $100k-200k , 11.3% for AGIs over 200k ) Taxable individual retirement arrangement distribution: $13,234 (reported on 15.4% of returns )14622:
$13,234New York:
$17,621
(% of AGI for various income ranges: 6.6% for AGIs below $25k , 4.0% for AGIs $25k-50k , 3.2% for AGIs $50k-75k , 3.4% for AGIs $75k-100k , 4.9% for AGIs $100k-200k , 4.7% for AGIs over 200k ) Self-employment retirement plans: $29,900 (reported on 0.4% of returns )14622:
$29,900New York:
$27,330
Total itemized deductions: $17,779 (22% of AGI, reported on 36.3% of returns )Here:
$17,779State:
$34,985
Here:
22.3% of AGIState:
21.3% of AGI
(% of AGI for various income ranges: 11.5% for AGIs below $25k , 12.6% for AGIs $25k-50k , 13.1% for AGIs $50k-75k , 13.7% for AGIs $75k-100k , 16.0% for AGIs $100k-200k , 11.7% for AGIs over 200k ) Charity contributions: $2,250 (reported on 29.9% of returns )(% of AGI for various income ranges: 0.6% for AGIs below $25k , 1.0% for AGIs $25k-50k , 1.4% for AGIs $50k-75k , 1.5% for AGIs $75k-100k , 1.9% for AGIs $100k-200k , 1.8% for AGIs over 200k ) Taxes paid: $8,953 (reported on 36.3% of returns )14622:
$8,953State:
$18,656
(% of AGI for various income ranges: 4.3% for AGIs below $25k , 5.4% for AGIs $25k-50k , 6.4% for AGIs $50k-75k , 7.0% for AGIs $75k-100k , 9.2% for AGIs $100k-200k , 7.5% for AGIs over 200k ) Earned income credit: $1,893 (reported on 13.2% of returns )(% of AGI for various income ranges: 4.1% for AGIs below $25k , 0.6% for AGIs $25k-50k ) Percentage of individuals using paid preparers for their 2012 taxes: 53.2%(% for various income ranges: 48.0% for AGIs below $25k , 50.5% for AGIs $25k-50k , 57.9% for AGIs $50k-75k , 59.1% for AGIs $75k-100k , 64.0% for AGIs $100k-200k , 100.0% for AGIs over 200k )
Averages for the 2004 tax year for zip code 14622, filed in 2005:
Average Adjusted Gross Income (AGI) in 2004: $40,902 (Individual Income Tax Returns) Here:
$40,902State:
$59,519
Salary/wage: $38,021 (reported on 79.5% of returns )Here:
$38,021State:
$50,673
(% of AGI for various income ranges: 105.7% for AGIs below $10k , 61.3% for AGIs $10k-25k , 77.1% for AGIs $25k-50k , 78.8% for AGIs $50k-75k , 80.7% for AGIs $75k-100k , 63.4% for AGIs over 100k ) Taxable interest for individuals: $1,223 (reported on 65.0% of returns )This zip code:
$1,223New York:
$2,377
(% of AGI for various income ranges: 12.3% for AGIs below $10k , 3.0% for AGIs $10k-25k , 1.6% for AGIs $25k-50k , 1.0% for AGIs $50k-75k , 1.0% for AGIs $75k-100k , 2.8% for AGIs over 100k ) Taxable dividends: $1,994 (reported on 34.0% of returns )(% of AGI for various income ranges: 7.5% for AGIs below $10k , 2.3% for AGIs $10k-25k , 1.2% for AGIs $25k-50k , 1.2% for AGIs $50k-75k , 1.4% for AGIs $75k-100k , 2.2% for AGIs over 100k ) Net capital gain/loss: +$4,307 (reported on 23.6% of returns )Here:
+$4,307State:
+$23,581
(% of AGI for various income ranges: -3.3% for AGIs below $10k , 0.7% for AGIs $10k-25k , 0.2% for AGIs $25k-50k , 1.1% for AGIs $50k-75k , 1.7% for AGIs $75k-100k , 8.1% for AGIs over 100k ) Profit/loss from business: +$10,161 (reported on 12.3% of returns )Here:
+$10,161State:
+$13,809
(% of AGI for various income ranges: 5.8% for AGIs below $10k , 5.8% for AGIs $10k-25k , 2.5% for AGIs $25k-50k , 1.7% for AGIs $50k-75k , 1.4% for AGIs $75k-100k , 4.8% for AGIs over 100k ) IRA payment deduction: $2,924 (reported on 2.9% of returns )14622:
$2,924New York:
$3,115
(% of AGI for various income ranges: 0.3% for AGIs $10k-25k , 0.4% for AGIs $25k-50k , 0.2% for AGIs $50k-75k , 0.1% for AGIs $75k-100k , 0.1% for AGIs over 100k ) Self-employed pension: $11,487 (reported on 0.6% of returns )Here:
$11,487New York:
$19,016
Total itemized deductions: $15,157 (23% of AGI, reported on 39.2% of returns )Here:
$15,157State:
$25,864
Here:
22.6% of AGIState:
21.9% of AGI
(% of AGI for various income ranges: 16.3% for AGIs below $10k , 9.8% for AGIs $10k-25k , 14.2% for AGIs $25k-50k , 14.7% for AGIs $50k-75k , 15.9% for AGIs $75k-100k , 15.6% for AGIs over 100k ) Charity contributions deductions: $2,275 (3% of AGI, reported on 35.9% of returns )Here:
3.3% of AGIState:
3.6% of AGI
(% of AGI for various income ranges: 0.6% for AGIs below $10k , 0.9% for AGIs $10k-25k , 1.7% for AGIs $25k-50k , 1.8% for AGIs $50k-75k , 2.0% for AGIs $75k-100k , 3.1% for AGIs over 100k ) Total tax: $5,375 (reported on 78.0% of returns )14622:
$5,375State:
$11,730
(% of AGI for various income ranges: 2.9% for AGIs below $10k , 4.2% for AGIs $10k-25k , 7.4% for AGIs $25k-50k , 8.9% for AGIs $50k-75k , 10.6% for AGIs $75k-100k , 17.6% for AGIs over 100k ) Earned income credit: $1,455 (reported on 10.5% of returns )Percentage of individuals using paid preparers for their 2004 taxes: 62.7%(% for various income ranges: 57.9% for AGIs below $10k , 63.2% for AGIs $10k-25k , 63.1% for AGIs $25k-50k , 62.0% for AGIs $50k-75k , 66.7% for AGIs $75k-100k , 72.6% for AGIs over 100k )
Estimated median household income in 2022: This zip code:
$69,540New York:
$79,557
Nearest zip codes: 14609 ,
14617 ,
14621 ,
14605 ,
14607 ,
14610 .
Rochester Zip Code Map
Percentage of family households: This zip code:
38.4%New York:
41.3%
Percentage of households with unmarried partners: This zip code:
7.0%New York:
42.3%
Likely homosexual households (counted as self-reported same-sex unmarried-partner households)
Lesbian couples: 0.5% of all households Gay men: 0.3% of all households
Household received Food Stamps/SNAP in the past 12 months: 765Household did not receive Food Stamps/SNAP in the past 12 months: 5,129
Women who had a birth in the past 12 months: 97 (65 now married , 32 unmarried) Women who did not have a birth in the past 12 months: 2,664 (1,175 now married , 1,479 unmarried)
Housing units in zip code 14622 with a mortgage: 2,927 (429
second mortgage , 398
both second mortgage and home equity loan )
Houses without a mortgage: 232
Median monthly owner costs for units with a mortgage: $1,383
Median monthly owner costs for units without a mortgage: $667
Residents with income below the poverty level in 2022:
This zip code:
11.8%Whole state:
14.3%
Residents with income below 50% of the poverty level in 2022:
This zip code:
5.2%Whole state:
6.8%
Median number of rooms in houses and condos: Median number of rooms in apartments: Notable locations in this zip code not listed on our city pages
Click to draw/clear zip code borders Notable locations in zip code 14622: (A) , Newport Yacht Club (B) , Irondequoit Public Library Helen McGraw Branch (C) , Ridge Culver Fire District (D) , Sea Breeze Volunteer Fire Department (E) . Display/hide their locations on the map
Shopping Centers: (1) , Culver Ridge Plaza Shopping Center (2) . Display/hide their locations on the map
Churches in zip code 14622 include: (A) , Durand United Church of Christ (B) , Grace Baptist Church (C) , The Church of Jesus Christ of Latter Day Saints (D) , Irondequoit Presbyterian Church (E) , Kingdom Hall of Jehovahs Witnesses (F) , Lutheran Church of the Transfiguration (G) , Saint Cecilia's Church (H) , Saint Salome's Church (I) . Display/hide their locations on the map
Cemetery: (1) . Display/hide its location on the map
Year house built (houses)
0 2020 or later133 2010 to 2019212 2000 to 2009296 1990 to 1999234 1980 to 1989261 1970 to 1979922 1960 to 19691,739 1950 to 1959846 1940 to 19491,373 1939 or earlier
Zip code 14622 household income distribution in 2022 395 Less than $10,000140 $10,000 to $14,999191 $15,000 to $19,999223 $20,000 to $24,999159 $25,000 to $29,999225 $30,000 to $34,999310 $35,000 to $39,999155 $40,000 to $44,999247 $45,000 to $49,999518 $50,000 to $59,999738 $60,000 to $74,999796 $75,000 to $99,999531 $100,000 to $124,999408 $125,000 to $149,999482 $150,000 to $199,999411 $200,000 or moreEstimate of home value of owner-occupied houses/condos in 2022 in zip code 14622 50 Less than $10,00052 $10,000 to $14,99910 $15,000 to $19,9994 $20,000 to $24,99912 $35,000 to $39,9992 $50,000 to $59,99937 $70,000 to $79,99998 $80,000 to $89,999226 $90,000 to $99,999654 $100,000 to $124,9991,040 $125,000 to $149,999763 $150,000 to $174,999473 $175,000 to $199,999366 $200,000 to $249,99972 $250,000 to $299,999189 $300,000 to $399,999112 $400,000 to $499,99917 $500,000 to $749,99945 $750,000 to $999,99914 $1,000,000 to $1,499,9999 $1,500,000 to $1,999,99931 $2,000,000 or moreRent paid by renters in 2022 in zip code 14622 39 $450 to $49985 $500 to $54922 $550 to $59913 $600 to $64978 $650 to $69948 $700 to $74947 $750 to $799191 $800 to $899158 $900 to $999156 $1,000 to $1,249175 $1,250 to $1,49941 $1,500 to $1,99917 No cash rent
Median gross rent in 2022: $1,039.
Median price asked for vacant for-sale houses and condos in 2022: $511,840.
Estimated median house (or condo) value in 2022 for: White Non-Hispanic householders: $150,799Black or African American householders: $180,711American Indian or Alaska Native householders: $57,523Asian householders: $298,766Some other race householders: $331,864Two or more races householders: $39,823Hispanic or Latino householders: $139,825Estimated median house or condo value in 2022: $151,153
14622:
$151,153New York:
$400,400
Lower value quartile - upper value quartile: $130,049 - $187,124
Mean price in 2022: Detached houses: $199,335Here:
$199,335State:
$476,719
Townhouses or other attached units: $144,539Here:
$144,539State:
$699,270
In 2-unit structures: $432,846Here:
$432,846State:
$713,077
In 3-to-4-unit structures: $772,047Here:
$772,047State:
$764,568
In 5-or-more-unit structures: $125,862Here:
$125,862State:
$912,009
Mobile homes: $45,093Here:
$45,093State:
$88,925
Housing units in structures:
One, detached: 5,153One, attached: 55Two: 123 or 4: 1865 to 9: 33110 to 19: 2720 to 49: 10050 or more: 90Mobile homes: 110Unemployment : 3.6%
Means of transportation to work in zip code 14622 74.8% 4,574 Drove a car alone11.0% 672 Carpooled1.0% 59 Bus or trolley bus0.3% 18 Motorcycle0.2% 11 Bicycle1.5% 91 Walked1.1% 65 Other means10.6% 646 Worked at homeTravel time to work (commute) in zip code 14622 117 Less than 5 minutes483 5 to 9 minutes924 10 to 14 minutes1,129 15 to 19 minutes1,057 20 to 24 minutes676 25 to 29 minutes517 30 to 34 minutes113 35 to 39 minutes98 40 to 44 minutes105 45 to 59 minutes140 60 to 89 minutes52 90 or more minutes
Percentage of zip code residents living and working in this county: 94.7%
Household type by relationship:
Households: 12,567
Male householders: 2,915 (892 living alone ), Female householders: 3,000 (1,078 living alone )2,807 spouses (2,765 opposite-sex spouses ), 513 unmarried partners , (503 opposite-sex unmarried partners ), 2,902 children (2,833 natural , 59 adopted , 13 stepchildren ), 118 grandchildren , 43 brothers or sisters , 95 parents , 0 foster children , 28 other relatives , 255 non-relatives In group quarters: 13 (-1 institutionalized population )
Size of family households: 1,960 2-persons , 803 3-persons , 574 4-persons , 124 5-persons , 29 6-persons , 13 7-or-more-persons
Size of nonfamily households: 1,970 1-person , 367 2-persons , 72 3-persons , 28 4-persons
1,517 married couples with children. single-parent households (174 men , 395 women ).
89.9% of residents of 14622 zip code speak English at home. of residents speak Spanish at home (73% very well, 19% well, 8% not well ).of residents speak other Indo-European language at home (65% very well, 32% well, 3% not well ).of residents speak Asian or Pacific Island language at home (29% very well, 48% well, 23% not well ).of residents speak other language at home (47% very well, 53% well ).
Foreign born population: 765 (6.1%)
(71.3%
of them are naturalized citizens )
This zip code:
6.1%Whole state:
22.7%
8% North Macedonia (Macedonia) 7% Japan 5% Malaysia 4% United Arab Emirates 4% Syria 3% Indonesia 3% Barbados 31% Italian 10% German 7% English 7% Polish 6% Irish 5% American 2% Swedish
Year of entry for the foreign-born population
236 2010 or later 178 2000 to 2009 347 1990 to 1999 258 Before 1990
There are
109 Medical Specialists in Zip Code 14622 .
Facilities with environmental interests located in this zip code:
IVAN L. GREEN PRIMARY SCHOOL ( in ROCHESTER, NY)
(National Center for Education Statistics) - STATE ID-260801060005 Organizations: EAST IRONDEQUOIT CSD (SCHOOL DISTRICT)
ASPEN DENTAL (2255 E RIDGE RD in ROCHESTER, NY)
Conditionally Exempt Small Quantity Generators, less than 100 kg/month of hazardous waste (Resource Conservation and Recovery Act (tracking hazardous waste)) Organizations: ASPEN DENTAL ASSOC OF NY PC (CONTACT/OPERATOR)
INRONDEQUOIT MALL (203 ARROW DR in ROCHESTER, NY)
(Resource Conservation and Recovery Act (tracking hazardous waste))
IRONDEQUOIT DODGE (1733 RIDGE RD E in ROCHESTER, NY)
Small Quantity Generators, between 100 kg and 1000 kg of hazardous waste/month (Resource Conservation and Recovery Act (tracking hazardous waste)) - notification Organizations: ANGELO INGRASSIA (CONTACT/OWNER)
Housing units lacking complete plumbing facilities: 0.1%
Housing units lacking complete kitchen facilities: 0.2%
82.4% Utility gas 11.0% Electricity 4.1% Bottled, tank, or LP gas 1.6% Fuel oil, kerosene, etc. 0.6% Other fuel
Population in 1990: 12,489.
Place of birth for U.S.-born residents:
This state: 10,212Northeast: 342Midwest: 188South: 563West: 193
71% of the 14622 zip code residents lived in the same house 5 years ago.
Out of people who lived in different houses, 87% lived in this county.
Out of people who lived in different counties, 50% lived in New York.
90% of the 14622 zip code residents lived in the same house 1 year ago.
Out of people who lived in different houses, 81% moved from this county.
Out of people who lived in different houses, 7% moved from different county within same state.
Out of people who lived in different houses, 8% moved from different state.
Out of people who lived in different houses, 1% moved from abroad.
Private vs. public school enrollment:
Students in private schools in grades 1 to 8 (elementary and middle school): 155
Students in private schools in grades 9 to 12 (high school): 92
Students in private undergraduate colleges: 80
Occupation by median earnings in the past 12 months ($)
153,097 Architecture and engineering occupations 78,004 Health diagnosing and treating practitioners and other technical occupations 73,928 Computer and mathematical occupations 70,403 Management occupations 68,377 Life, physical, and social science occupations 68,259 Business and financial operations occupations
Top industries in this zip code by the number of employees in 2005:
Accommodation and Food Services: Full-Service Restaurants (50-99 employees: 1 establishment, 20-49 employees: 6 establishments, 5-9 employees: 2 establishments, 1-4 employees: 4 establishments)Accommodation and Food Services: Limited-Service Restaurants (50-99: 1, 20-49: 3, 10-19: 5, 5-9: 1, 1-4: 3)Professional, Scientific, and Technical Services: Custom Computer Programming Services (100-249: 1, 1-4: 2)Educational Services: Colleges, Universities, and Professional Schools (100-249: 1)Health Care and Social Assistance: Child Day Care Services (20-49: 1, 10-19: 2, 5-9: 1, 1-4: 1)Information: Motion Picture Theaters (except Drive-Ins) (50-99: 1)
People in group quarters in 2010:
11 people in group homes intended for adults
People in group quarters in 2000:
9 people in other group homes
7 people in other nonhousehold living situations
5 people in homes for the mentally retarded
Fatal accident statistics in 2010:
Fatal accident count: 1Vehicles involved in fatal accidents: 1Fatal accidents caused by drunken drivers: 0Fatalities: 1Persons involved in fatal accidents: 1Pedestrians involved in fatal accidents: 1
Home Mortgage Disclosure Act Aggregated Statistics For Year 2009(Based on 2 full and 10 partial tracts) A) FHA, FSA/RHS & VA B) Conventional C) Refinancings D) Home Improvement Loans F) Non-occupant Loans on Number Average Value Number Average Value Number Average Value Number Average Value Number Average Value
LOANS ORIGINATED 263 $96,014 130 $88,102 220 $92,422 103 $16,853 26 $89,997 APPLICATIONS APPROVED, NOT ACCEPTED 8 $99,298 6 $94,593 29 $102,198 6 $9,675 0 $0 APPLICATIONS DENIED 21 $101,783 15 $93,287 90 $102,638 48 $15,022 6 $95,757 APPLICATIONS WITHDRAWN 21 $81,233 7 $77,110 72 $102,009 5 $53,602 0 $0 FILES CLOSED FOR INCOMPLETENESS 4 $62,488 2 $108,090 21 $96,642 0 $0 1 $147,160
Aggregated Statistics For Year 2008(Based on 2 full and 10 partial tracts) A) FHA, FSA/RHS & VA B) Conventional C) Refinancings D) Home Improvement Loans F) Non-occupant Loans on Number Average Value Number Average Value Number Average Value Number Average Value Number Average Value
LOANS ORIGINATED 146 $100,918 219 $94,047 209 $83,804 92 $19,576 20 $93,364 APPLICATIONS APPROVED, NOT ACCEPTED 15 $104,173 17 $89,547 27 $81,635 10 $53,491 7 $73,210 APPLICATIONS DENIED 31 $99,541 17 $106,157 176 $101,213 64 $21,463 8 $50,855 APPLICATIONS WITHDRAWN 5 $140,972 14 $98,975 94 $96,215 7 $43,576 7 $81,889 FILES CLOSED FOR INCOMPLETENESS 0 $0 3 $52,050 24 $107,472 0 $0 3 $89,760
Aggregated Statistics For Year 2007(Based on 2 full and 8 partial tracts) A) FHA, FSA/RHS & VA B) Conventional C) Refinancings D) Home Improvement Loans F) Non-occupant Loans on G) Loans On Manufactured Number Average Value Number Average Value Number Average Value Number Average Value Number Average Value Number Average Value
LOANS ORIGINATED 110 $97,020 262 $89,701 252 $80,494 111 $28,221 39 $85,546 0 $0 APPLICATIONS APPROVED, NOT ACCEPTED 9 $91,869 35 $94,950 38 $84,432 12 $22,346 5 $89,998 0 $0 APPLICATIONS DENIED 16 $103,639 51 $76,870 240 $84,476 99 $32,361 10 $69,369 2 $67,985 APPLICATIONS WITHDRAWN 9 $86,779 21 $65,173 176 $99,033 16 $54,786 10 $48,797 0 $0 FILES CLOSED FOR INCOMPLETENESS 0 $0 25 $86,546 35 $110,799 2 $67,540 4 $58,988 0 $0
Aggregated Statistics For Year 2006(Based on 2 full and 8 partial tracts) A) FHA, FSA/RHS & VA B) Conventional C) Refinancings D) Home Improvement Loans F) Non-occupant Loans on G) Loans On Manufactured Number Average Value Number Average Value Number Average Value Number Average Value Number Average Value Number Average Value
LOANS ORIGINATED 100 $101,075 346 $81,423 291 $80,480 142 $19,506 28 $86,872 0 $0 APPLICATIONS APPROVED, NOT ACCEPTED 1 $111,300 29 $75,264 67 $105,914 27 $18,398 2 $150,970 0 $0 APPLICATIONS DENIED 6 $93,475 47 $80,159 401 $90,848 107 $31,670 7 $32,626 1 $1,050 APPLICATIONS WITHDRAWN 10 $90,980 27 $86,822 214 $93,655 25 $63,858 5 $93,718 0 $0 FILES CLOSED FOR INCOMPLETENESS 0 $0 23 $90,513 62 $106,380 2 $88,540 2 $74,985 0 $0
Aggregated Statistics For Year 2005(Based on 2 full and 10 partial tracts) A) FHA, FSA/RHS & VA B) Conventional C) Refinancings D) Home Improvement Loans F) Non-occupant Loans on G) Loans On Manufactured Number Average Value Number Average Value Number Average Value Number Average Value Number Average Value Number Average Value
LOANS ORIGINATED 106 $93,604 400 $77,456 321 $80,340 130 $19,916 41 $79,440 0 $0 APPLICATIONS APPROVED, NOT ACCEPTED 10 $91,935 31 $91,416 74 $86,243 30 $35,212 6 $91,627 0 $0 APPLICATIONS DENIED 15 $79,146 60 $69,330 308 $92,567 79 $27,007 14 $41,728 2 $58,485 APPLICATIONS WITHDRAWN 3 $90,977 31 $84,900 247 $92,847 19 $62,623 10 $86,342 4 $72,425 FILES CLOSED FOR INCOMPLETENESS 6 $101,970 5 $67,054 80 $114,941 0 $0 6 $84,962 0 $0
Aggregated Statistics For Year 2004(Based on 2 full and 10 partial tracts) A) FHA, FSA/RHS & VA B) Conventional C) Refinancings D) Home Improvement Loans F) Non-occupant Loans on G) Loans On Manufactured Number Average Value Number Average Value Number Average Value Number Average Value Number Average Value Number Average Value
LOANS ORIGINATED 109 $92,971 362 $82,511 403 $79,867 97 $21,107 29 $65,992 0 $0 APPLICATIONS APPROVED, NOT ACCEPTED 6 $84,232 29 $86,205 94 $91,239 14 $22,247 1 $130,970 0 $0 APPLICATIONS DENIED 14 $96,040 33 $83,710 335 $80,062 84 $25,823 11 $76,974 7 $39,743 APPLICATIONS WITHDRAWN 9 $100,750 25 $86,814 263 $89,524 10 $49,909 5 $76,422 4 $59,455 FILES CLOSED FOR INCOMPLETENESS 6 $89,118 18 $81,507 87 $104,799 6 $43,845 0 $0 0 $0
Aggregated Statistics For Year 2003(Based on 2 full and 10 partial tracts) A) FHA, FSA/RHS & VA B) Conventional C) Refinancings D) Home Improvement Loans F) Non-occupant Loans on Number Average Value Number Average Value Number Average Value Number Average Value Number Average Value
LOANS ORIGINATED 136 $87,601 349 $87,349 822 $79,948 75 $14,667 25 $61,139 APPLICATIONS APPROVED, NOT ACCEPTED 4 $84,395 26 $115,268 116 $79,414 20 $12,932 4 $69,165 APPLICATIONS DENIED 13 $80,515 34 $75,009 359 $85,168 52 $14,856 10 $61,929 APPLICATIONS WITHDRAWN 6 $94,460 14 $86,327 182 $85,350 18 $8,253 3 $40,713 FILES CLOSED FOR INCOMPLETENESS 3 $101,583 8 $71,659 43 $83,521 0 $0 2 $40,990
Aggregated Statistics For Year 2002(Based on 2 full and 8 partial tracts) A) FHA, FSA/RHS & VA B) Conventional C) Refinancings D) Home Improvement Loans F) Non-occupant Loans on Number Average Value Number Average Value Number Average Value Number Average Value Number Average Value
LOANS ORIGINATED 110 $84,997 275 $78,153 532 $74,324 65 $16,912 23 $52,096 APPLICATIONS APPROVED, NOT ACCEPTED 6 $74,398 10 $77,135 82 $80,608 17 $12,404 0 $0 APPLICATIONS DENIED 15 $74,872 25 $70,508 268 $71,958 56 $14,661 6 $62,383 APPLICATIONS WITHDRAWN 1 $103,540 18 $74,951 154 $85,310 13 $14,232 2 $31,995 FILES CLOSED FOR INCOMPLETENESS 6 $85,612 4 $62,725 50 $85,756 1 $29,430 2 $61,990
Aggregated Statistics For Year 2001(Based on 2 full and 8 partial tracts) A) FHA, FSA/RHS & VA B) Conventional C) Refinancings D) Home Improvement Loans E) Loans on Dwellings For 5+ Families F) Non-occupant Loans on Number Average Value Number Average Value Number Average Value Number Average Value Number Average Value Number Average Value
LOANS ORIGINATED 118 $78,936 240 $78,104 423 $76,108 81 $15,332 1 $3,229,630 20 $57,593 APPLICATIONS APPROVED, NOT ACCEPTED 8 $60,644 13 $50,242 58 $64,362 22 $22,201 0 $0 0 $0 APPLICATIONS DENIED 6 $69,215 59 $61,581 311 $63,620 89 $27,470 0 $0 18 $45,052 APPLICATIONS WITHDRAWN 6 $77,943 15 $67,135 137 $72,945 13 $27,992 0 $0 2 $46,990 FILES CLOSED FOR INCOMPLETENESS 6 $94,988 4 $93,595 32 $65,575 3 $20,177 0 $0 0 $0
Aggregated Statistics For Year 2000(Based on 2 full and 8 partial tracts) A) FHA, FSA/RHS & VA B) Conventional C) Refinancings D) Home Improvement Loans F) Non-occupant Loans on Number Average Value Number Average Value Number Average Value Number Average Value Number Average Value
LOANS ORIGINATED 154 $73,283 263 $81,219 144 $52,819 81 $14,706 18 $37,721 APPLICATIONS APPROVED, NOT ACCEPTED 5 $61,694 16 $81,481 47 $46,839 43 $19,899 4 $52,722 APPLICATIONS DENIED 10 $77,761 37 $58,124 212 $48,664 80 $18,909 8 $43,812 APPLICATIONS WITHDRAWN 3 $61,407 11 $44,603 95 $49,165 14 $23,939 7 $47,704 FILES CLOSED FOR INCOMPLETENESS 1 $62,980 2 $199,960 20 $58,423 1 $15,820 0 $0
Aggregated Statistics For Year 1999(Based on 1 full and 5 partial tracts) A) FHA, FSA/RHS & VA B) Conventional C) Refinancings D) Home Improvement Loans E) Loans on Dwellings For 5+ Families F) Non-occupant Loans on Number Average Value Number Average Value Number Average Value Number Average Value Number Average Value Number Average Value
LOANS ORIGINATED 77 $76,086 140 $135,020 161 $66,036 47 $12,545 0 $0 6 $55,303 APPLICATIONS APPROVED, NOT ACCEPTED 1 $89,220 7 $62,724 37 $72,092 13 $14,933 0 $0 2 $29,355 APPLICATIONS DENIED 7 $76,917 16 $120,876 112 $63,736 34 $14,420 0 $0 3 $33,940 APPLICATIONS WITHDRAWN 5 $94,736 8 $75,520 62 $58,636 11 $46,864 1 $49,420 3 $66,563 FILES CLOSED FOR INCOMPLETENESS 1 $38,300 3 $60,107 23 $64,622 0 $0 0 $0 2 $21,000
Private Mortgage Insurance Companies Aggregated Statistics For Year 2009(Based on 2 full and 8 partial tracts) A) Conventional B) Refinancings C) Non-occupant Loans on Number Average Value Number Average Value Number Average Value
LOANS ORIGINATED 39 $108,927 14 $116,072 0 $0 APPLICATIONS APPROVED, NOT ACCEPTED 4 $71,640 2 $259,950 2 $44,990 APPLICATIONS DENIED 11 $103,235 4 $106,820 0 $0 APPLICATIONS WITHDRAWN 2 $80,985 1 $185,420 0 $0 FILES CLOSED FOR INCOMPLETENESS 0 $0 0 $0 0 $0
Aggregated Statistics For Year 2008(Based on 2 full and 8 partial tracts) A) Conventional B) Refinancings C) Non-occupant Loans on Number Average Value Number Average Value Number Average Value
LOANS ORIGINATED 105 $99,057 31 $94,777 5 $183,854 APPLICATIONS APPROVED, NOT ACCEPTED 16 $99,166 10 $100,414 4 $55,112 APPLICATIONS DENIED 7 $78,523 6 $103,207 2 $42,240 APPLICATIONS WITHDRAWN 4 $78,608 0 $0 0 $0 FILES CLOSED FOR INCOMPLETENESS 1 $169,230 3 $92,513 2 $83,985
Aggregated Statistics For Year 2007(Based on 2 full and 8 partial tracts) A) Conventional B) Refinancings C) Non-occupant Loans on Number Average Value Number Average Value Number Average Value
LOANS ORIGINATED 113 $97,052 27 $111,537 7 $92,981 APPLICATIONS APPROVED, NOT ACCEPTED 28 $81,314 8 $98,698 8 $75,112 APPLICATIONS DENIED 6 $80,068 0 $0 3 $93,423 APPLICATIONS WITHDRAWN 5 $151,396 3 $106,370 0 $0 FILES CLOSED FOR INCOMPLETENESS 2 $51,990 0 $0 0 $0
Aggregated Statistics For Year 2006(Based on 2 full and 8 partial tracts) A) Conventional B) Refinancings C) Non-occupant Loans on Number Average Value Number Average Value Number Average Value
LOANS ORIGINATED 109 $93,900 27 $102,668 12 $92,876 APPLICATIONS APPROVED, NOT ACCEPTED 8 $88,789 14 $140,179 0 $0 APPLICATIONS DENIED 4 $84,542 2 $158,970 0 $0 APPLICATIONS WITHDRAWN 8 $94,089 4 $180,392 5 $64,438 FILES CLOSED FOR INCOMPLETENESS 0 $0 0 $0 0 $0
Aggregated Statistics For Year 2005(Based on 2 full and 8 partial tracts) A) Conventional B) Refinancings C) Non-occupant Loans on Number Average Value Number Average Value Number Average Value
LOANS ORIGINATED 107 $83,927 22 $87,350 5 $54,312 APPLICATIONS APPROVED, NOT ACCEPTED 18 $91,382 9 $92,170 2 $63,985 APPLICATIONS DENIED 0 $0 0 $0 0 $0 APPLICATIONS WITHDRAWN 7 $70,264 2 $69,985 0 $0 FILES CLOSED FOR INCOMPLETENESS 0 $0 0 $0 0 $0
Aggregated Statistics For Year 2004(Based on 2 full and 8 partial tracts) A) Conventional B) Refinancings C) Non-occupant Loans on Number Average Value Number Average Value Number Average Value
LOANS ORIGINATED 122 $85,203 39 $97,935 2 $96,245 APPLICATIONS APPROVED, NOT ACCEPTED 16 $81,097 11 $118,988 2 $42,990 APPLICATIONS DENIED 5 $75,646 1 $91,730 0 $0 APPLICATIONS WITHDRAWN 4 $107,630 10 $88,298 0 $0 FILES CLOSED FOR INCOMPLETENESS 9 $91,814 0 $0 0 $0
Aggregated Statistics For Year 2003(Based on 2 full and 8 partial tracts) A) Conventional B) Refinancings C) Non-occupant Loans on Number Average Value Number Average Value Number Average Value
LOANS ORIGINATED 149 $89,424 164 $92,602 4 $64,392 APPLICATIONS APPROVED, NOT ACCEPTED 20 $79,628 18 $106,118 0 $0 APPLICATIONS DENIED 2 $71,480 1 $142,750 0 $0 APPLICATIONS WITHDRAWN 5 $106,582 7 $83,443 0 $0 FILES CLOSED FOR INCOMPLETENESS 1 $59,530 0 $0 0 $0
Aggregated Statistics For Year 2002(Based on 2 full and 8 partial tracts) A) Conventional B) Refinancings C) Non-occupant Loans on Number Average Value Number Average Value Number Average Value
LOANS ORIGINATED 108 $80,991 90 $87,785 4 $47,490 APPLICATIONS APPROVED, NOT ACCEPTED 19 $100,272 18 $117,613 0 $0 APPLICATIONS DENIED 2 $59,300 1 $60,400 0 $0 APPLICATIONS WITHDRAWN 0 $0 0 $0 0 $0 FILES CLOSED FOR INCOMPLETENESS 0 $0 0 $0 0 $0
Aggregated Statistics For Year 2001(Based on 2 full and 8 partial tracts) A) Conventional B) Refinancings C) Non-occupant Loans on Number Average Value Number Average Value Number Average Value
LOANS ORIGINATED 103 $86,074 44 $80,299 5 $101,826 APPLICATIONS APPROVED, NOT ACCEPTED 16 $122,909 9 $78,449 0 $0 APPLICATIONS DENIED 5 $55,786 2 $54,990 4 $50,490 APPLICATIONS WITHDRAWN 5 $88,650 3 $55,677 2 $38,180 FILES CLOSED FOR INCOMPLETENESS 1 $158,930 2 $54,990 0 $0
Aggregated Statistics For Year 2000(Based on 2 full and 8 partial tracts) A) Conventional B) Refinancings C) Non-occupant Loans on Number Average Value Number Average Value Number Average Value
LOANS ORIGINATED 125 $84,379 7 $85,614 4 $75,420 APPLICATIONS APPROVED, NOT ACCEPTED 15 $98,373 2 $76,985 0 $0 APPLICATIONS DENIED 6 $71,858 1 $124,420 0 $0 APPLICATIONS WITHDRAWN 1 $171,700 0 $0 0 $0 FILES CLOSED FOR INCOMPLETENESS 0 $0 0 $0 0 $0
Aggregated Statistics For Year 1999(Based on 1 full and 5 partial tracts) A) Conventional B) Refinancings C) Non-occupant Loans on Number Average Value Number Average Value Number Average Value
LOANS ORIGINATED 62 $84,052 21 $74,668 2 $91,650 APPLICATIONS APPROVED, NOT ACCEPTED 6 $105,037 9 $65,993 0 $0 APPLICATIONS DENIED 1 $29,260 1 $61,370 0 $0 APPLICATIONS WITHDRAWN 0 $0 1 $58,010 0 $0 FILES CLOSED FOR INCOMPLETENESS 0 $0 0 $0 0 $0
2002 - 2018 National Fire Incident Reporting System (NFIRS) incidents See full 2006 National Fire Incident Reporting System statistics for zip code 14622, New York
Most common first names in zip code 14622 among deceased individuals Name Count Lived (average)
Mary 143 79.6 years Joseph 129 76.3 years John 125 75.9 years William 105 73.9 years Robert 83 71.5 years Frank 83 75.3 years Charles 80 76.4 years George 74 77.9 years James 60 76.9 years Helen 60 82.7 years
Most common last names in zip code 14622 among deceased individuals Last name Count Lived (average)
Miller 32 79.5 years Smith 22 75.1 years Johnson 16 80.7 years Weaver 11 78.7 years Kelly 11 72.3 years Polizzi 9 69.3 years Adams 9 70.7 years Bauer 9 76.2 years Davis 9 80.3 years Peters 9 79.4 years
Businesses in zip code 14622
Name Count Name Count
AT&T 1 Nike 4 Applebee's 1 Papa John's Pizza 1 Arby's 1 Payless 1 Avenue 1 Pizza Hut 1 FedEx 2 Sprint Nextel 1 GameStop 1 Starbucks 2 H&R Block 1 Subway 1 KFC 1 T-Mobile 1 Lane Furniture 1 Target 1 Macy's 1 U-Haul 1 Motherhood Maternity 1 Walgreens 1 New Balance 1
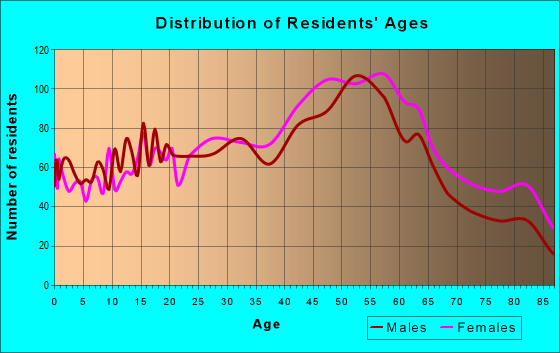
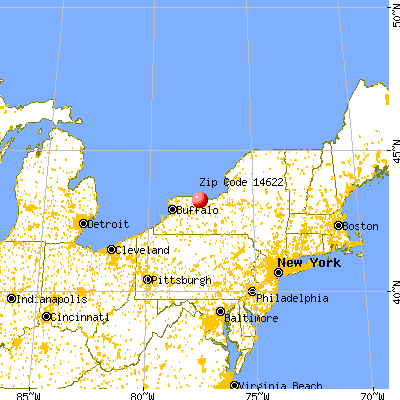


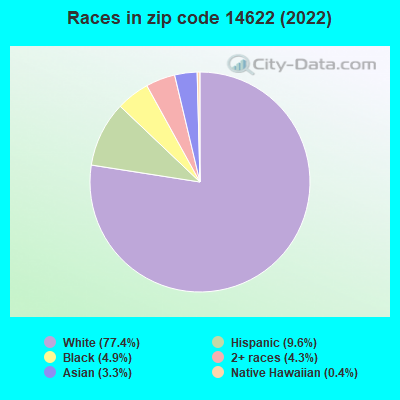


 Nearest zip codes: 14609, 14617, 14621, 14605, 14607, 14610.
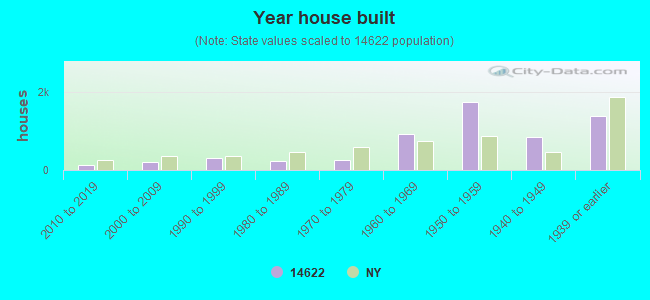

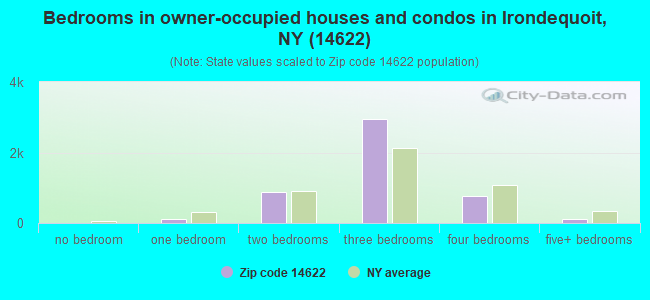
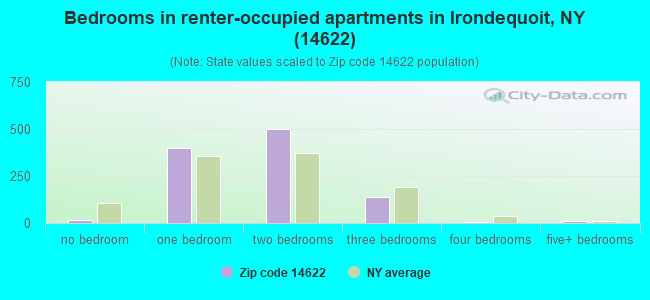
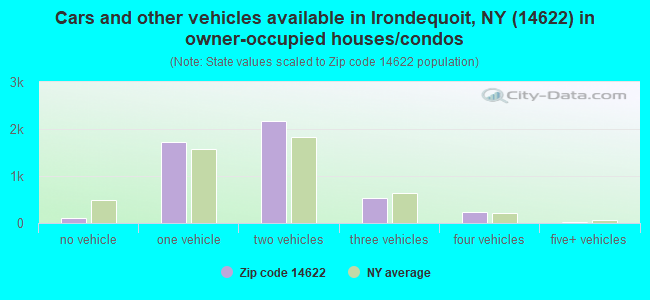
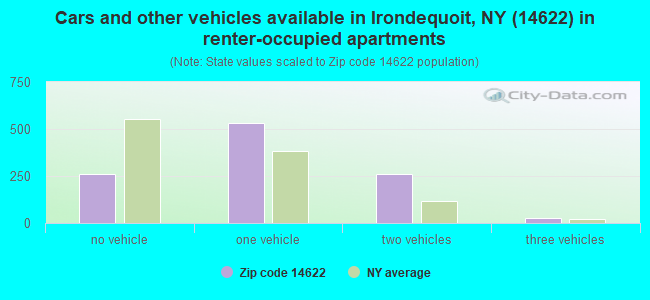


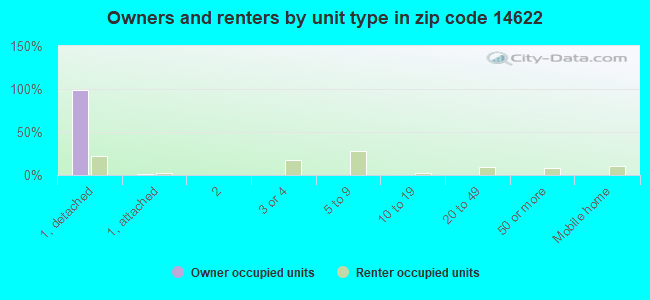
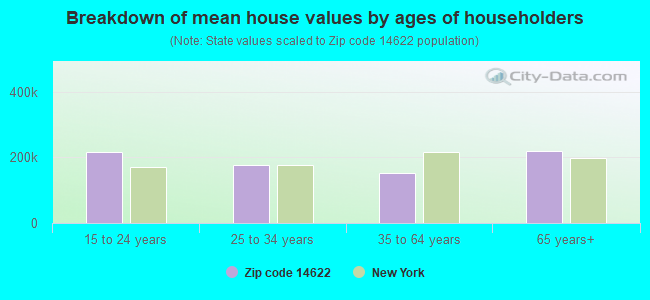


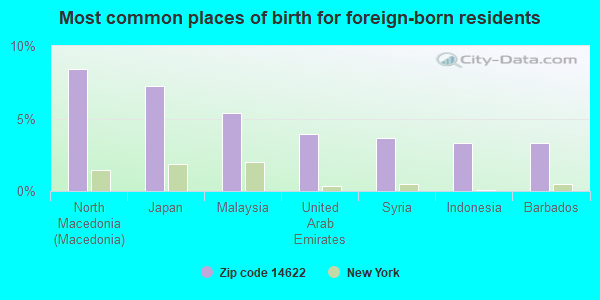
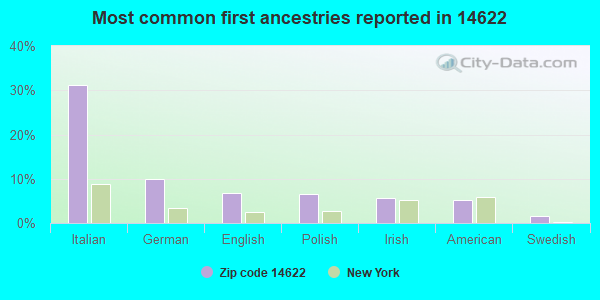
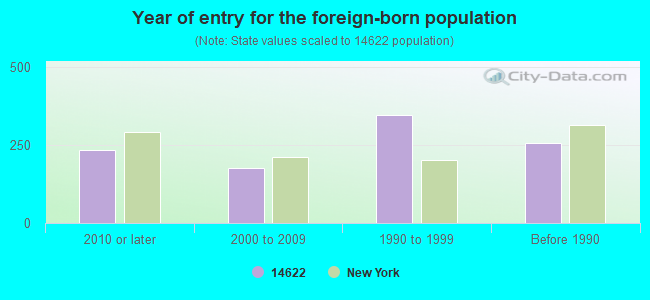


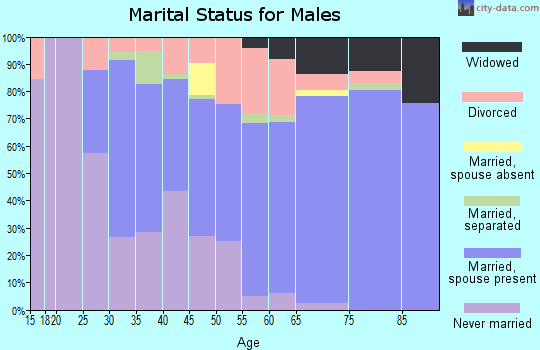
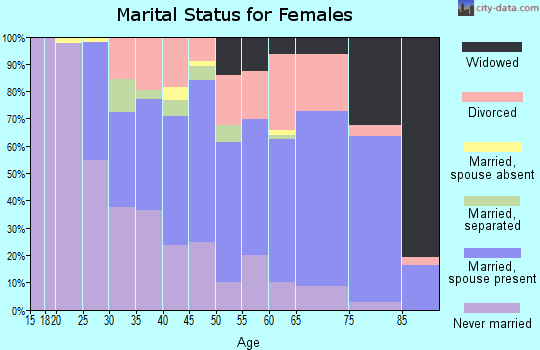
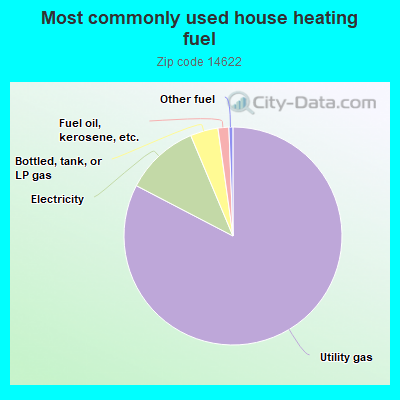
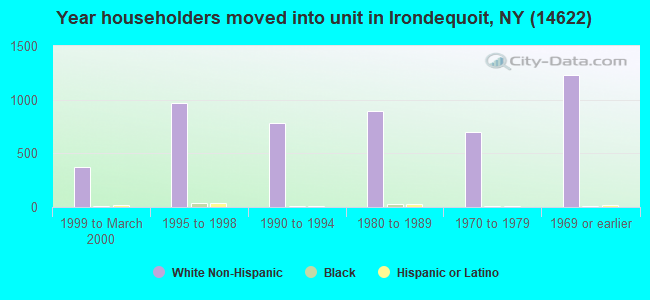
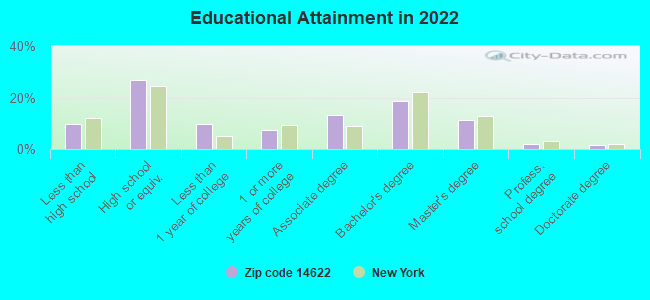
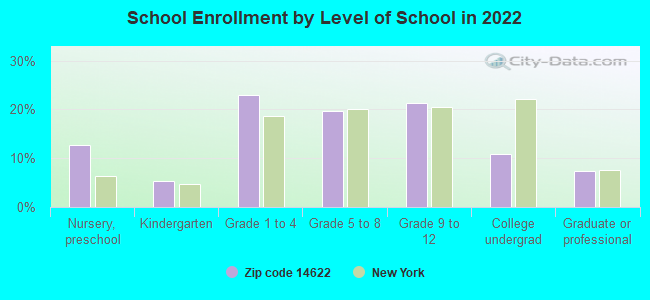
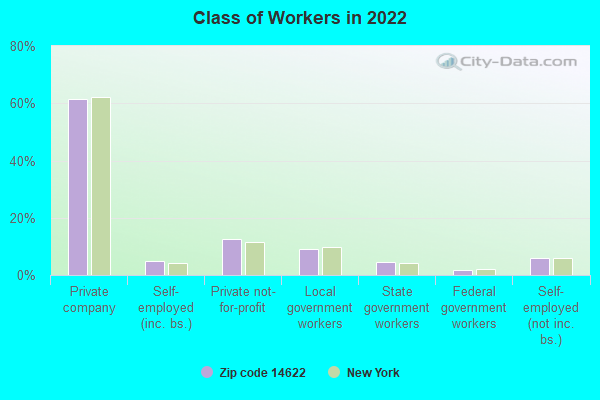
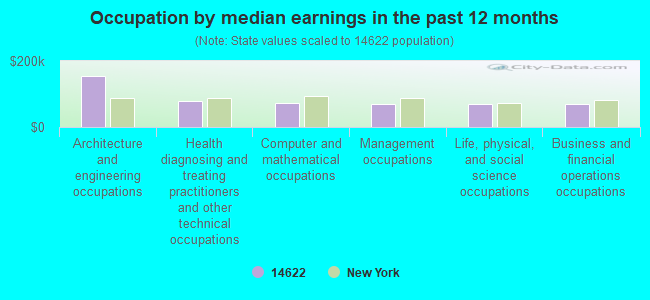
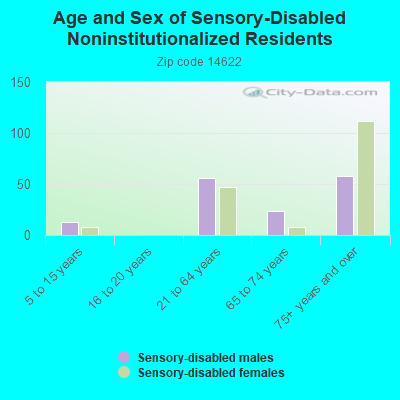
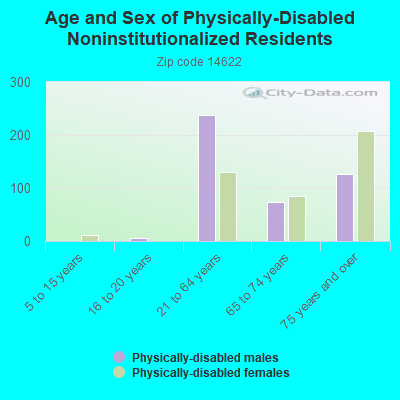
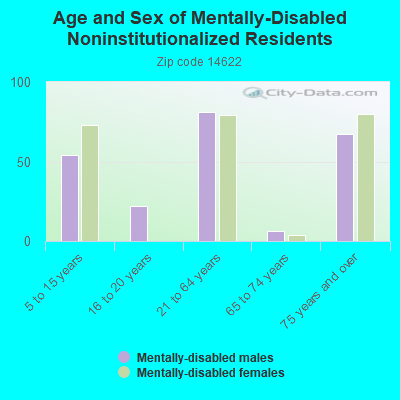
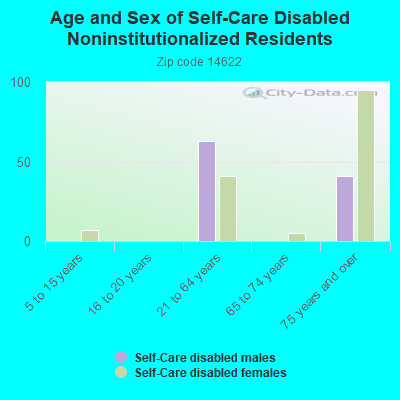
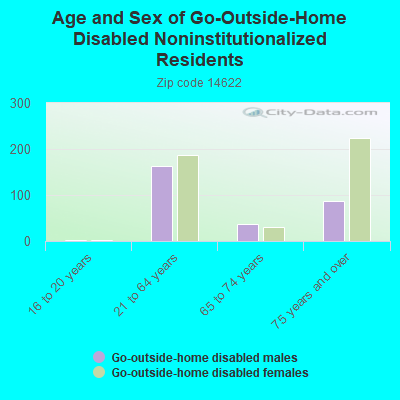
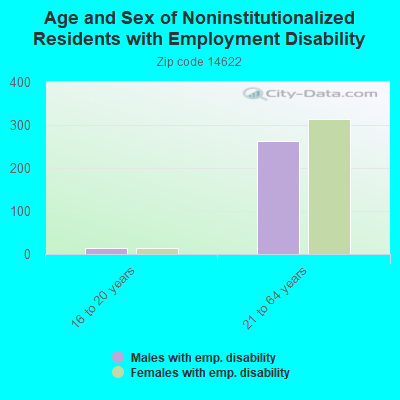
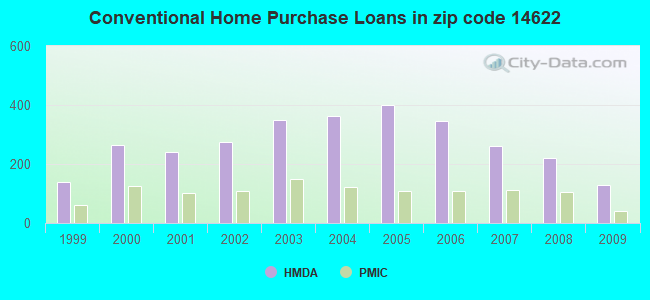
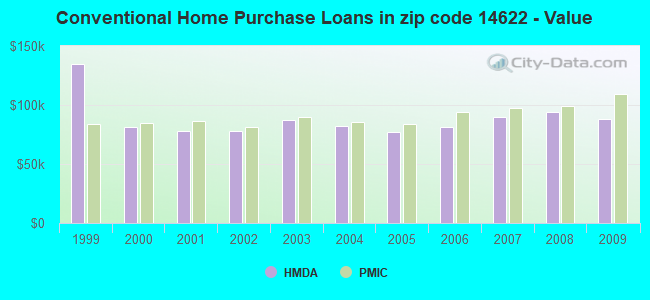
 Based on the data from the years 2002 - 2018 the average number of fire incidents per year is 61. The highest number of fires - 96 took place in 2018, and the least - 29 in 2008. The data has a rising trend.
 When looking into fire subcategories, the most incidents belonged to: Structure Fires (41.7%), and Outside Fires (35.5%).