Estimated zip code population in 2022: 32,452 Zip code population in 2010: 33,802 Zip code population in 2000: 35,977
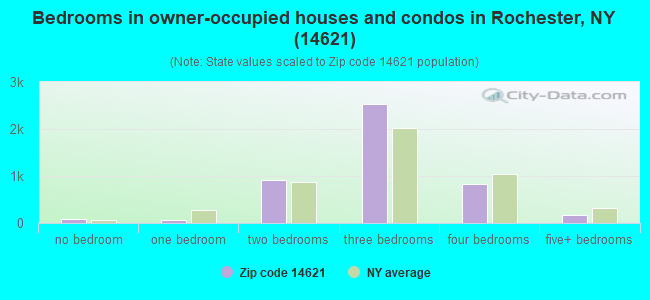
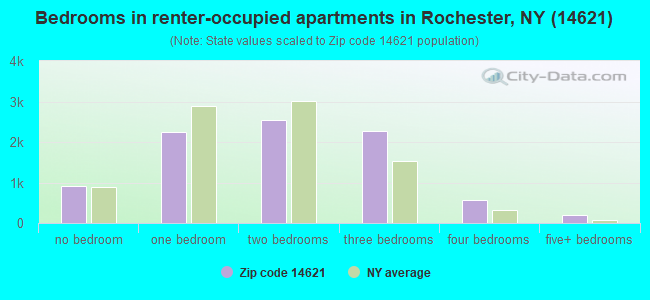
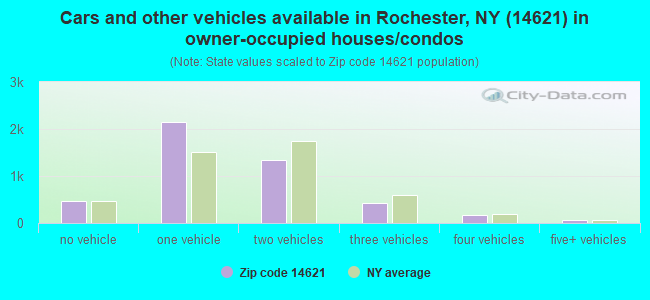
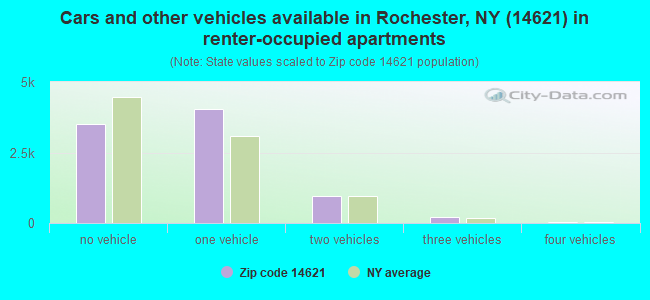
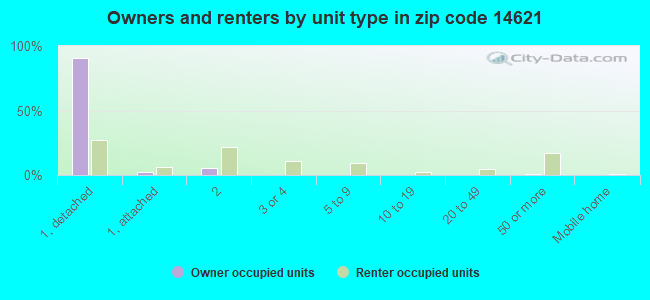
Houses and condos: 15,085 Renter-occupied apartments: 8,720
% of renters here:
66%
State:
46%
March 2022 cost of living index in zip code 14621: 101.8 (near average, U.S. average is 100)
Land area: 4.1 sq. mi. Water area: 0.1 sq. mi.
Population density: 7,871 people per square mile
(high).
OSM Map
General Map
Google Map
MSN Map
OSM Map
General Map
Google Map
MSN Map
OSM Map
General Map
Google Map
MSN Map
OSM Map
General Map
Google Map
MSN Map
Please wait while loading the map...
Real estate property taxes paid for housing units in 2022:
This zip code:
2.7% ($2,179)
New York:
1.5% ($6,180)
Median real estate property taxes paid for housing units with mortgages in 2022: $2,356 (2.7%) Median real estate property taxes paid for housing units with no mortgage in 2022: $1,890 (2.9%)
Averages for the 2020 tax year for zip code 14621, filed in 2021:
Average Adjusted Gross Income (AGI) in 2020: $28,924 (Individual Income Tax Returns)
Here:
$28,924
State:
$90,930
Salary/wage: $25,570 (reported on 88.3% of returns)
Here:
$25,570
State:
$72,104
(% of AGI for various income ranges: 1106.3% for AGIs below $25k, 3460.1% for AGIs $25k-50k, 7098.1% for AGIs $50k-75k, 10721.9% for AGIs $75k-100k, 14906.7% for AGIs $100k-200k)
Taxable interest for individuals: $453 (reported on 12.3% of returns)
This zip code:
$453
New York:
$3,075
(% of AGI for various income ranges: 3.1% for AGIs below $25k, 4.0% for AGIs $25k-50k, 18.1% for AGIs $50k-75k, 33.3% for AGIs $75k-100k, 155.0% for AGIs $100k-200k)
Ordinary dividends: $3,702 (reported on 3.5% of returns)
Here:
$3,702
State:
$11,095
(% of AGI for various income ranges: 3.1% for AGIs below $25k, 3.8% for AGIs $25k-50k, 20.5% for AGIs $50k-75k, 117.6% for AGIs $75k-100k, 805.0% for AGIs $100k-200k)
Net capital gain/loss in AGI: +$4,054 (reported on 2.9% of returns)
Here:
+$4,054
State:
+$44,925
(% of AGI for various income ranges: 3.3% for AGIs below $25k, 5.4% for AGIs $25k-50k, 41.7% for AGIs $50k-75k, 95.2% for AGIs $75k-100k, 540.0% for AGIs $100k-200k)
Profit/loss from business: +$6,209 (reported on 9.1% of returns)
Here:
+$6,209
State:
+$14,940
(% of AGI for various income ranges: 57.2% for AGIs below $25k, 45.5% for AGIs $25k-50k, 123.3% for AGIs $50k-75k, 312.4% for AGIs $75k-100k, 640.0% for AGIs $100k-200k)
Taxable individual retirement arrangement distribution: $11,985 (reported on 3.1% of returns)
14621:
$11,985
New York:
$19,609
(% of AGI for various income ranges: 18.3% for AGIs below $25k, 28.1% for AGIs $25k-50k, 101.4% for AGIs $50k-75k, 311.9% for AGIs $75k-100k, 1066.7% for AGIs $100k-200k)
Total itemized deductions: $24,735 (reported on 1.3% of returns)
Here:
$24,735
State:
$39,326
(% of AGI for various income ranges: 5.0% for AGIs below $25k, 26.6% for AGIs $25k-50k, 139.4% for AGIs $50k-75k, 378.1% for AGIs $75k-100k, 801.7% for AGIs $100k-200k)
Charity contributions: $7,692 (reported on 1.0% of returns)
Here:
$7,692
State:
$15,420
(% of AGI for various income ranges: 6.4% for AGIs $25k-50k, 34.4% for AGIs $50k-75k, 86.7% for AGIs $75k-100k, 242.5% for AGIs $100k-200k)
Taxes paid: $5,694 (reported on 1.3% of returns)
14621:
$5,694
State:
$9,183
(% of AGI for various income ranges: 0.9% for AGIs below $25k, 6.0% for AGIs $25k-50k, 35.9% for AGIs $50k-75k, 106.2% for AGIs $75k-100k, 141.7% for AGIs $100k-200k)
Earned income credit: $2,625 (reported on 40.4% of returns)
Here:
$2,625
State:
$2,138
(% of AGI for various income ranges: 160.6% for AGIs below $25k, 118.8% for AGIs $25k-50k, 1.7% for AGIs $50k-75k)
Percentage of individuals using paid preparers for their 2020 taxes: 94.5%
Here:
94%
State:
95%
(% for various income ranges: 94.5% for AGIs below $25k, 94.9% for AGIs $25k-50k, 92.0% for AGIs $50k-75k, 94.3% for AGIs $75k-100k, 100.0% for AGIs $100k-200k)
Averages for the 2012 tax year for zip code 14621, filed in 2013:
Average Adjusted Gross Income (AGI) in 2012: $23,858 (Individual Income Tax Returns)
Here:
$23,858
State:
$77,088
Salary/wage: $22,480 (reported on 87.2% of returns)
Here:
$22,480
State:
$60,593
(% of AGI for various income ranges: 79.3% for AGIs below $25k, 87.9% for AGIs $25k-50k, 81.4% for AGIs $50k-75k, 77.0% for AGIs $75k-100k, 70.2% for AGIs $100k-200k)
Taxable interest for individuals: $359 (reported on 16.7% of returns)
This zip code:
$359
New York:
$3,125
(% of AGI for various income ranges: 0.3% for AGIs below $25k, 0.2% for AGIs $25k-50k, 0.3% for AGIs $50k-75k, 0.2% for AGIs $75k-100k, 0.5% for AGIs $100k-200k)
Ordinary dividends: $2,933 (reported on 4.7% of returns)
Here:
$2,933
State:
$10,299
(% of AGI for various income ranges: 0.4% for AGIs below $25k, 0.4% for AGIs $25k-50k, 0.8% for AGIs $50k-75k, 0.9% for AGIs $75k-100k, 2.2% for AGIs $100k-200k)
Net capital gain/loss in AGI: +$580 (reported on 2.9% of returns)
Here:
+$580
State:
+$42,474
(% of AGI for various income ranges: 0.2% for AGIs $50k-75k, 0.5% for AGIs $100k-200k)
Profit/loss from business: +$7,898 (reported on 10.3% of returns)
Here:
+$7,898
State:
+$16,168
(% of AGI for various income ranges: 7.5% for AGIs below $25k, 1.3% for AGIs $25k-50k, 1.2% for AGIs $50k-75k, 2.8% for AGIs $75k-100k)
Taxable individual retirement arrangement distribution: $9,798 (reported on 4.5% of returns)
14621:
$9,798
New York:
$17,621
(% of AGI for various income ranges: 1.4% for AGIs below $25k, 1.3% for AGIs $25k-50k, 3.2% for AGIs $50k-75k, 5.6% for AGIs $75k-100k)
Total itemized deductions: $14,419 (27% of AGI, reported on 9.0% of returns)
Here:
$14,419
State:
$34,985
Here:
26.6% of AGI
State:
21.3% of AGI
(% of AGI for various income ranges: 2.1% for AGIs below $25k, 5.0% for AGIs $25k-50k, 8.5% for AGIs $50k-75k, 11.1% for AGIs $75k-100k, 12.5% for AGIs $100k-200k)
Charity contributions: $3,487 (reported on 6.8% of returns)
Here:
$3,487
State:
$5,572
(% of AGI for various income ranges: 0.2% for AGIs below $25k, 0.8% for AGIs $25k-50k, 1.7% for AGIs $50k-75k, 2.7% for AGIs $75k-100k, 3.0% for AGIs $100k-200k)
Taxes paid: $5,092 (reported on 8.9% of returns)
14621:
$5,092
State:
$18,656
(% of AGI for various income ranges: 0.5% for AGIs below $25k, 1.5% for AGIs $25k-50k, 3.0% for AGIs $50k-75k, 4.6% for AGIs $75k-100k, 6.4% for AGIs $100k-200k)
Earned income credit: $2,678 (reported on 47.1% of returns)
Here:
$2,678
State:
$2,230
(% of AGI for various income ranges: 13.2% for AGIs below $25k, 2.1% for AGIs $25k-50k)
Percentage of individuals using paid preparers for their 2012 taxes: 47.9%
Here:
48%
State:
66%
(% for various income ranges: 46.5% for AGIs below $25k, 47.4% for AGIs $25k-50k, 57.5% for AGIs $50k-75k, 60.9% for AGIs $75k-100k, 66.7% for AGIs $100k-200k)
Averages for the 2004 tax year for zip code 14621, filed in 2005:
Average Adjusted Gross Income (AGI) in 2004: $22,200 (Individual Income Tax Returns)
Here:
$22,200
State:
$59,519
Salary/wage: $21,141 (reported on 88.5% of returns)
Here:
$21,141
State:
$50,673
(% of AGI for various income ranges: 83.5% for AGIs below $10k, 85.4% for AGIs $10k-25k, 88.2% for AGIs $25k-50k, 84.7% for AGIs $50k-75k, 79.9% for AGIs $75k-100k, 55.8% for AGIs over 100k)
Taxable interest for individuals: $774 (reported on 24.4% of returns)
This zip code:
$774
New York:
$2,377
(% of AGI for various income ranges: 1.4% for AGIs below $10k, 0.8% for AGIs $10k-25k, 0.8% for AGIs $25k-50k, 0.8% for AGIs $50k-75k, 0.7% for AGIs $75k-100k, 1.8% for AGIs over 100k)
Taxable dividends: $1,770 (reported on 8.9% of returns)
Here:
$1,770
State:
$5,394
(% of AGI for various income ranges: 1.1% for AGIs below $10k, 0.5% for AGIs $10k-25k, 0.5% for AGIs $25k-50k, 0.4% for AGIs $50k-75k, 1.5% for AGIs $75k-100k, 3.1% for AGIs over 100k)
Net capital gain/loss: +$3,902 (reported on 5.0% of returns)
Here:
+$3,902
State:
+$23,581
(% of AGI for various income ranges: -0.6% for AGIs below $10k, 0.2% for AGIs $10k-25k, 0.3% for AGIs $25k-50k, 0.9% for AGIs $50k-75k, 1.5% for AGIs $75k-100k, 9.7% for AGIs over 100k)
Profit/loss from business: +$5,363 (reported on 8.6% of returns)
Here:
+$5,363
State:
+$13,809
(% of AGI for various income ranges: 7.7% for AGIs below $10k, 3.0% for AGIs $10k-25k, 1.5% for AGIs $25k-50k, 1.0% for AGIs $50k-75k, 0.1% for AGIs $75k-100k)
IRA payment deduction: $1,903 (reported on 1.0% of returns)
14621:
$1,903
New York:
$3,115
Total itemized deductions: $12,397 (26% of AGI, reported on 13.1% of returns)
Here:
$12,397
State:
$25,864
Here:
25.6% of AGI
State:
21.9% of AGI
(% of AGI for various income ranges: 3.4% for AGIs below $10k, 3.7% for AGIs $10k-25k, 7.8% for AGIs $25k-50k, 10.2% for AGIs $50k-75k, 12.6% for AGIs $75k-100k, 13.1% for AGIs over 100k)
Charity contributions deductions: $2,704 (5% of AGI, reported on 11.3% of returns)
Here:
$2,704
State:
$4,439
Here:
5.3% of AGI
State:
3.6% of AGI
(% of AGI for various income ranges: 0.1% for AGIs below $10k, 0.5% for AGIs $10k-25k, 1.4% for AGIs $25k-50k, 2.3% for AGIs $50k-75k, 2.7% for AGIs $75k-100k, 3.3% for AGIs over 100k)
Total tax: $2,607 (reported on 52.8% of returns)
14621:
$2,607
State:
$11,730
(% of AGI for various income ranges: 1.9% for AGIs below $10k, 2.8% for AGIs $10k-25k, 6.0% for AGIs $25k-50k, 9.2% for AGIs $50k-75k, 11.4% for AGIs $75k-100k, 16.7% for AGIs over 100k)
Earned income credit: $1,965 (reported on 44.7% of returns)
Here:
$1,965
State:
$1,757
Percentage of individuals using paid preparers for their 2004 taxes: 71.2%
Here:
71%
State:
67%
(% for various income ranges: 70.5% for AGIs below $10k, 74.6% for AGIs $10k-25k, 68.0% for AGIs $25k-50k, 67.3% for AGIs $50k-75k, 66.5% for AGIs $75k-100k, 65.9% for AGIs over 100k)
Likely homosexual households (counted as self-reported same-sex unmarried-partner households)
Lesbian couples: 0.3% of all households
Gay men: 0.1% of all households
Household received Food Stamps/SNAP in the past 12 months: 6,648 Household did not receive Food Stamps/SNAP in the past 12 months: 7,154
Women who had a birth in the past 12 months: 419 (72 now married, 358 unmarried) Women who did not have a birth in the past 12 months: 7,531 (1,704 now married, 5,877 unmarried)
Housing units in zip code 14621 with a mortgage: 2,730 (310 second mortgage, 22 home equity loan, 273 both second mortgage and home equity loan) Houses without a mortgage: 213
Median monthly owner costs for units with a mortgage: $923 Median monthly owner costs for units without a mortgage: $432
Residents with income below the poverty level in 2022:
This zip code:
36.6%
Whole state:
14.3%
Residents with income below 50% of the poverty level in 2022:
This zip code:
19.0%
Whole state:
6.8%
Median number of rooms in houses and condos:
Here:
6.0
State:
6.3
Median number of rooms in apartments:
Here:
4.3
State:
3.8
Notable locations in this zip code not listed on our city pages
Notable locations in zip code 14621: Seneca Park Zoo (A), Baird Nursing Home (B), Chapel Oaks (C), Jennifer Matthew Nursing and Rehabilitation Center (D), Saint Anns Community Nursing Home (E), Centro de Oro Senior Center (F), Just Friends Senior Center (G), Rochester Public Library Lincoln Branch (H), Rochester Fire Department Engine 16 (I), Rochester Fire Department Quint 6 / Midi 6 (J), Hudson - Ridge Tower (K), Seneca Towers (L). Display/hide their locations on the map
Churches in zip code 14621 include: Abundant Life Ministries (A), Breath of Life Seventh Day Adventist Church (B), Calvary Bible Baptist Church (C), Charity Bible Baptist Church (D), Christ Tabernacle Apostolic Church (E), Church of God of Prophecy (F), Congregation B'Nai Israel (G), Emanuel Christian Church (H), Ephraim Full Gospel Christian Church (I). Display/hide their locations on the map
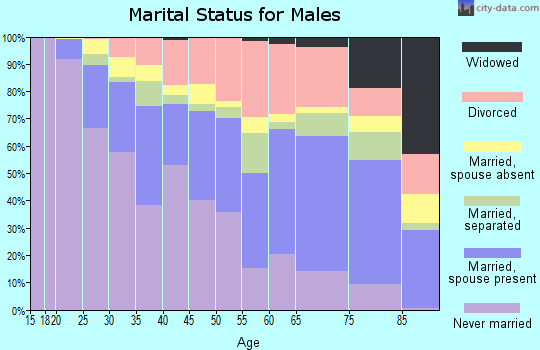
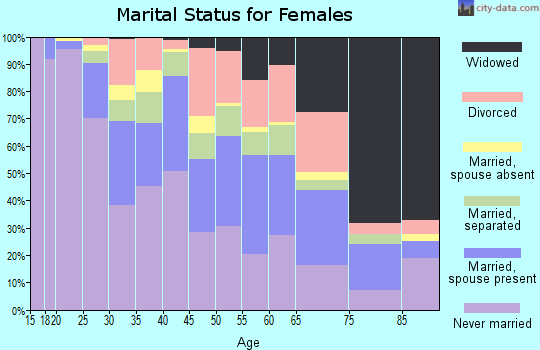
1,903 married couples with children.
4,981 single-parent households (412 men, 4,569 women).
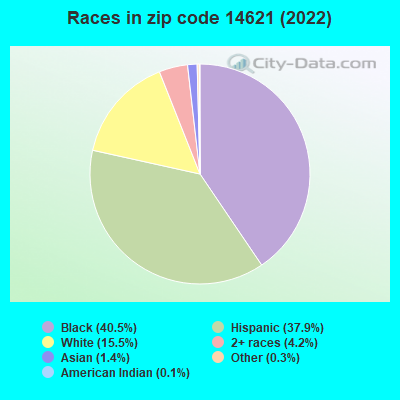
64.1% of residents of 14621 zip code speak English at home.
31.0% of residents speak Spanish at home (51% very well, 23% well, 17% not well, 9% not at all).
1.6% of residents speak other Indo-European language at home (54% very well, 14% well, 25% not well, 7% not at all).
2.3% of residents speak Asian or Pacific Island language at home (53% very well, 13% well, 29% not well, 5% not at all).
0.6% of residents speak other language at home (47% very well, 39% well, 7% not well, 6% not at all).
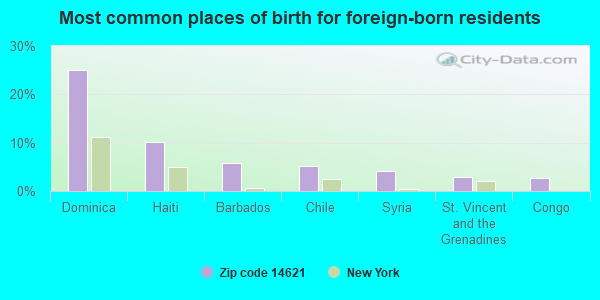
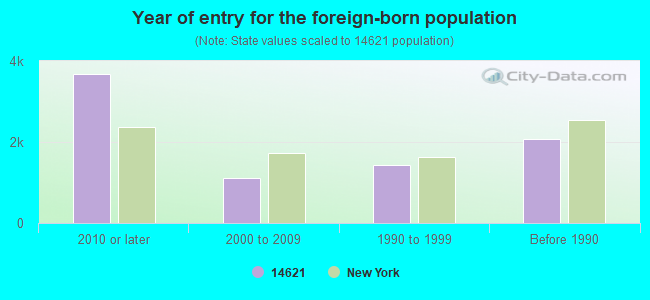
Foreign born population: 2,783 (8.6%) (56.8% of them are naturalized citizens)
Major facilities with environmental interests located in this zip code:
COATING TECHNOLOGY-FORMERLY BASTION PLTG (1600 NORTH CLINTON AVENUE in ROCHESTER, NY)
AIR MINOR (AIRS/AFS) - ICIS-, ENFORCEMENT/COMPLIANCE ACTIVITY STATE MASTER (New York facility tracking) - AIR PROGRAM, HAZARDOUS WASTE PROGRAM HAZARDOUS WASTE BIENNIAL REPORTER (Resource Conservation and Recovery Act (tracking hazardous waste)) Large Quantity Generators, more that 1000 kg of hazardous waste/month (Resource Conservation and Recovery Act (tracking hazardous waste)) - notification Business SIC and NAICS classification: ELECTROPLATING, PLATING, POLISHING, ANODIZING, AND COLORING Organizations: BASTIAN GROUP (CONTACT/OWNER)
, COATING TECHNOLOGY INC (LEGALLY RESPONSIBLE PARTY)
Alternative names: COATING TECHNOLOGY INC
BENJAMIN FRANKLIN HS ( in ROCHESTER, NY)
(National Center for Education Statistics) - STATE ID-261600010062 Organizations: ROCHESTER CITY SD (SCHOOL DISTRICT)
BENJAMIN FRANKLIN MONTESSORI SCHOOL ( in ROCHESTER, NY)
(National Center for Education Statistics) - STATE ID-261600010053 Organizations: ROCHESTER CITY SD (SCHOOL DISTRICT)
BEN FRANKLIN SCHOOL (950 NORTON STREET in ROCHESTER, NY)
ENFORCEMENT/COMPLIANCE ACTIVITY (Integrated Compliance Information System) COMPLIANCE ACTIVITY (Tracking inspections of insecticide, fungicide, and rodenticide, and toxic substances) Small Quantity Generators, between 100 kg and 1000 kg of hazardous waste/month (Resource Conservation and Recovery Act (tracking hazardous waste)) Organizations: ROCHESTER CITY SCHOOL DIST (CONTACT/OPERATOR)
Alternative names: BENJAMIN FRANKLIN EDUCATIONAL CAMPUS, BENJAMIN FRANKLIN EDUCATIONAL COMPLEX, ROCHESTER CSD - FRANKLIN HIGH SCHOOL
ARAMARK UNIFORM SERVICES - SYRACUSE LLC (501-513 WILKINS ST in ROCHESTER, NY)
Large Quantity Generators, more that 1000 kg of hazardous waste/month (Resource Conservation and Recovery Act (tracking hazardous waste)) Organizations: ARAMARK UNIFORM SERVICES (SYRACUSE LLC) (CONTACT/OPERATOR)
HILLS STORES CO (1111 E RIDGE RD in ROCHESTER, NY)
(Resource Conservation and Recovery Act (tracking hazardous waste))
ANTONELLI TIRE (630 RIDGE RD E in ROCHESTER, NY)
(Resource Conservation and Recovery Act (tracking hazardous waste))
HAWVER INC (140 CARTER ST in ROCHESTER, NY)
Conditionally Exempt Small Quantity Generators, less than 100 kg/month of hazardous waste (Resource Conservation and Recovery Act (tracking hazardous waste)) Organizations: TIMOTHY CULVER (CONTACT/OPERATOR)
HECHINGER #51 (1500 HUDSON AVE in ROCHESTER, NY)
(Resource Conservation and Recovery Act (tracking hazardous waste))
HICKEY-FREEMAN (1155 CLINTON AVE N in ROCHESTER, NY)
(Resource Conservation and Recovery Act (tracking hazardous waste))
HOME DEPOT THE 1273 (1111 E RIDGE RD LOT 2 in ROCHESTER, NY)
Conditionally Exempt Small Quantity Generators, less than 100 kg/month of hazardous waste (Resource Conservation and Recovery Act (tracking hazardous waste)) Organizations: THE HOME DEPOT USA (CONTACT/OPERATOR)
IMPERIAL GARDENS APARTMENTS (468 RIDGE ROAD EAST in ROCHESTER, NY)
ENFORCEMENT/COMPLIANCE ACTIVITY (Integrated Compliance Information System) COMPLIANCE ACTIVITY (Tracking inspections of insecticide, fungicide, and rodenticide, and toxic substances) Business SIC classification: OPERATORS OF APARTMENT BUILDINGS Alternative names: IMPERIAL GARDEN APTS
CONVENIENT FOOD MART (1404 NORTON ST in ROCHESTER, NY)
(Resource Conservation and Recovery Act (tracking hazardous waste))
Housing units lacking complete plumbing facilities: 2.6% Housing units lacking complete kitchen facilities: 2.1%
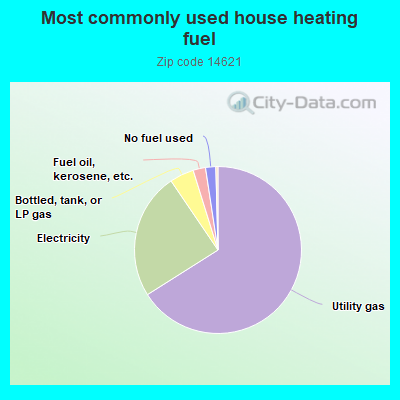
66.1%Utility gas
24.5%Electricity
4.7%Bottled, tank, or LP gas
2.4%Fuel oil, kerosene, etc.
2.0%No fuel used
Population in 1990: 36,055.
Place of birth for U.S.-born residents:
This state: 19,601
Northeast: 818
Midwest: 480
South: 3,245
West: 192
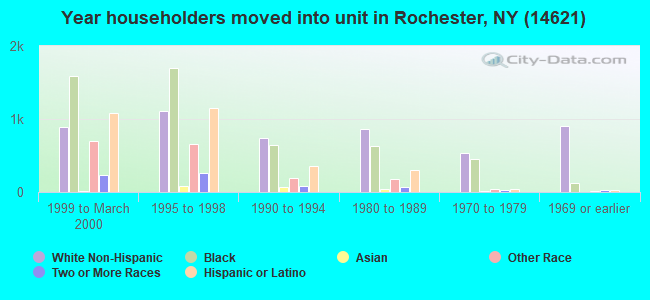
50% of the 14621 zip code residents lived in the same house 5 years ago. Out of people who lived in different houses, 89% lived in this county. Out of people who lived in different counties, 50% lived in New York.
87% of the 14621 zip code residents lived in the same house 1 year ago. Out of people who lived in different houses, 72% moved from this county. Out of people who lived in different houses, 9% moved from different county within same state. Out of people who lived in different houses, 6% moved from different state. Out of people who lived in different houses, 11% moved from abroad.
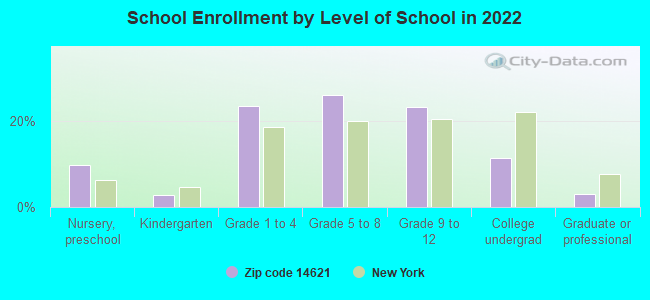
Private vs. public school enrollment:
Students in private schools in grades 1 to 8 (elementary and middle school): 271
Here:
6.8%
New York:
15.6%
Students in private schools in grades 9 to 12 (high school): 190
Here:
10.2%
New York:
15.0%
Students in private undergraduate colleges: 214
Here:
23.7%
New York:
39.2%
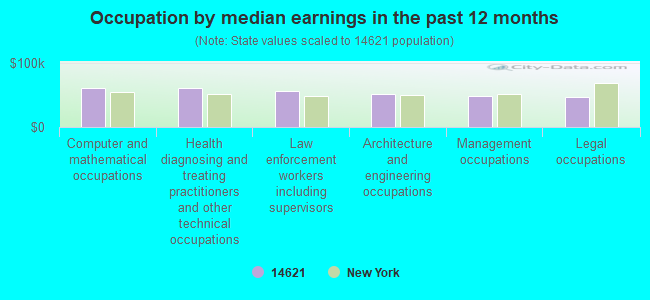
Occupation by median earnings in the past 12 months ($)
61,107Computer and mathematical occupations
60,506Health diagnosing and treating practitioners and other technical occupations
55,570Law enforcement workers including supervisors
51,883Architecture and engineering occupations
48,686Management occupations
45,990Legal occupations
Companies with federal contracts located in this zip code (ROCHESTER, NY):
EASTMAN KODAK COMPANY INC (1187 RIDGE RD E) : $1,555,609 in 16 contractsfrom 1999 to 2005
Contracts for Photographic Supplies, Physical Properties Testing and Inspection, Printing, Duplicating, and Bookbinding Equipment, Photographic Equipment and Accessories, and moreby Defense Logistics Agency, Department of Veterans Affairs, Geological Survey Signed by year:2000: $1,343,323; 2001: $0; 2002: $0; 2003: $0; 2004: $0; 2005: $10,256; 2006: $0.
Biggest contracts:
$231,725 with Defense Logistics Agency for Photographic Supplies. Signed on 2000-09-06. Completion date: 2000-12-05.
$226,837, same as above.Signed on 2000-02-26. Completion date: 2000-05-26.
$210,068, same as above.Signed on 2000-06-28. Completion date: 2000-09-24.
$202,030, same as above.Signed on 1999-12-14. Completion date: 2000-03-14.
OPTICAL GAGING PRODUCTS, INC (850 HUDSON AVE; small business) : $765,574 in 15 contractsfrom 2002 to 2006
Contracts for Optical Instruments, Test Equipment, Components and Accessories, Miscellaneous Items, Miscellaneous Special Industry Machinery, Combination and Miscellaneous Instruments, and moreby NASA, Army, Defense Logistics Agency, Bureau of Engraving and Printing, and others Signed by year:2000: $0; 2001: $0; 2002: $40,110; 2003: $42,870; 2004: $259,310; 2005: $418,934; 2006: $4,350.
Biggest contracts:
$208,830 with NASA for Optical Instruments, Test Equipment, Components and Accessories. Signed on 2005-09-29. Completion date: 2005-12-16.
$133,000 with Army for Optical Instruments, Test Equipment, Components and Accessories. Signed on 2004-05-21. Completion date: 2004-07-16.
$75,839 with Defense Logistics Agency for Miscellaneous Items. Signed on 2005-02-22. Completion date: 2005-06-14.
$67,165 with Bureau of Engraving and Printing for Miscellaneous Special Industry Machinery. Signed on 2004-06-10. Completion date: 2004-08-19.
OPTICAL GAGING PRODUCTS, INC (850 HUDSON AVE; small business) : $383,924 in 12 contractsfrom 2000 to 2006
Contracts for Paints, Dopes, Varnishes, and Related Products, Laboratory Equipment and Supplies, Physical Properties Testing and Inspection, Navigational Instruments, and moreby Air Force, Navy, Army Signed by year:2000: $58,120; 2001: -$150; 2002: $83,385; 2003: $238,359; 2004: $24,000; 2005: -$15,290; 2006: -$4,500.
Biggest contracts:
$83,385 with Air Force for Paints, Dopes, Varnishes, and Related Products. Signed on 2002-09-18. Completion date: 2002-10-30.
$70,572 with Air Force for Laboratory Equipment and Supplies. Signed on 2003-05-15. Completion date: 2003-07-31.
$70,537 with Air Force for Physical Properties Testing and Inspection. Signed on 2003-01-06. Completion date: 2003-03-30.
$70,407, same as above.Signed on 2003-02-11. Completion date: 2003-05-30.
EXTRA PACKAGING CORP (24 SENECA AVE; small business)
$24,088 with Navy for Bags and Sacks. Signed on 2006-03-28. Completion date: 2006-05-15.
JOSEPH P O'DONNELL & ASSOCIAT (150 VERSAILLES RD)
$5,924 with Army for Carpet Laying and Cleaning. Signed on 2005-07-27. Completion date: 2005-05-23.
AMERICAN TIME MANUFACTURING LT (1600 N CLINTON AVENUE)
$5,000 with Navy for Telecommunications Network Management Services. Signed on 2005-05-25. Completion date: 2005-09-30.
Top industries in this zip code by the number of employees in 2005:
Health Care and Social Assistance: General Medical and Surgical Hospitals (over 1000 employees: 1 establishment)
Health Care and Social Assistance: Nursing Care Facilities (500-999: 1, 100-249: 1, 20-49: 1)
2003 - 2018 National Fire Incident Reporting System (NFIRS) incidents
Based on the data from the years 2003 - 2018 the average number of fire incidents per year is 199. The highest number of fires - 320 took place in 2007, and the least - 6 in 2004. The data has a rising trend.
When looking into fire subcategories, the most incidents belonged to: Structure Fires (53.5%), and Outside Fires (29.9%).
Fire incident types reported to NFIRS in Zip Code 14621

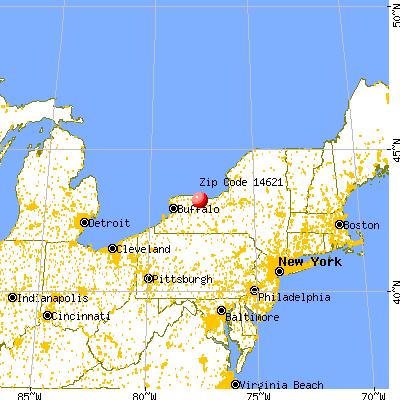


 Nearest zip codes: 14605, 14604, 14614, 14617, 14613, 14608.


 Based on the data from the years 2003 - 2018 the average number of fire incidents per year is 199. The highest number of fires - 320 took place in 2007, and the least - 6 in 2004. The data has a rising trend.
 When looking into fire subcategories, the most incidents belonged to: Structure Fires (53.5%), and Outside Fires (29.9%).