Estimated zip code population in 2022: 27,295 Zip code population in 2010: 28,255 Zip code population in 2000: 29,187
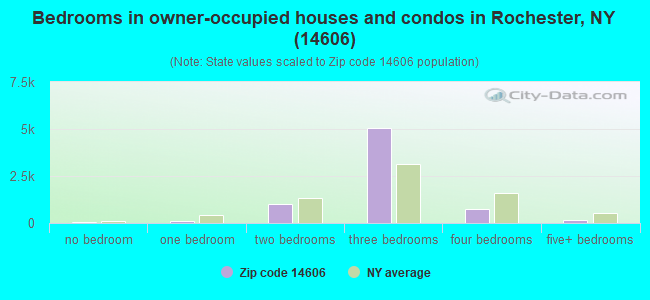
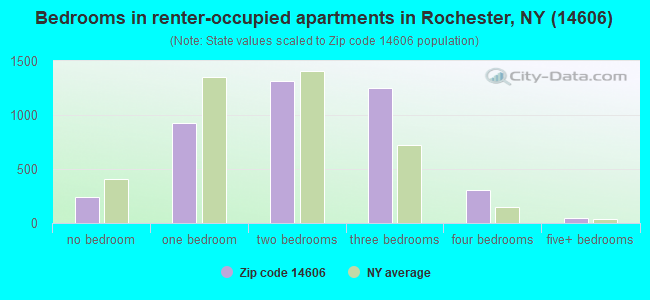
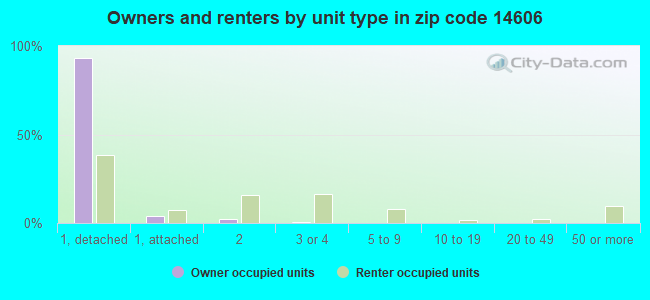
Houses and condos: 11,966 Renter-occupied apartments: 4,093
% of renters here:
37%
State:
46%
March 2022 cost of living index in zip code 14606: 102.1 (near average, U.S. average is 100)
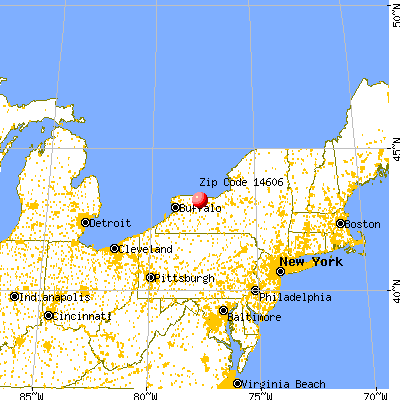
Land area: 9.7 sq. mi. Water area: 0.1 sq. mi.
Population density: 2,806 people per square mile
(average).
OSM Map
General Map
Google Map
MSN Map
OSM Map
General Map
Google Map
MSN Map
OSM Map
General Map
Google Map
MSN Map
OSM Map
General Map
Google Map
MSN Map
Please wait while loading the map...
Real estate property taxes paid for housing units in 2022:
This zip code:
2.8% ($4,055)
New York:
1.5% ($6,180)
Median real estate property taxes paid for housing units with mortgages in 2022: $4,185 (2.9%) Median real estate property taxes paid for housing units with no mortgage in 2022: $3,798 (2.7%)
Averages for the 2020 tax year for zip code 14606, filed in 2021:
Average Adjusted Gross Income (AGI) in 2020: $42,426 (Individual Income Tax Returns)
Here:
$42,426
State:
$90,930
Salary/wage: $37,384 (reported on 84.5% of returns)
Here:
$37,384
State:
$72,104
(% of AGI for various income ranges: 1092.6% for AGIs below $25k, 3431.9% for AGIs $25k-50k, 6553.5% for AGIs $50k-75k, 9755.7% for AGIs $75k-100k, 16425.4% for AGIs $100k-200k, 52800.0% for AGIs over 200k)
Taxable interest for individuals: $595 (reported on 30.5% of returns)
This zip code:
$595
New York:
$3,075
(% of AGI for various income ranges: 9.2% for AGIs below $25k, 10.1% for AGIs $25k-50k, 20.3% for AGIs $50k-75k, 42.4% for AGIs $75k-100k, 141.9% for AGIs $100k-200k, 2035.0% for AGIs over 200k)
Ordinary dividends: $2,442 (reported on 10.8% of returns)
Here:
$2,442
State:
$11,095
(% of AGI for various income ranges: 11.1% for AGIs below $25k, 15.5% for AGIs $25k-50k, 46.5% for AGIs $50k-75k, 66.0% for AGIs $75k-100k, 168.8% for AGIs $100k-200k, 2785.0% for AGIs over 200k)
Net capital gain/loss in AGI: +$5,479 (reported on 9.0% of returns)
Here:
+$5,479
State:
+$44,925
(% of AGI for various income ranges: 2.0% for AGIs below $25k, 13.6% for AGIs $25k-50k, 49.3% for AGIs $50k-75k, 103.1% for AGIs $75k-100k, 421.2% for AGIs $100k-200k, 12620.0% for AGIs over 200k)
Profit/loss from business: +$6,430 (reported on 10.2% of returns)
Here:
+$6,430
State:
+$14,940
(% of AGI for various income ranges: 57.7% for AGIs below $25k, 66.9% for AGIs $25k-50k, 98.4% for AGIs $50k-75k, 167.0% for AGIs $75k-100k, 308.5% for AGIs $100k-200k)
Taxable individual retirement arrangement distribution: $14,638 (reported on 8.7% of returns)
14606:
$14,638
New York:
$19,609
(% of AGI for various income ranges: 59.2% for AGIs below $25k, 91.7% for AGIs $25k-50k, 246.4% for AGIs $50k-75k, 397.4% for AGIs $75k-100k, 801.5% for AGIs $100k-200k, 5595.0% for AGIs over 200k)
Total itemized deductions: $22,233 (reported on 3.4% of returns)
Here:
$22,233
State:
$39,326
(% of AGI for various income ranges: 15.2% for AGIs below $25k, 48.1% for AGIs $25k-50k, 185.0% for AGIs $50k-75k, 266.4% for AGIs $75k-100k, 631.9% for AGIs $100k-200k)
Charity contributions: $5,497 (reported on 2.5% of returns)
Here:
$5,497
State:
$15,420
(% of AGI for various income ranges: 9.4% for AGIs $25k-50k, 29.9% for AGIs $50k-75k, 47.3% for AGIs $75k-100k, 144.4% for AGIs $100k-200k)
Taxes paid: $7,640 (reported on 3.4% of returns)
14606:
$7,640
State:
$9,183
(% of AGI for various income ranges: 3.6% for AGIs below $25k, 15.5% for AGIs $25k-50k, 78.0% for AGIs $50k-75k, 114.0% for AGIs $75k-100k, 181.7% for AGIs $100k-200k)
Earned income credit: $2,409 (reported on 23.0% of returns)
Here:
$2,409
State:
$2,138
(% of AGI for various income ranges: 113.6% for AGIs below $25k, 81.3% for AGIs $25k-50k, 1.0% for AGIs $50k-75k)
Percentage of individuals using paid preparers for their 2020 taxes: 94.9%
Here:
95%
State:
95%
(% for various income ranges: 94.2% for AGIs below $25k, 95.7% for AGIs $25k-50k, 94.0% for AGIs $50k-75k, 96.1% for AGIs $75k-100k, 95.6% for AGIs $100k-200k, 85.7% for AGIs over 200k)
Averages for the 2012 tax year for zip code 14606, filed in 2013:
Average Adjusted Gross Income (AGI) in 2012: $35,090 (Individual Income Tax Returns)
Here:
$35,090
State:
$77,088
Salary/wage: $32,342 (reported on 85.5% of returns)
Here:
$32,342
State:
$60,593
(% of AGI for various income ranges: 73.9% for AGIs below $25k, 81.4% for AGIs $25k-50k, 80.3% for AGIs $50k-75k, 79.1% for AGIs $75k-100k, 80.6% for AGIs $100k-200k, 45.4% for AGIs over 200k)
Taxable interest for individuals: $395 (reported on 35.2% of returns)
This zip code:
$395
New York:
$3,125
(% of AGI for various income ranges: 0.5% for AGIs below $25k, 0.3% for AGIs $25k-50k, 0.5% for AGIs $50k-75k, 0.3% for AGIs $75k-100k, 0.3% for AGIs $100k-200k, 0.4% for AGIs over 200k)
Ordinary dividends: $1,548 (reported on 12.3% of returns)
Here:
$1,548
State:
$10,299
(% of AGI for various income ranges: 0.7% for AGIs below $25k, 0.5% for AGIs $25k-50k, 0.5% for AGIs $50k-75k, 0.5% for AGIs $75k-100k, 0.6% for AGIs $100k-200k)
Net capital gain/loss in AGI: +$1,340 (reported on 7.6% of returns)
Here:
+$1,340
State:
+$42,474
(% of AGI for various income ranges: 0.1% for AGIs $25k-50k, 0.1% for AGIs $50k-75k, 0.2% for AGIs $75k-100k, 1.6% for AGIs $100k-200k)
Profit/loss from business: +$7,419 (reported on 10.2% of returns)
Here:
+$7,419
State:
+$16,168
(% of AGI for various income ranges: 5.8% for AGIs below $25k, 1.7% for AGIs $25k-50k, 1.4% for AGIs $50k-75k, 1.0% for AGIs $75k-100k, 1.4% for AGIs $100k-200k)
Taxable individual retirement arrangement distribution: $10,248 (reported on 9.7% of returns)
14606:
$10,248
New York:
$17,621
(% of AGI for various income ranges: 3.0% for AGIs below $25k, 2.4% for AGIs $25k-50k, 2.9% for AGIs $50k-75k, 2.9% for AGIs $75k-100k, 3.7% for AGIs $100k-200k)
Total itemized deductions: $15,548 (24% of AGI, reported on 22.9% of returns)
Here:
$15,548
State:
$34,985
Here:
23.8% of AGI
State:
21.3% of AGI
(% of AGI for various income ranges: 4.5% for AGIs below $25k, 8.4% for AGIs $25k-50k, 11.9% for AGIs $50k-75k, 12.5% for AGIs $75k-100k, 14.8% for AGIs $100k-200k, 14.6% for AGIs over 200k)
Charity contributions: $2,244 (reported on 18.3% of returns)
Here:
$2,244
State:
$5,572
(% of AGI for various income ranges: 0.4% for AGIs below $25k, 0.9% for AGIs $25k-50k, 1.5% for AGIs $50k-75k, 1.5% for AGIs $75k-100k, 2.1% for AGIs $100k-200k)
Taxes paid: $7,117 (reported on 22.8% of returns)
14606:
$7,117
State:
$18,656
(% of AGI for various income ranges: 1.4% for AGIs below $25k, 3.3% for AGIs $25k-50k, 5.4% for AGIs $50k-75k, 6.2% for AGIs $75k-100k, 7.9% for AGIs $100k-200k, 7.2% for AGIs over 200k)
Earned income credit: $2,358 (reported on 26.8% of returns)
Here:
$2,358
State:
$2,230
(% of AGI for various income ranges: 8.3% for AGIs below $25k, 1.3% for AGIs $25k-50k)
Percentage of individuals using paid preparers for their 2012 taxes: 49.1%
Here:
49%
State:
66%
(% for various income ranges: 45.3% for AGIs below $25k, 48.4% for AGIs $25k-50k, 57.4% for AGIs $50k-75k, 56.5% for AGIs $75k-100k, 60.0% for AGIs $100k-200k, 66.7% for AGIs over 200k)
Averages for the 2004 tax year for zip code 14606, filed in 2005:
Average Adjusted Gross Income (AGI) in 2004: $31,478 (Individual Income Tax Returns)
Here:
$31,478
State:
$59,519
Salary/wage: $29,568 (reported on 88.4% of returns)
Here:
$29,568
State:
$50,673
(% of AGI for various income ranges: 108.1% for AGIs below $10k, 76.5% for AGIs $10k-25k, 84.7% for AGIs $25k-50k, 84.1% for AGIs $50k-75k, 86.1% for AGIs $75k-100k, 73.3% for AGIs over 100k)
Taxable interest for individuals: $610 (reported on 48.6% of returns)
This zip code:
$610
New York:
$2,377
(% of AGI for various income ranges: 2.7% for AGIs below $10k, 1.4% for AGIs $10k-25k, 0.7% for AGIs $25k-50k, 0.7% for AGIs $50k-75k, 0.5% for AGIs $75k-100k, 1.8% for AGIs over 100k)
Taxable dividends: $896 (reported on 18.9% of returns)
Here:
$896
State:
$5,394
(% of AGI for various income ranges: 1.5% for AGIs below $10k, 0.8% for AGIs $10k-25k, 0.4% for AGIs $25k-50k, 0.3% for AGIs $50k-75k, 0.4% for AGIs $75k-100k, 1.0% for AGIs over 100k)
Net capital gain/loss: +$1,163 (reported on 12.0% of returns)
Here:
+$1,163
State:
+$23,581
(% of AGI for various income ranges: -1.8% for AGIs below $10k, -0.0% for AGIs $10k-25k, 0.2% for AGIs $25k-50k, 0.2% for AGIs $50k-75k, 0.3% for AGIs $75k-100k, 3.6% for AGIs over 100k)
Profit/loss from business: +$5,990 (reported on 9.5% of returns)
Here:
+$5,990
State:
+$13,809
(% of AGI for various income ranges: 5.6% for AGIs below $10k, 3.5% for AGIs $10k-25k, 1.4% for AGIs $25k-50k, 1.4% for AGIs $50k-75k, 0.9% for AGIs $75k-100k, 1.9% for AGIs over 100k)
IRA payment deduction: $2,459 (reported on 1.8% of returns)
14606:
$2,459
New York:
$3,115
(% of AGI for various income ranges: 0.2% for AGIs $10k-25k, 0.2% for AGIs $25k-50k, 0.1% for AGIs $50k-75k, 0.1% for AGIs $75k-100k)
Self-employed pension: $6,556 (reported on 0.2% of returns)
Here:
$6,556
New York:
$19,016
Total itemized deductions: $13,175 (23% of AGI, reported on 28.1% of returns)
Here:
$13,175
State:
$25,864
Here:
23.2% of AGI
State:
21.9% of AGI
(% of AGI for various income ranges: 7.1% for AGIs below $10k, 5.6% for AGIs $10k-25k, 10.7% for AGIs $25k-50k, 14.5% for AGIs $50k-75k, 15.0% for AGIs $75k-100k, 14.9% for AGIs over 100k)
Charity contributions deductions: $2,028 (3% of AGI, reported on 25.8% of returns)
Here:
$2,028
State:
$4,439
Here:
3.5% of AGI
State:
3.6% of AGI
(% of AGI for various income ranges: 0.4% for AGIs below $10k, 0.6% for AGIs $10k-25k, 1.4% for AGIs $25k-50k, 2.1% for AGIs $50k-75k, 2.3% for AGIs $75k-100k, 2.7% for AGIs over 100k)
Total tax: $3,535 (reported on 69.8% of returns)
14606:
$3,535
State:
$11,730
(% of AGI for various income ranges: 2.3% for AGIs below $10k, 3.6% for AGIs $10k-25k, 6.8% for AGIs $25k-50k, 8.6% for AGIs $50k-75k, 10.3% for AGIs $75k-100k, 14.4% for AGIs over 100k)
Earned income credit: $1,764 (reported on 22.5% of returns)
Here:
$1,764
State:
$1,757
Percentage of individuals using paid preparers for their 2004 taxes: 64.2%
Here:
64%
State:
67%
(% for various income ranges: 58.3% for AGIs below $10k, 68.3% for AGIs $10k-25k, 64.1% for AGIs $25k-50k, 65.1% for AGIs $50k-75k, 63.9% for AGIs $75k-100k, 63.2% for AGIs over 100k)
Likely homosexual households (counted as self-reported same-sex unmarried-partner households)
Lesbian couples: 0.5% of all households
Gay men: 0.0% of all households
Household received Food Stamps/SNAP in the past 12 months: 2,892 Household did not receive Food Stamps/SNAP in the past 12 months: 8,446
Women who had a birth in the past 12 months: 277 (164 now married, 114 unmarried) Women who did not have a birth in the past 12 months: 5,671 (1,592 now married, 4,101 unmarried)
Housing units in zip code 14606 with a mortgage: 4,399 (444 second mortgage, 18 home equity loan, 370 both second mortgage and home equity loan) Houses without a mortgage: 106
Median monthly owner costs for units with a mortgage: $1,285 Median monthly owner costs for units without a mortgage: $584
Residents with income below the poverty level in 2022:
This zip code:
20.0%
Whole state:
14.3%
Residents with income below 50% of the poverty level in 2022:
This zip code:
8.1%
Whole state:
6.8%
Median number of rooms in houses and condos:
Here:
5.9
State:
6.3
Median number of rooms in apartments:
Here:
4.8
State:
3.8
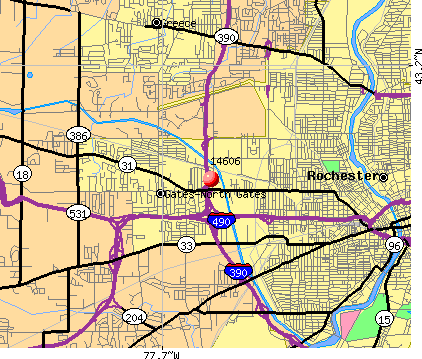
Notable locations in this zip code not listed on our city pages
Notable locations in zip code 14606: Elmgrove Farm (A), Elmgrove Industrial Park (B), Rochester Public Library Lyell Branch (C), Rochester Fire Department Engine 3 (D), Rochester Fire Department Engine 5 (E). Display/hide their locations on the map
Churches in zip code 14606 include: Saint Judes Church (A), Elmgrove United Church (B), Cameron Community Ministries (C), Christian Assembly (D), Gates Assembly of God (E), Gates Wesleyan Church (F), Gospel Light Bible Baptist Church (G), Outreach Temple Church of God (H), Trinity Alliance Church (I). Display/hide their locations on the map
2,050 married couples with children.
3,271 single-parent households (517 men, 2,754 women).
78.3% of residents of 14606 zip code speak English at home.
11.0% of residents speak Spanish at home (60% very well, 17% well, 17% not well, 6% not at all).
6.1% of residents speak other Indo-European language at home (56% very well, 27% well, 15% not well, 1% not at all).
3.4% of residents speak Asian or Pacific Island language at home (43% very well, 20% well, 32% not well, 5% not at all).
0.8% of residents speak other language at home (40% very well, 60% well).
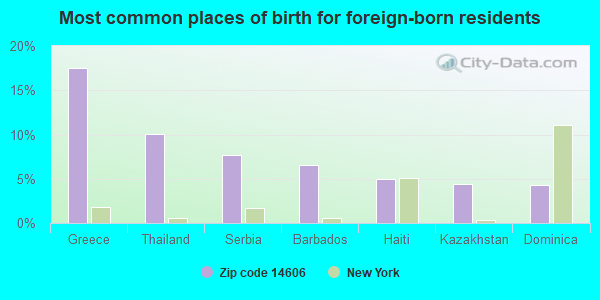
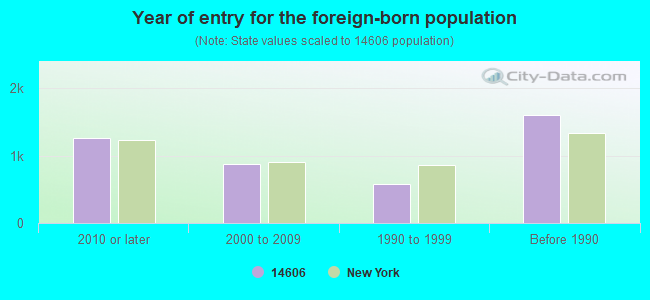
Foreign born population: 2,886 (10.6%) (73.4% of them are naturalized citizens)
AIR SYNTHETIC MINOR (AIRS/AFS) - ICIS-, ENFORCEMENT/COMPLIANCE ACTIVITY STATE MASTER (New York facility tracking) - National Pollutant Discharge Elimination System Permit, AIR PROGRAM, National Pollutant Discharge Elimination System Permit, HAZARDOUS WASTE PROGRAM CRITERIA AND HAZARDOUS AIR POLLUTANT INVENTORY (Inventory of air pollution sources) National Pollutant Discharge Elimination System NON-MAJOR (Tracking pollutant discharge elimination systems) - permit (Resource Conservation and Recovery Act (tracking hazardous waste)) TRI REPORTER (Tracking of toxic chemicals releasing facilities) Business SIC classification: PETROLEUM BULK STATIONS AND TERMINALS Organizations: HESS CORPORATION, AMERADA HESS CORP (CONTACT/OWNER)
Alternative names: AMERADA HESS CORP, AMERADA HESS CORP. ROCHESTER-LYELL AVENUE TERMINAL, AMERADA HESS LYELL AVE BULK STORAGE, HESS LIGHT TERMINAL
APPLIED FINISHING TECHNOLOGY (1680 LYELL AVENUE in ROCHESTER, NY)
AIR SYNTHETIC MINOR (AIRS/AFS) STATE MASTER (New York facility tracking) - AIR PROGRAM (Resource Conservation and Recovery Act (tracking hazardous waste)) Business SIC classification: COATING, ENGRAVING, AND ALLIED SERVICES Organizations: SPENCER GROUP OF MONROE INC (LEGALLY RESPONSIBLE PARTY)
, APPLIED FINISHING TECH INC (LEGALLY RESPONSIBLE PARTY)
, RAGU FOODS INC (LEGALLY RESPONSIBLE PARTY)
HARDWOOD HOUSE INC (569 LYELL AVENUE in ROCHESTER, NY)
STATE MASTER (New York facility tracking) - AIR PROGRAM, Large Quantity Generators, more that 1000 kg of hazardous waste/month (Resource Conservation and Recovery Act (tracking hazardous waste)) - notification TRI REPORTER (Tracking of toxic chemicals releasing facilities) Business SIC classification: WOOD OFFICE FURNITURE Organizations: HARDWOOD HOUSE LLC (CONTACT/OWNER)
, ALL STEEL INC (LEGALLY RESPONSIBLE PARTY)
Alternative names: HARDWOOD HOUSE DIVISION ALL STELL
ACRO INDUSTRIES (1255 EMERSON ST in ROCHESTER, NY)
STATE MASTER (New York facility tracking) - SECTION 404 PERMITTING, 401 CERTIFICATION (Resource Conservation and Recovery Act (tracking hazardous waste)) Organizations: ACRO INDUSTRIES INC, BEN MER TOOL & MACHINE INC (LEGALLY RESPONSIBLE PARTY)
Alternative names: BEN MER TOOL & MACHINE
HALL INDUSTRIES (155 MURRAY ST in ROCHESTER, NY)
STATE MASTER (New York facility tracking) - AIR PROGRAM, (Resource Conservation and Recovery Act (tracking hazardous waste)) Business SIC classification: PHOTOGRAPHIC EQUIPMENT AND SUPPLIES Organizations: HALL INDUSTRIES INC (LEGALLY RESPONSIBLE PARTY)
CRISTO COLLISION WEST (750 LEE RD in ROCHESTER, NY)
STATE MASTER (New York facility tracking) - AIR PROGRAM, HAZARDOUS WASTE PROGRAM Small Quantity Generators, between 100 kg and 1000 kg of hazardous waste/month (Resource Conservation and Recovery Act (tracking hazardous waste)) - notification Organizations: JAMES INZINGA (CONTACT/OWNER)
, JAMES C INZINGA ENT INC (LEGALLY RESPONSIBLE PARTY)
ACRO INDUSTRIES (554 COLFAX STREET in ROCHESTER, NY)
STATE MASTER (New York facility tracking) - AIR PROGRAM, HAZARDOUS WASTE PROGRAM Small Quantity Generators, between 100 kg and 1000 kg of hazardous waste/month (Resource Conservation and Recovery Act (tracking hazardous waste)) Organizations: ACRO INDUSTRIES INC (LEGALLY RESPONSIBLE PARTY)
ANTEX INC (350 WHITNEY ST 3RD FL in ROCHESTER, NY)
HAZARDOUS WASTE BIENNIAL REPORTER (Resource Conservation and Recovery Act (tracking hazardous waste)) (Resource Conservation and Recovery Act (tracking hazardous waste))
GUYBERN BUILDERS (155 POOL ST in ROCHESTER, NY)
(Resource Conservation and Recovery Act (tracking hazardous waste)) Organizations: BERNARD BIANCHI (CONTACT/OPERATOR)
ALLIANCE TOOL CORP-CONTRACT MACHINE DIV (1121 LEXINGTON AVE in ROCHESTER, NY)
HANSON MCKEE ROAD (LYELL STATION 5 MI N in ROCHESTER, NY)
(Resource Conservation and Recovery Act (tracking hazardous waste)) Organizations: HANSON AGGREGATES NY INC (CONTACT/OWNER)
AMERICAN OPTICAL CORP (1125 LEXINGTON AVE in ROCHESTER, NY)
(Resource Conservation and Recovery Act (tracking hazardous waste)) Organizations: WARNER LAMBERT CO (CONTACT/OWNER)
BEN-MER MFG (1001 LEE RD in ROCHESTER, NY)
CRITERIA AND HAZARDOUS AIR POLLUTANT INVENTORY (Inventory of air pollution sources) (Resource Conservation and Recovery Act (tracking hazardous waste)) Business SIC classification: PLASTICS MATERIALS, SYNTHETIC RESINS, AND NONVULCANIZABLE ELASTOMERS; PHARMACEUTICAL PREPARATIONS Business NAICS classification: PLASTICS MATERIAL AND RESIN MANUFACTURING.
Housing units lacking complete plumbing facilities: 0.8% Housing units lacking complete kitchen facilities: 0.9%
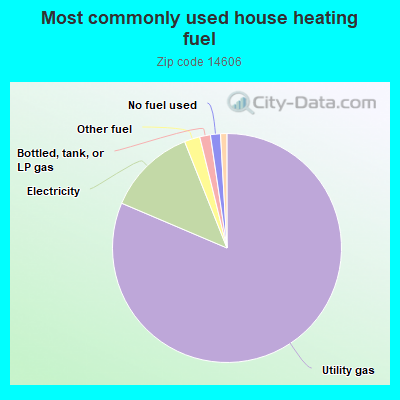
81.0%Utility gas
12.5%Electricity
2.2%Other fuel
1.5%Bottled, tank, or LP gas
1.4%No fuel used
0.9%Fuel oil, kerosene, etc.
Population in 1990: 29,822.
Place of birth for U.S.-born residents:
This state: 20,187
Northeast: 703
Midwest: 778
South: 876
West: 413
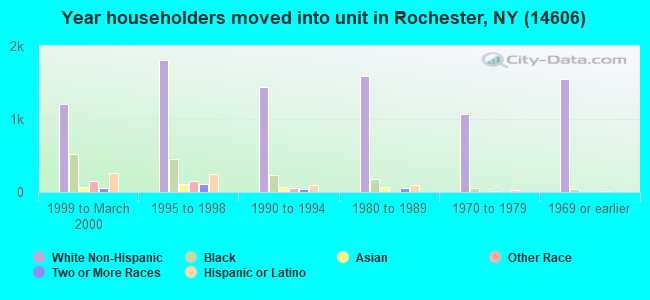
61% of the 14606 zip code residents lived in the same house 5 years ago. Out of people who lived in different houses, 85% lived in this county. Out of people who lived in different counties, 50% lived in New York.
92% of the 14606 zip code residents lived in the same house 1 year ago. Out of people who lived in different houses, 78% moved from this county. Out of people who lived in different houses, 9% moved from different county within same state. Out of people who lived in different houses, 8% moved from different state. Out of people who lived in different houses, 3% moved from abroad.
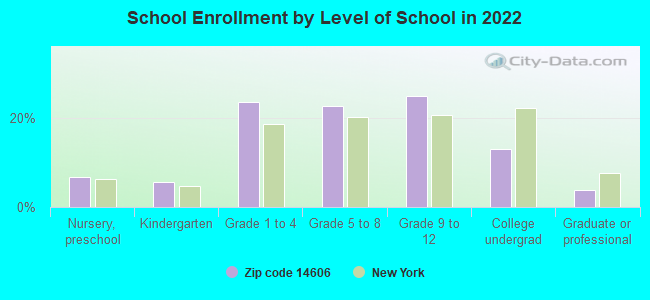
Private vs. public school enrollment:
Students in private schools in grades 1 to 8 (elementary and middle school): 164
Here:
5.7%
New York:
15.6%
Students in private schools in grades 9 to 12 (high school): 35
Here:
2.2%
New York:
15.0%
Students in private undergraduate colleges: 208
Here:
25.6%
New York:
39.2%
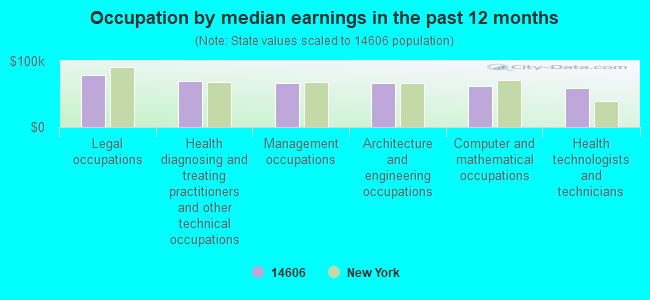
Occupation by median earnings in the past 12 months ($)
79,194Legal occupations
69,418Health diagnosing and treating practitioners and other technical occupations
66,995Management occupations
66,131Architecture and engineering occupations
62,532Computer and mathematical occupations
59,594Health technologists and technicians
Companies with federal contracts located in this zip code (ROCHESTER, NY):
BELL CONSTRUCTORS, INC. (1340 LEXINGTON AVE.) : $95,598,530 in 235 contractsfrom 1999 to 2006
Contracts for Construction of Structures and Facilities -- Maintenance Buildings, Construction of Structures and Facilities -- Penal Facilities, Construction of Structures and Facilities -- Other Conservation and Development Facilities, Construction of Structures and Facilities -- Canals, and moreby Army, Bureau of Prisoners/Federal Prison System, U.S. Army Corps of Engineers - civil program financing only, Navy, and others Signed by year:2000: $7,027,511; 2001: $11,291,807; 2002: $40,844,935; 2003: $19,039,067; 2004: $10,645,012; 2005: $6,919,729; 2006: $509,386.
Biggest contracts:
$27,653,000 with Army for Construction of Structures and Facilities -- Maintenance Buildings. Signed on 2002-09-25. Completion date: 2004-03-31.
$3,373,000 with Bureau of Prisoners/Federal Prison System for Construction of Structures and Facilities -- Penal Facilities. Taking place in PA. Signed on 2002-01-15. Completion date: 2003-04-15.
$3,291,000 with U.S. Army Corps of Engineers - civil program financing only for Construction of Structures and Facilities -- Other Conservation and Development Facilities. Taking place in FL. Signed on 2003-04-02. Completion date: 2003-01-11.
$2,750,000 with U.S. Army Corps of Engineers - civil program financing only for Construction of Structures and Facilities -- Canals. Taking place in FL. Signed on 2000-05-04. Completion date: 2002-06-19.
CANNON INDUSTRIES INC (525 LEE ROAD; small business) 50 employees, $0 revenue. Hist. Underutilized Business Zone (HUBZone) Firm, Small Disadvantaged Business: $349,375 in 14 contractsfrom 2002 to 2006
Contracts for Antennas, Waveguides, and Related Equipment, Vehicular Cab, Body, and Frame Structural Components, Miscellaneous Electrical and Electronic Components by Defense Logistics Agency, Bureau of Prisoners/Federal Prison System Signed by year:2000: $0; 2001: $0; 2002: $1,000; 2003: $103,819; 2004: $89,471; 2005: $121,417; 2006: $33,668.
Biggest contracts:
$86,989 with Defense Logistics Agency for Antennas, Waveguides, and Related Equipment. Signed on 2005-02-03. Completion date: 2007-01-27.
$70,295, same as above.Signed on 2003-10-31. Completion date: 2003-12-12.
$51,833, same as above.Signed on 2004-10-19. Completion date: 2005-11-03.
$37,638, same as above.Signed on 2004-09-27. Completion date: 2004-11-08.
ABRASIVE-TOOLCORP (1555 EMERSON ST; small business) : $239,199 in 37 contractsfrom 2003 to 2006
Contracts for Batteries, Rechargeable, Machine Tool Accessories, Cutting Tools for Machine Tools, Hardware, Commercial, and moreby Army, Defense Logistics Agency, Air Force Signed by year:2000: $0; 2001: $0; 2002: $0; 2003: $7,951; 2004: $61,064; 2005: $119,729; 2006: $50,455.
Biggest contracts:
$30,954 with Army for Batteries, Rechargeable. Signed on 2005-02-16. Completion date: 2005-03-31.
$23,251 with Army for Machine Tool Accessories. Signed on 2004-05-25. Completion date: 2004-09-01.
$13,480 with Army for Cutting Tools for Machine Tools. Signed on 2004-10-22. Completion date: 2005-03-28.
$12,714, same as above.Signed on 2005-03-08. Completion date: 2005-04-26.
HOFFEND XPOSITION INC (100 BICKFORD ST; small business) : $189,938 in 4 contractsfrom 2000 to 2004
$72,169 with Army for Miscellaneous Furniture and Fixtures. Taking place in MI. Signed on 2000-02-15. Completion date: 2000-03-09.
$64,491 with Army for Miscellaneous Items. Signed on 2001-02-13. Completion date: 2001-03-08.
$58,909 with Army for Installation of Equipment -- Miscellaneous. Taking place in MI. Signed on 2001-12-20. Completion date: 2002-01-24.
-$5,631 with Army for Miscellaneous Furniture and Fixtures. Taking place in MI. Signed on 2004-11-02. Completion date: 2000-03-09.
PICS TELECOM CORP (1920 LYELL AVENUE; small business) : $81,524 in 4 contractsfrom 2004 to 2005
$29,514 with Army for ADPE System Configuration. Taking place in AZ. Signed on 2005-09-09. Completion date: 2005-09-24.
$29,100 with Army for ADP Support Equipment. Taking place in NV. Signed on 2005-07-26. Completion date: 2005-08-09.
$15,350 with Army for ADPE System Configuration. Taking place in NV. Signed on 2005-08-16. Completion date: 2005-09-03.
$7,560 with Air Force for Miscellaneous Electrical and Electronic Components. Taking place in NE. Signed on 2004-08-03. Completion date: 2004-08-27.
TOUCHSTONE TECHNOLOGY INC (1128 LEXINGTON AVE; small business) : $24,366 in 2 contractsfrom 2004 to 2005
$17,490 with Navy for ADP Input/Output and Storage Devices. Signed on 2005-04-11. Completion date: 2005-04-30.
$6,876, same as above.Signed on 2004-09-25. Completion date: 2004-12-02.
KLEIN STEEL SERVICE, INC (105 VANGUARD PARKWAY) : $15,054 in 3 contractsfrom 2004 to 2005
$7,137 with Army for Pipe, Tube and Rigid Tubing. Signed on 2004-07-23. Completion date: 2004-07-28.
$4,455 with Navy for Miscellaneous Items. Signed on 2005-03-23. Completion date: 2005-04-01.
$3,462 with Maritime Administration for Iron and Steel Primary and Semifinished Products. Signed on 2004-04-07. Completion date: 2004-04-21.
JASCO TOOLS, INC (1390 MOUNT READ BLVD; small business)
$14,991 with Defense Logistics Agency for Nuts and Washers. Signed on 2005-10-04. Completion date: 2005-11-18.
MAGNA PRODUCTS CORP (777 MOUNT READ BLVD; small business) : $14,077 in 2 contractsfrom 2003 to 2006
$10,994 with Army for Motors, Electrical. Signed on 2003-04-02. Completion date: 2003-07-01.
$3,083 with Army for Maintenance, Repair and Rebuilding of Equipment -- Materials Handling Equipment. Signed on 2006-01-18. Completion date: 2006-01-14.
GATTI PLUMBING, INC. (441A ELMGROVE ROAD; small business)
$6,250 with Navy for Maintenance, Repair or Alteration of Real Property -- Other Administrative Facilities and Service Buildings. Signed on 2000-05-11. Completion date: 2000-06-20.
Top industries in this zip code by the number of employees in 2005:
Administrative and Support and Waste Management and Remediation Services: Temporary Help Services (250-499 employees: 1 establishment, 100-249 employees: 2 establishments, 1-4 employees: 1 establishment)
Construction: Commercial and Institutional Building Construction (100-249: 2, 20-49: 1, 5-9: 1, 1-4: 3)
2002 - 2018 National Fire Incident Reporting System (NFIRS) incidents
Based on the data from the years 2002 - 2018 the average number of fires per year is 111. The highest number of fires - 205 took place in 2007, and the least - 32 in 2004. The data has a rising trend.
When looking into fire subcategories, the most incidents belonged to: Structure Fires (48.4%), and Outside Fires (34.6%).
Fire incident types reported to NFIRS in Zip Code 14606


 Nearest zip codes: 14626, 14615, 14624, 14611, 14613, 14619.


 Based on the data from the years 2002 - 2018 the average number of fires per year is 111. The highest number of fires - 205 took place in 2007, and the least - 32 in 2004. The data has a rising trend.
 When looking into fire subcategories, the most incidents belonged to: Structure Fires (48.4%), and Outside Fires (34.6%).