Crime rate in Tacoma, Washington (WA): murders, rapes, robberies, assaults, burglaries, thefts, auto thefts, arson, law enforcement employees, police officers, crime map
Crime rate in Tacoma, WA
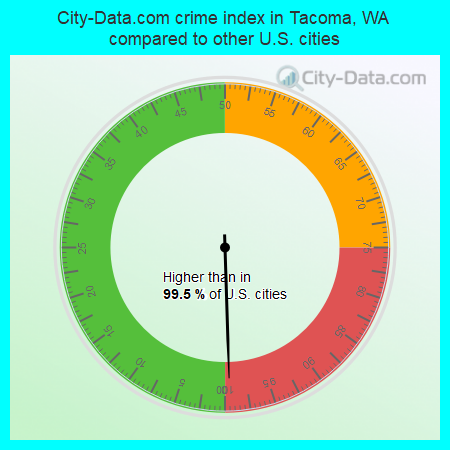
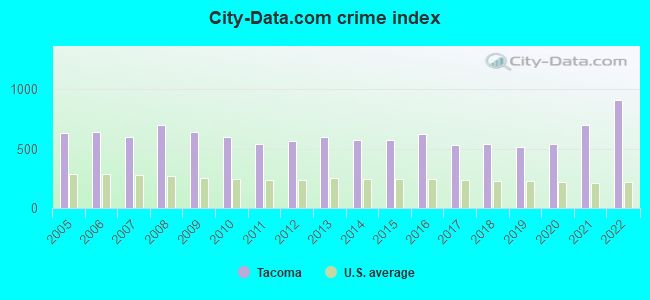
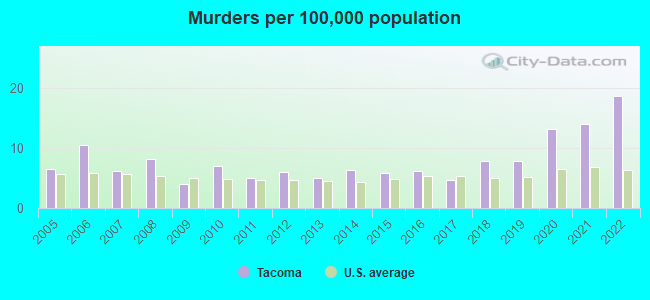
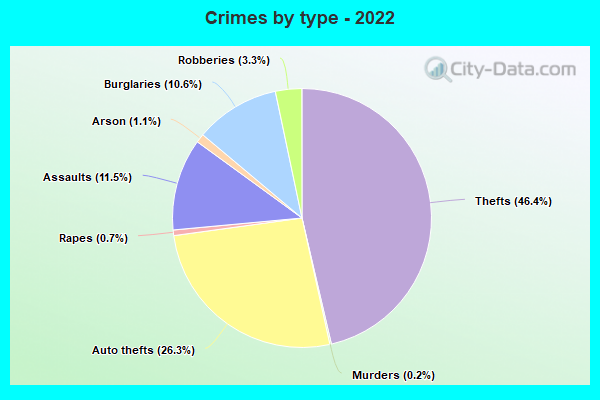
The 2022 crime rate in Tacoma, WA is 912 (City-Data.com crime index), which is 3.7 times greater than the U.S. average. It was higher than in 99.5% U.S. cities. The 2022 Tacoma crime rate rose by 31% compared to 2021. The number of homicides stood at 41 - an increase of 10 compared to 2021. In the last 5 years Tacoma has seen increasing violent crime and rise of property crime.See how dangerous Tacoma, WA is compared to the nearest cities:
(Note: Higher means more crime)
(Note: Higher means more crime)
| Tacoma: | 912.0 |
| Fircrest: | 170.1 |
| University Place: | 234.8 |
| Ruston: | 428.3 |
| Fife: | 1,149.2 |
| Lakewood: | 526.3 |
| Milton: | 330.7 |
| Federal Way: | 468.3 |
| Steilacoom: | 121.5 |
The City-Data.com crime index weighs serious crimes and violent crimes more heavily. Higher means more crime, U.S. average is 246.1. It adjusts for the number of visitors and daily workers commuting into cities.
- means the value is smaller than the state average.- means the value is about the same as the state average.
- means the value is bigger than the state average.
- means the value is much bigger than the state average.
According to our research of Washington and other state lists, there were 285 registered sex offenders living in Tacoma, Washington as of May 05, 2024.
The ratio of all residents to sex offenders in Tacoma is 741 to 1.
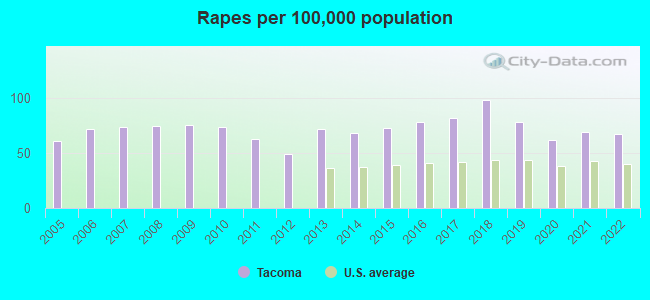
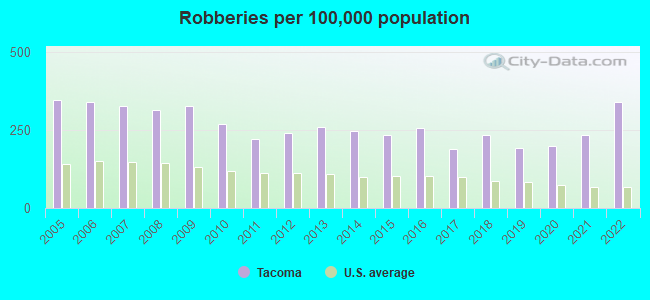
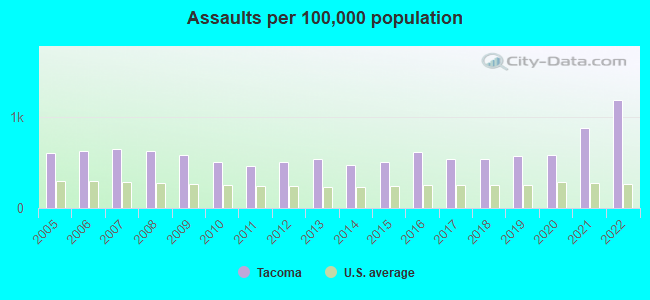
Violent crime rate in 2022
| Tacoma: | 866.6 |
| U.S. Average: | 219.8 |
Violent crime rate in 2021
| Tacoma: | 649.5 |
| U.S. Average: | 224.8 |
Violent crime rate in 2020
| Tacoma: | 476.3 |
| U.S. Average: | 228.2 |
Violent crime rate in 2019
| Tacoma: | 476.8 |
| U.S. Average: | 219.9 |
Violent crime rate in 2018
| Tacoma: | 499.3 |
| U.S. Average: | 221.2 |
Violent crime rate in 2017
| Tacoma: | 454.1 |
| U.S. Average: | 226.2 |
Violent crime rate in 2016
| Tacoma: | 525.2 |
| U.S. Average: | 227.3 |
Violent crime rate in 2015
| Tacoma: | 455.6 |
| U.S. Average: | 219.3 |
Violent crime rate in 2014
| Tacoma: | 442.8 |
| U.S. Average: | 211.1 |
Violent crime rate in 2013
| Tacoma: | 478.0 |
| U.S. Average: | 214.2 |
Violent crime rate in 2012
| Tacoma: | 435.7 |
| U.S. Average: | 187.4 |
Violent crime rate in 2011
| Tacoma: | 413.9 |
| U.S. Average: | 187.1 |
Violent crime rate in 2010
| Tacoma: | 476.6 |
| U.S. Average: | 195.7 |
Violent crime rate in 2009
| Tacoma: | 536.8 |
| U.S. Average: | 208.9 |
Violent crime rate in 2008
| Tacoma: | 559.3 |
| U.S. Average: | 222.5 |
Violent crime rate in 2007
| Tacoma: | 482.5 |
| U.S. Average: | 229.1 |
Violent crime rate in 2006
| Tacoma: | 484.3 |
| U.S. Average: | 232.6 |
Violent crime rate in 2005
| Tacoma: | 462.5 |
| U.S. Average: | 227.0 |
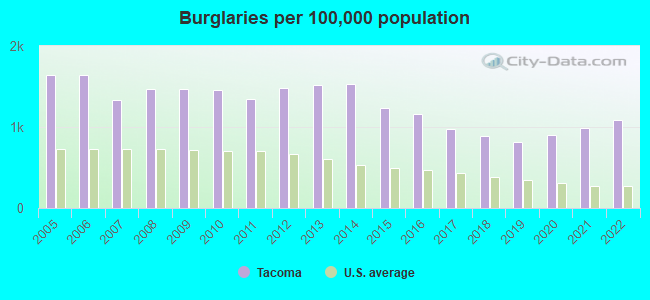
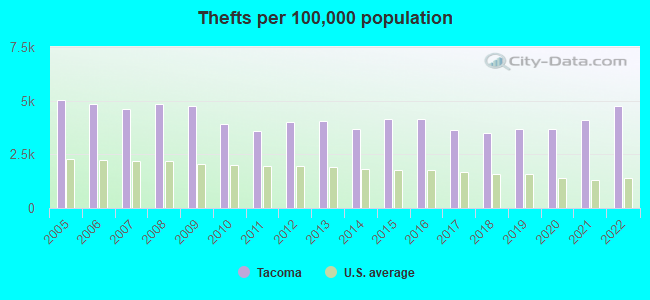
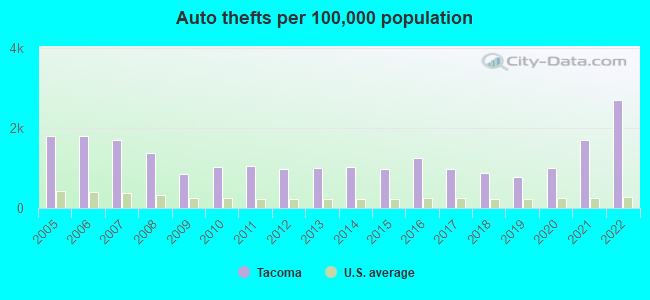
Property crime rate in 2022
| Tacoma: | 859.5 |
| U.S. Average: | 166.5 |
Property crime rate in 2021
| Tacoma: | 658.2 |
| U.S. Average: | 157.8 |
Property crime rate in 2020
| Tacoma: | 515.2 |
| U.S. Average: | 169.6 |
Property crime rate in 2019
| Tacoma: | 463.8 |
| U.S. Average: | 179.7 |
Property crime rate in 2018
| Tacoma: | 483.3 |
| U.S. Average: | 190.2 |
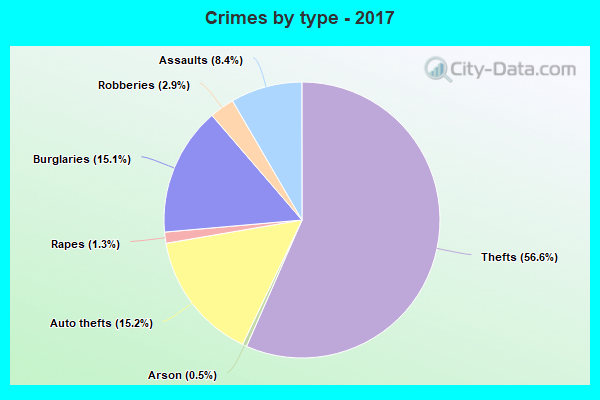
Property crime rate in 2017
| Tacoma: | 523.0 |
| U.S. Average: | 206.4 |
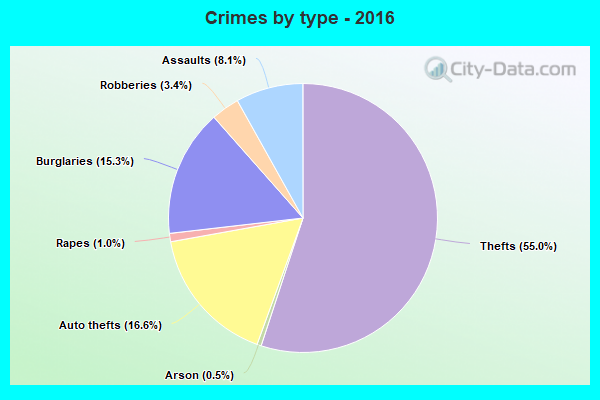
Property crime rate in 2016
| Tacoma: | 626.7 |
| U.S. Average: | 216.6 |
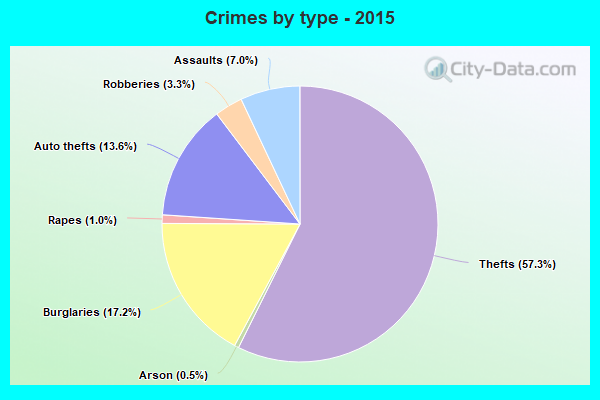
Property crime rate in 2015
| Tacoma: | 601.2 |
| U.S. Average: | 221.5 |
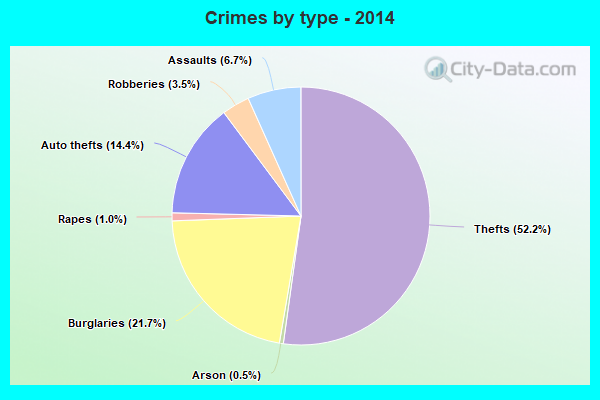
Property crime rate in 2014
| Tacoma: | 643.3 |
| U.S. Average: | 230.8 |
Property crime rate in 2013
| Tacoma: | 657.0 |
| U.S. Average: | 250.4 |
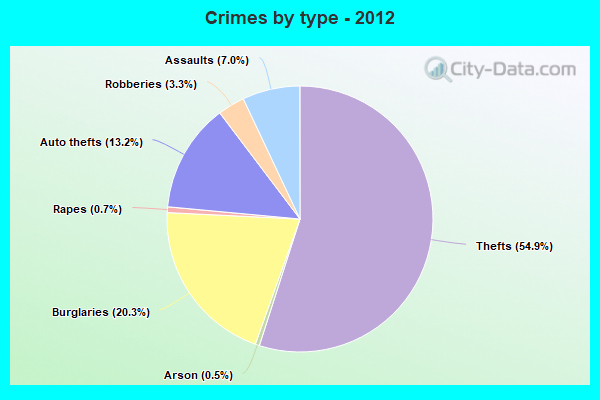
Property crime rate in 2012
| Tacoma: | 641.2 |
| U.S. Average: | 267.3 |
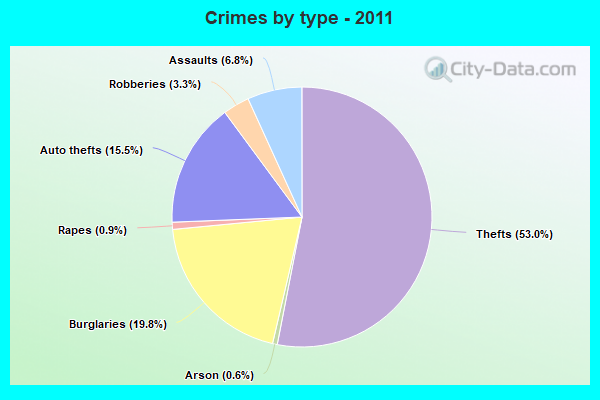
Property crime rate in 2011
| Tacoma: | 608.6 |
| U.S. Average: | 273.5 |
Property crime rate in 2010
| Tacoma: | 642.3 |
| U.S. Average: | 276.4 |
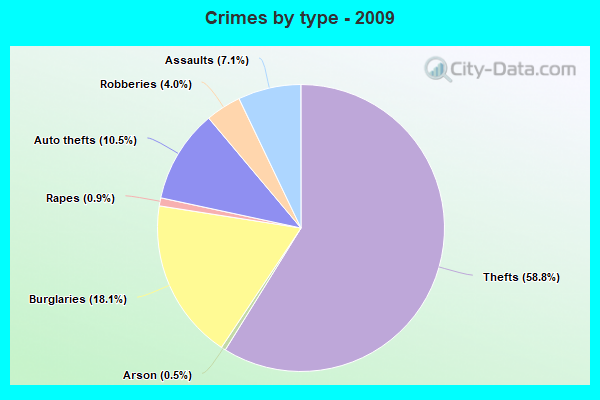
Property crime rate in 2009
| Tacoma: | 659.8 |
| U.S. Average: | 285.6 |
Property crime rate in 2008
| Tacoma: | 742.4 |
| U.S. Average: | 302.2 |
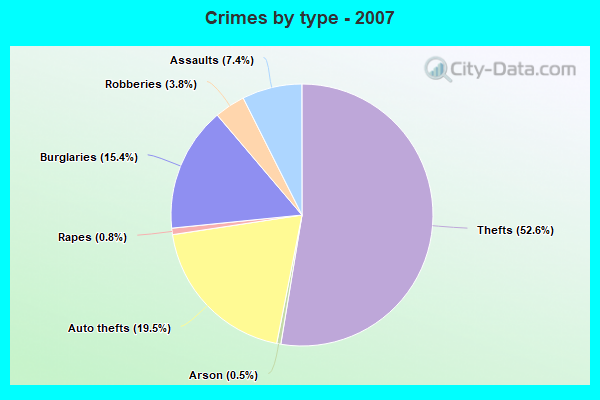
Property crime rate in 2007
| Tacoma: | 635.9 |
| U.S. Average: | 309.2 |
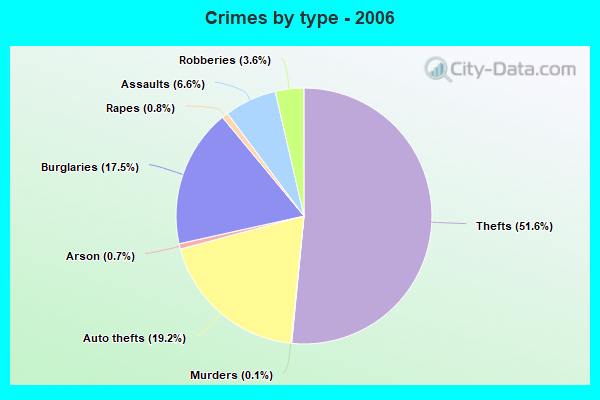
Property crime rate in 2006
| Tacoma: | 712.7 |
| U.S. Average: | 317.3 |
Property crime rate in 2005
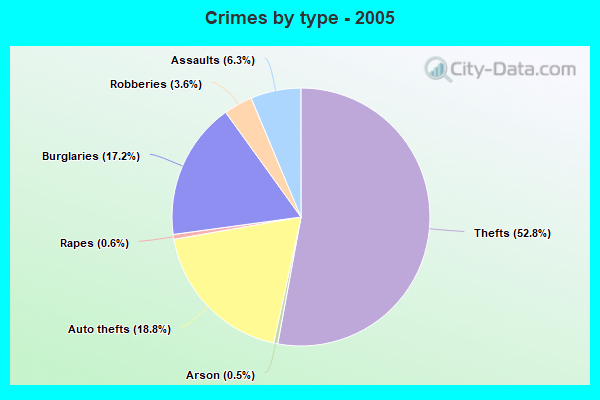
| Tacoma: | 717.0 |
| U.S. Average: | 322.3 |
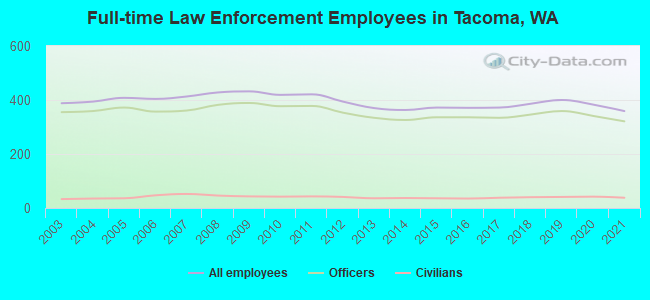
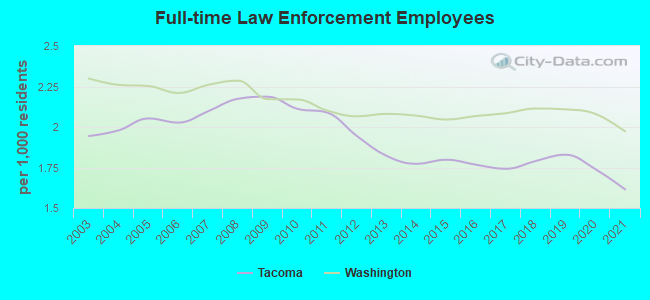
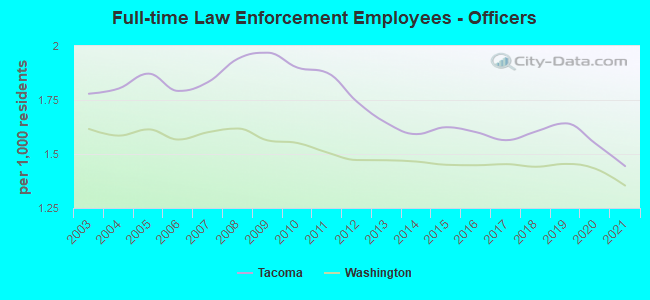
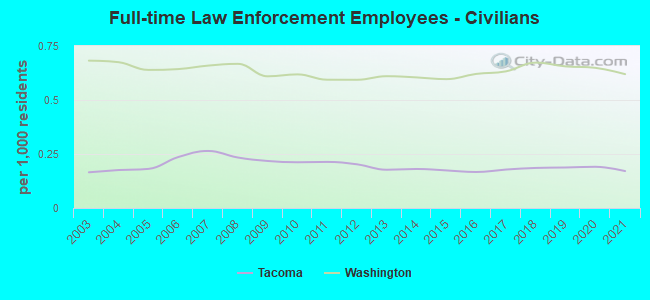
Full-time law enforcement employees in 2021, including police officers: 359 (321 officers - 273 male; 48 female).
| Officers per 1,000 residents here: | 1.44 |
| Washington average: | 1.35 |
Full-time law enforcement employees in 2020, including police officers: 383 (341 officers - 291 male; 50 female).
| Officers per 1,000 residents here: | 1.55 |
| Washington average: | 1.43 |
Full-time law enforcement employees in 2019, including police officers: 400 (359 officers - 308 male; 51 female).
| Officers per 1,000 residents here: | 1.64 |
| Washington average: | 1.45 |
Full-time law enforcement employees in 2018, including police officers: 386 (346 officers - 296 male; 50 female).
| Officers per 1,000 residents here: | 1.60 |
| Washington average: | 1.44 |
Full-time law enforcement employees in 2017, including police officers: 372 (334 officers - 282 male; 52 female).
| Officers per 1,000 residents here: | 1.56 |
| Washington average: | 1.45 |
Full-time law enforcement employees in 2016, including police officers: 371 (336 officers - 280 male; 56 female).
| Officers per 1,000 residents here: | 1.60 |
| Washington average: | 1.45 |
Full-time law enforcement employees in 2015, including police officers: 372 (336 officers - 283 male; 53 female).
| Officers per 1,000 residents here: | 1.62 |
| Washington average: | 1.45 |
Full-time law enforcement employees in 2014, including police officers: 363 (326 officers - 275 male; 51 female).
| Officers per 1,000 residents here: | 1.59 |
| Washington average: | 1.47 |
Full-time law enforcement employees in 2013, including police officers: 370 (334 officers - 285 male; 49 female).
| Officers per 1,000 residents here: | 1.64 |
| Washington average: | 1.47 |
Full-time law enforcement employees in 2012, including police officers: 394 (353 officers - 304 male; 49 female).
| Officers per 1,000 residents here: | 1.74 |
| Washington average: | 1.47 |
Full-time law enforcement employees in 2011, including police officers: 421 (378 officers - 318 male; 60 female).
| Officers per 1,000 residents here: | 1.88 |
| Washington average: | 1.51 |
Full-time law enforcement employees in 2010, including police officers: 419 (377 officers - 326 male; 51 female).
| Officers per 1,000 residents here: | 1.90 |
| Washington average: | 1.55 |
Full-time law enforcement employees in 2009, including police officers: 432 (389 officers - 336 male; 53 female).
| Officers per 1,000 residents here: | 1.97 |
| Washington average: | 1.56 |
Full-time law enforcement employees in 2008, including police officers: 428 (382 officers - 327 male; 55 female).
| Officers per 1,000 residents here: | 1.94 |
| Washington average: | 1.62 |
Full-time law enforcement employees in 2007, including police officers: 413 (361 officers - 316 male; 45 female).
| Officers per 1,000 residents here: | 1.83 |
| Washington average: | 1.60 |
Full-time law enforcement employees in 2006, including police officers: 404 (357 officers - 308 male; 49 female).
| Officers per 1,000 residents here: | 1.79 |
| Washington average: | 1.57 |
Full-time law enforcement employees in 2005, including police officers: 408 (372 officers - 321 male; 51 female).
| Officers per 1,000 residents here: | 1.87 |
| Washington average: | 1.61 |
Full-time law enforcement employees in 2004, including police officers: 394 (359 officers - 308 male; 51 female).
| Officers per 1,000 residents here: | 1.80 |
| Washington average: | 1.59 |
Full-time law enforcement employees in 2003, including police officers: 388 (355 officers - 310 male; 45 female).
| Officers per 1,000 residents here: | 1.78 |
| Washington average: | 1.62 |


Zip codes: 98402, 98403, 98405, 98406, 98408, 98409, 98416, 98418, 98465.