Estimated zip code population in 2022: 21,709 Zip code population in 2010: 18,830 Zip code population in 2000: 29,095
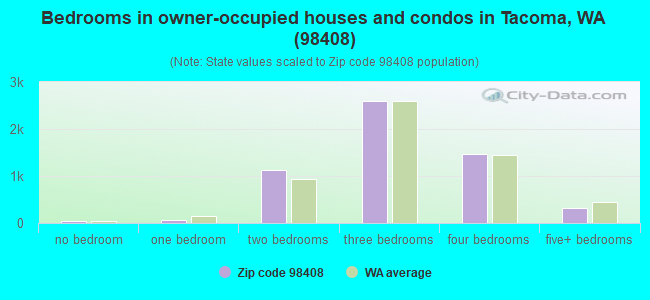
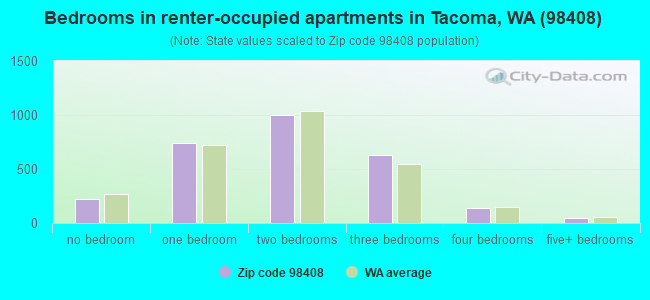
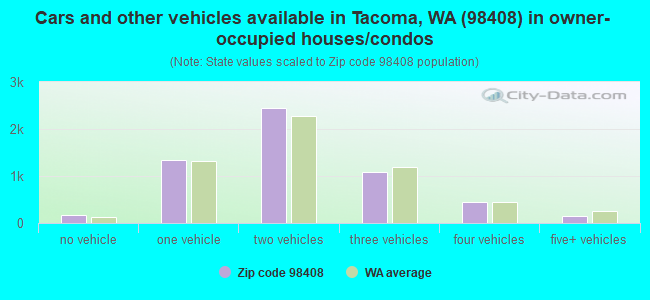
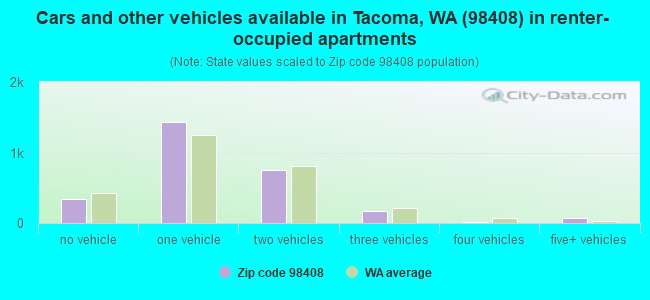
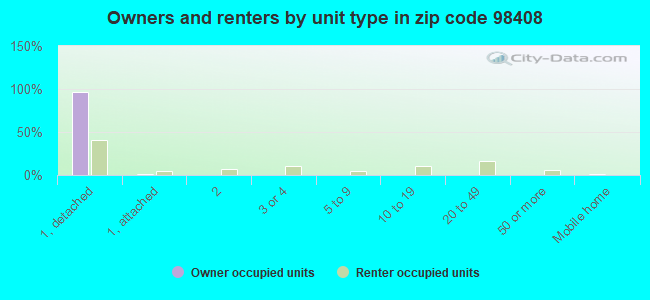
Houses and condos: 8,712 Renter-occupied apartments: 2,779
% of renters here:
33%
State:
36%
March 2022 cost of living index in zip code 98408: 108.8 (more than average, U.S. average is 100)
Land area: 3.4 sq. mi. Water area: 0.0 sq. mi.
Population density: 6,420 people per square mile
(high).
OSM Map
General Map
Google Map
MSN Map
OSM Map
General Map
Google Map
MSN Map
OSM Map
General Map
Google Map
MSN Map
OSM Map
General Map
Google Map
MSN Map
Please wait while loading the map...
Real estate property taxes paid for housing units in 2022:
This zip code:
0.8% ($3,296)
Washington:
0.8% ($4,283)
Median real estate property taxes paid for housing units with mortgages in 2022: $3,088 (0.7%) Median real estate property taxes paid for housing units with no mortgage in 2022: $3,640 (1.0%)
Averages for the 2020 tax year for zip code 98408, filed in 2021:
Average Adjusted Gross Income (AGI) in 2020: $52,922 (Individual Income Tax Returns)
Here:
$52,922
State:
$99,264
Salary/wage: $48,963 (reported on 85.5% of returns)
Here:
$48,963
State:
$80,347
(% of AGI for various income ranges: 1101.2% for AGIs below $25k, 3498.4% for AGIs $25k-50k, 6468.2% for AGIs $50k-75k, 9563.3% for AGIs $75k-100k, 15746.6% for AGIs $100k-200k)
Taxable interest for individuals: $625 (reported on 18.7% of returns)
This zip code:
$625
Washington:
$2,077
(% of AGI for various income ranges: 7.8% for AGIs below $25k, 8.2% for AGIs $25k-50k, 14.0% for AGIs $50k-75k, 23.1% for AGIs $75k-100k, 45.9% for AGIs $100k-200k)
Ordinary dividends: $2,009 (reported on 10.3% of returns)
Here:
$2,009
State:
$10,013
(% of AGI for various income ranges: 14.0% for AGIs below $25k, 11.3% for AGIs $25k-50k, 20.7% for AGIs $50k-75k, 46.9% for AGIs $75k-100k, 92.0% for AGIs $100k-200k)
Net capital gain/loss in AGI: +$7,719 (reported on 9.2% of returns)
Here:
+$7,719
State:
+$40,092
(% of AGI for various income ranges: 0.5% for AGIs below $25k, 13.2% for AGIs $25k-50k, 23.0% for AGIs $50k-75k, 66.8% for AGIs $75k-100k, 304.9% for AGIs $100k-200k)
Profit/loss from business: +$8,385 (reported on 10.2% of returns)
Here:
+$8,385
State:
+$18,312
(% of AGI for various income ranges: 74.3% for AGIs below $25k, 90.1% for AGIs $25k-50k, 109.3% for AGIs $50k-75k, 122.8% for AGIs $75k-100k, 280.4% for AGIs $100k-200k)
Taxable individual retirement arrangement distribution: $13,964 (reported on 4.3% of returns)
98408:
$13,964
Washington:
$24,221
(% of AGI for various income ranges: 29.8% for AGIs below $25k, 33.9% for AGIs $25k-50k, 57.2% for AGIs $50k-75k, 101.1% for AGIs $75k-100k, 388.1% for AGIs $100k-200k)
Total itemized deductions: $25,194 (reported on 6.9% of returns)
Here:
$25,194
State:
$39,068
(% of AGI for various income ranges: 40.0% for AGIs below $25k, 103.0% for AGIs $25k-50k, 267.8% for AGIs $50k-75k, 450.1% for AGIs $75k-100k, 635.7% for AGIs $100k-200k)
Charity contributions: $5,729 (reported on 4.1% of returns)
Here:
$5,729
State:
$15,331
(% of AGI for various income ranges: 12.9% for AGIs $25k-50k, 25.3% for AGIs $50k-75k, 40.7% for AGIs $75k-100k, 136.2% for AGIs $100k-200k)
Taxes paid: $5,651 (reported on 6.9% of returns)
98408:
$5,651
State:
$7,774
(% of AGI for various income ranges: 7.0% for AGIs below $25k, 22.9% for AGIs $25k-50k, 68.4% for AGIs $50k-75k, 111.3% for AGIs $75k-100k, 133.0% for AGIs $100k-200k)
Earned income credit: $1,918 (reported on 14.7% of returns)
Here:
$1,918
State:
$2,020
(% of AGI for various income ranges: 69.9% for AGIs below $25k, 55.8% for AGIs $25k-50k, 0.8% for AGIs $50k-75k)
Percentage of individuals using paid preparers for their 2020 taxes: 93.7%
Here:
94%
State:
93%
(% for various income ranges: 91.6% for AGIs below $25k, 94.3% for AGIs $25k-50k, 95.2% for AGIs $50k-75k, 93.9% for AGIs $75k-100k, 94.6% for AGIs $100k-200k, 87.5% for AGIs over 200k)
Averages for the 2012 tax year for zip code 98408, filed in 2013:
Average Adjusted Gross Income (AGI) in 2012: $40,309 (Individual Income Tax Returns)
Here:
$40,309
State:
$69,533
Salary/wage: $37,803 (reported on 84.4% of returns)
Here:
$37,803
State:
$57,267
(% of AGI for various income ranges: 74.3% for AGIs below $25k, 81.7% for AGIs $25k-50k, 82.2% for AGIs $50k-75k, 82.8% for AGIs $75k-100k, 81.1% for AGIs $100k-200k)
Taxable interest for individuals: $697 (reported on 23.6% of returns)
This zip code:
$697
Washington:
$1,816
(% of AGI for various income ranges: 1.1% for AGIs below $25k, 0.4% for AGIs $25k-50k, 0.2% for AGIs $50k-75k, 0.3% for AGIs $75k-100k, 0.4% for AGIs $100k-200k)
Ordinary dividends: $2,858 (reported on 10.6% of returns)
Here:
$2,858
State:
$8,163
(% of AGI for various income ranges: 1.4% for AGIs below $25k, 0.3% for AGIs $25k-50k, 0.5% for AGIs $50k-75k, 0.3% for AGIs $75k-100k, 2.0% for AGIs $100k-200k)
Net capital gain/loss in AGI: +$1,071 (reported on 7.3% of returns)
Here:
+$1,071
State:
+$21,568
(% of AGI for various income ranges: 0.3% for AGIs $50k-75k, 0.3% for AGIs $75k-100k, 0.7% for AGIs $100k-200k)
Profit/loss from business: +$7,880 (reported on 9.4% of returns)
Here:
+$7,880
State:
+$16,521
(% of AGI for various income ranges: 5.2% for AGIs below $25k, 1.8% for AGIs $25k-50k, 1.3% for AGIs $50k-75k, 1.1% for AGIs $75k-100k, 1.2% for AGIs $100k-200k)
Taxable individual retirement arrangement distribution: $9,384 (reported on 6.3% of returns)
98408:
$9,384
Washington:
$18,648
(% of AGI for various income ranges: 1.7% for AGIs below $25k, 1.1% for AGIs $25k-50k, 1.5% for AGIs $50k-75k, 1.7% for AGIs $75k-100k, 1.9% for AGIs $100k-200k)
Total itemized deductions: $16,580 (26% of AGI, reported on 27.2% of returns)
Here:
$16,580
State:
$23,872
Here:
25.7% of AGI
State:
18.2% of AGI
(% of AGI for various income ranges: 7.8% for AGIs below $25k, 10.3% for AGIs $25k-50k, 13.1% for AGIs $50k-75k, 12.5% for AGIs $75k-100k, 12.5% for AGIs $100k-200k)
Charity contributions: $2,495 (reported on 19.6% of returns)
Here:
$2,495
State:
$4,465
(% of AGI for various income ranges: 0.6% for AGIs below $25k, 1.0% for AGIs $25k-50k, 1.3% for AGIs $50k-75k, 1.6% for AGIs $75k-100k, 1.7% for AGIs $100k-200k)
Taxes paid: $4,128 (reported on 26.7% of returns)
98408:
$4,128
State:
$6,400
(% of AGI for various income ranges: 1.6% for AGIs below $25k, 2.5% for AGIs $25k-50k, 3.3% for AGIs $50k-75k, 3.1% for AGIs $75k-100k, 2.9% for AGIs $100k-200k, 2.1% for AGIs over 200k)
Earned income credit: $2,122 (reported on 21.8% of returns)
Here:
$2,122
State:
$2,073
(% of AGI for various income ranges: 6.7% for AGIs below $25k, 1.0% for AGIs $25k-50k)
Percentage of individuals using paid preparers for their 2012 taxes: 43.0%
Here:
43%
State:
43%
(% for various income ranges: 40.8% for AGIs below $25k, 42.9% for AGIs $25k-50k, 44.1% for AGIs $50k-75k, 46.3% for AGIs $75k-100k, 53.5% for AGIs $100k-200k)
Averages for the 2004 tax year for zip code 98408, filed in 2005:
Average Adjusted Gross Income (AGI) in 2004: $35,072 (Individual Income Tax Returns)
Here:
$35,072
State:
$54,331
Salary/wage: $33,825 (reported on 84.8% of returns)
Here:
$33,825
State:
$45,761
(% of AGI for various income ranges: 80.0% for AGIs below $10k, 77.0% for AGIs $10k-25k, 85.3% for AGIs $25k-50k, 83.5% for AGIs $50k-75k, 84.5% for AGIs $75k-100k, 66.9% for AGIs over 100k)
Taxable interest for individuals: $1,151 (reported on 32.2% of returns)
This zip code:
$1,151
Washington:
$2,110
(% of AGI for various income ranges: 4.1% for AGIs below $10k, 1.3% for AGIs $10k-25k, 1.0% for AGIs $25k-50k, 0.6% for AGIs $50k-75k, 1.0% for AGIs $75k-100k, 1.7% for AGIs over 100k)
Taxable dividends: $1,769 (reported on 13.6% of returns)
Here:
$1,769
State:
$5,879
(% of AGI for various income ranges: 2.2% for AGIs below $10k, 0.7% for AGIs $10k-25k, 0.4% for AGIs $25k-50k, 0.5% for AGIs $50k-75k, 0.5% for AGIs $75k-100k, 2.2% for AGIs over 100k)
Net capital gain/loss: +$4,586 (reported on 10.3% of returns)
Here:
+$4,586
State:
+$15,835
(% of AGI for various income ranges: -1.6% for AGIs below $10k, 0.2% for AGIs $10k-25k, 0.3% for AGIs $25k-50k, 0.7% for AGIs $50k-75k, 1.8% for AGIs $75k-100k, 9.0% for AGIs over 100k)
Profit/loss from business: +$6,627 (reported on 9.5% of returns)
Here:
+$6,627
State:
+$13,994
(% of AGI for various income ranges: 6.5% for AGIs below $10k, 2.8% for AGIs $10k-25k, 1.5% for AGIs $25k-50k, 1.4% for AGIs $50k-75k, 0.4% for AGIs $75k-100k, 4.1% for AGIs over 100k)
IRA payment deduction: $2,387 (reported on 1.6% of returns)
98408:
$2,387
Washington:
$3,001
(% of AGI for various income ranges: 0.1% for AGIs $10k-25k, 0.2% for AGIs $25k-50k, 0.1% for AGIs $50k-75k, 0.2% for AGIs $75k-100k)
Total itemized deductions: $14,254 (27% of AGI, reported on 32.2% of returns)
Here:
$14,254
State:
$19,669
Here:
26.9% of AGI
State:
20.7% of AGI
(% of AGI for various income ranges: 14.1% for AGIs below $10k, 9.7% for AGIs $10k-25k, 13.2% for AGIs $25k-50k, 14.4% for AGIs $50k-75k, 13.9% for AGIs $75k-100k, 11.9% for AGIs over 100k)
Charity contributions deductions: $2,096 (4% of AGI, reported on 25.4% of returns)
Here:
$2,096
State:
$3,569
Here:
3.8% of AGI
State:
3.5% of AGI
(% of AGI for various income ranges: 0.5% for AGIs below $10k, 1.0% for AGIs $10k-25k, 1.2% for AGIs $25k-50k, 1.9% for AGIs $50k-75k, 2.0% for AGIs $75k-100k, 1.9% for AGIs over 100k)
Total tax: $3,829 (reported on 74.4% of returns)
98408:
$3,829
State:
$9,065
(% of AGI for various income ranges: 2.4% for AGIs below $10k, 3.9% for AGIs $10k-25k, 6.6% for AGIs $25k-50k, 8.8% for AGIs $50k-75k, 10.4% for AGIs $75k-100k, 15.6% for AGIs over 100k)
Earned income credit: $1,643 (reported on 17.2% of returns)
Here:
$1,643
State:
$1,607
Percentage of individuals using paid preparers for their 2004 taxes: 51.8%
Here:
52%
State:
49%
(% for various income ranges: 52.6% for AGIs below $10k, 52.5% for AGIs $10k-25k, 50.7% for AGIs $25k-50k, 50.9% for AGIs $50k-75k, 53.1% for AGIs $75k-100k, 57.9% for AGIs over 100k)
Likely homosexual households (counted as self-reported same-sex unmarried-partner households)
Lesbian couples: 0.0% of all households
Gay men: 0.2% of all households
Household received Food Stamps/SNAP in the past 12 months: 1,373 Household did not receive Food Stamps/SNAP in the past 12 months: 7,026
Women who had a birth in the past 12 months: 408 (347 now married, 64 unmarried) Women who did not have a birth in the past 12 months: 4,860 (1,946 now married, 2,919 unmarried)
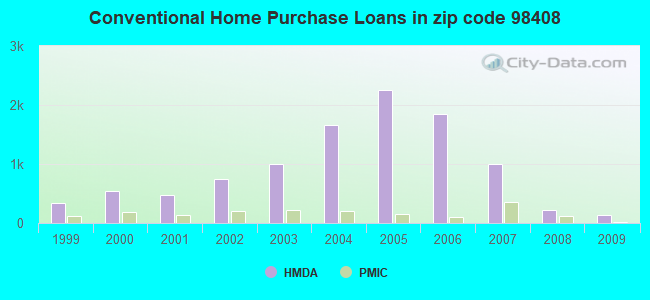
Housing units in zip code 98408 with a mortgage: 3,983 (403 second mortgage, 13 home equity loan, 270 both second mortgage and home equity loan) Houses without a mortgage: 74
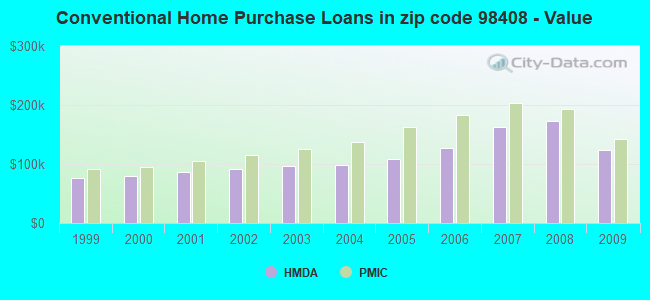
Median monthly owner costs for units with a mortgage: $1,953 Median monthly owner costs for units without a mortgage: $788
Residents with income below the poverty level in 2022:
This zip code:
10.3%
Whole state:
10.0%
Residents with income below 50% of the poverty level in 2022:
This zip code:
3.3%
Whole state:
4.6%
Median number of rooms in houses and condos:
Here:
6.2
State:
6.5
Median number of rooms in apartments:
Here:
4.1
State:
3.9
Notable locations in this zip code not listed on our city pages
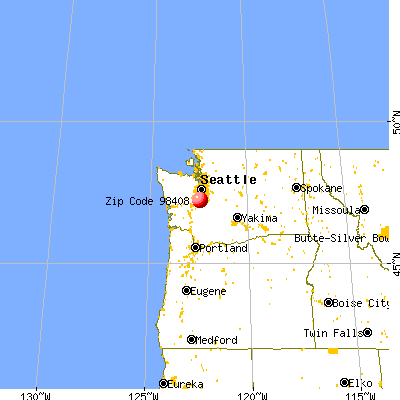
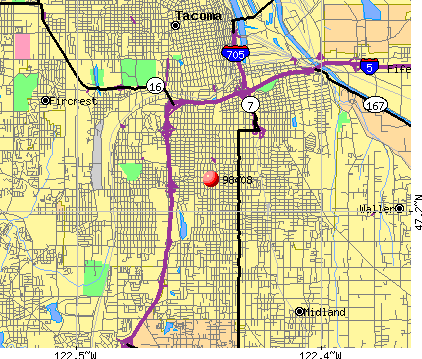
Notable locations in zip code 98408: Tacoma Pacific (A), Tacoma South (B), Pacific Center (C), Evergreen Tacoma Health and Rehabilitation Center (D), Heritage Rehabilitation and Specialty Care Facility (E), Tacoma Fire Department Station 10 (F). Display/hide their locations on the map
Churches in zip code 98408 include: New Life Samoan Assembly of God Church (A), Saint Ann Catholic Church (B), Bethany United Methodist Church (C), Calvary Baptist Church (D), Unitarian Universalist Church (E), United Lutheran Church (F), Abundant Life Fellowship Church (G), Grace Community Church (H), Greater Joy Church of God (I). Display/hide their locations on the map
2,026 married couples with children.
1,284 single-parent households (310 men, 974 women).
85.2% of residents of 98408 zip code speak English at home.
4.0% of residents speak Spanish at home (51% very well, 35% well, 14% not well).
1.5% of residents speak other Indo-European language at home (39% very well, 40% well, 14% not well, 7% not at all).
8.9% of residents speak Asian or Pacific Island language at home (48% very well, 19% well, 31% not well, 2% not at all).
0.2% of residents speak other language at home (100% very well).
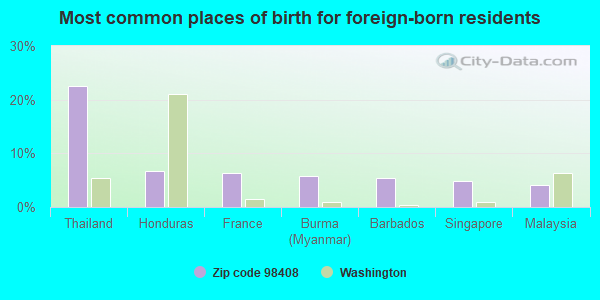
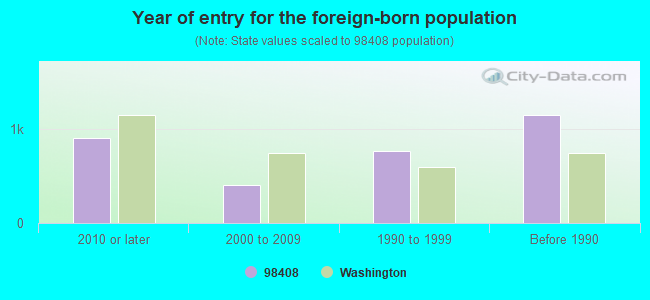
Foreign born population: 2,378 (11.0%) (65.1% of them are naturalized citizens)
Facilities with environmental interests located in this zip code:
APEX DRIVE IN CLEANERS (1208 S 56TH ST in TACOMA, WA)
(Resource Conservation and Recovery Act (tracking hazardous waste)) STATE MASTER (Washington State Department of Ecology's Facility/Site identification system) - TOXICS-101352, LEAKING STORAGE TANK, UNDERGROUND STORAGE TANK PROGRAM Business SIC classification: NONCLASSIFIABLE ESTABLISHMENTS Alternative names: APEX CLEANERS
CITY RENTS INC (3804 PACIFIC AVE in TACOMA, WA)
(Resource Conservation and Recovery Act (tracking hazardous waste)) STATE MASTER (Washington State Department of Ecology's Facility/Site identification system) - TOXICS-10232, UNDERGROUND STORAGE TANK PROGRAM Business SIC classification: NONCLASSIFIABLE ESTABLISHMENTS
35TH & A STREET RAVINE DUMP (SW COR S 35TH ST & S A ST in TACOMA, WA)
Conditionally Exempt Small Quantity Generators, less than 100 kg/month of hazardous waste (Resource Conservation and Recovery Act (tracking hazardous waste)) STATE MASTER (Washington State Department of Ecology's Facility/Site identification system) - HAZWASTE-WAD988500054, CESQG Business SIC classification: NONCLASSIFIABLE ESTABLISHMENTS Organizations: WA ECY (CONTACT/ HAZARDOUS WASTE)
, BRETT MANNING (CONTACT/OPERATOR)
68TH ST DRUG LAB (1016 S 68TH ST in TACOMA, WA)
Conditionally Exempt Small Quantity Generators, less than 100 kg/month of hazardous waste (Resource Conservation and Recovery Act (tracking hazardous waste)) STATE MASTER (Washington State Department of Ecology's Facility/Site identification system) - HAZWASTE-WAD988512612, CESQG Business SIC classification: NONCLASSIFIABLE ESTABLISHMENTS Organizations: WA ECY (CONTACT/ HAZARDOUS WASTE)
, JIM OBERLANDER (CONTACT/OPERATOR)
AKE PATHOLOGISTS (3582 PACIFIC AVE in TACOMA, WA)
(Resource Conservation and Recovery Act (tracking hazardous waste)) STATE MASTER (Washington State Department of Ecology's Facility/Site identification system) - HAZWASTE-WAD135864890, HAZARDOUS WASTE PROGRAM Business SIC and NAICS classification: MEDICAL LABORATORIES Organizations: BEVERLY MARCELIA (CONTACT/OPERATOR)
ARCO 4345 PSI 5503 (1772 S 72ND ST in TACOMA, WA)
(Resource Conservation and Recovery Act (tracking hazardous waste)) STATE MASTER (Washington State Department of Ecology's Facility/Site identification system) - TOXICS-8755, UNDERGROUND STORAGE TANK PROGRAM, HAZWASTE-WAD988514659, EPCRA, CESQG Business SIC classification: GASOLINE SERVICE STATIONS Organizations: DEREK REICHART (CONTACT/OPERATOR)
Alternative names: ARCO 04345
ARCO 6016 PSI 0576 (8247 PACIFIC AVE in TACOMA, WA)
(Resource Conservation and Recovery Act (tracking hazardous waste)) STATE MASTER (Washington State Department of Ecology's Facility/Site identification system) - TOXICS-8798, LEAKING STORAGE TANK, UNDERGROUND STORAGE TANK PROGRAM, HAZWASTE-WAD988515235, EPCRA, HAZARDOUS WASTE PROGRAM Business SIC classification: GASOLINE SERVICE STATIONS Organizations: HADI INC (CONTACT/OPERATOR)
, BP WEST COAST PRODUCTS LLC (CONTACT/OWNER)
CLEANERY TACOMC PACIFIC (7250 PACIFIC AVE NO A in TACOMA, WA)
(Resource Conservation and Recovery Act (tracking hazardous waste)) STATE MASTER (Washington State Department of Ecology's Facility/Site identification system) - HAZWASTE-WAD165608100, CESQG Business SIC classification: COIN-OPERATED LAUNDRIES AND DRYCLEANING; DRYCLEANING PLANTS, EXCEPT RUG CLEANING Organizations: JOHN JOHNSON (CONTACT/OPERATOR)
, THE CLEANERY OF WASHINGTON INC (CONTACT/OWNER)
CARLSON BROTHERS JEWELERS INC (861 S 38TH ST in TACOMA, WA)
(Resource Conservation and Recovery Act (tracking hazardous waste)) STATE MASTER (Washington State Department of Ecology's Facility/Site identification system) - HAZWASTE-WAD027532761, HAZARDOUS WASTE PROGRAM Business SIC classification: JEWELRY, PRECIOUS METAL; JEWELRY STORES; WATCH, CLOCK, AND JEWELRY REPAIR Business NAICS classification: JEWELRY (EXCEPT COSTUME) MANUFACTURING.; JEWELRY (EXCEPT COSTUME) MANUFACTURING. Organizations: CARLSON BROTHERS INC (CONTACT/OWNER)
BIRNEY (1202 S 76TH ST in TACOMA, WA)
(National Center for Education Statistics) - STATE ID-3449 Organizations: TACOMA SCH DIST 10 (SCHOOL DISTRICT)
CJF4 (3844 S A ST in TACOMA, WA)
(Resource Conservation and Recovery Act (tracking hazardous waste)) Business NAICS classification: NONRESIDENTIAL PROPERTY MANAGERS.
ACTION ONE REALTY INC (5042 S YAKIMA in TACOMA, WA)
COMPLIANCE ACTIVITY (Tracking inspections of insecticide, fungicide, and rodenticide, and toxic substances)
Housing units lacking complete plumbing facilities: 1.4% Housing units lacking complete kitchen facilities: 1.4%
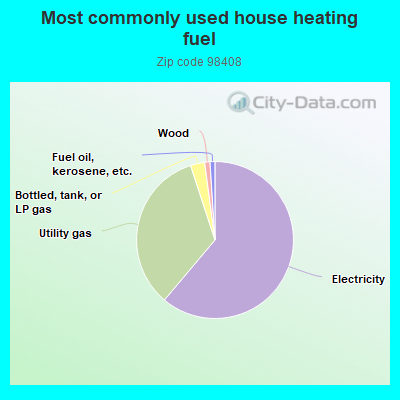
60.8%Electricity
33.6%Utility gas
2.9%Bottled, tank, or LP gas
1.1%Wood
1.0%Fuel oil, kerosene, etc.
Population in 1990: 28,753. Population change in the 1990s: +342 (+1.2%).
Place of birth for U.S.-born residents:
This state: 11,513
Northeast: 763
Midwest: 1,084
South: 1,702
West: 3,323
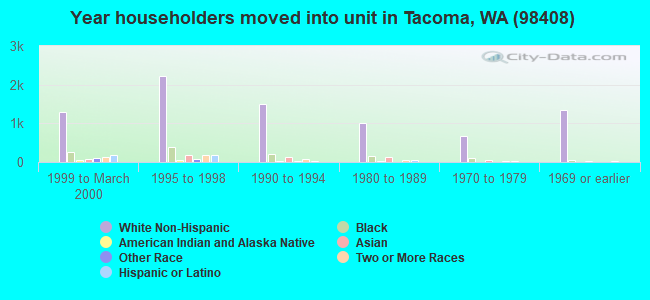
54% of the 98408 zip code residents lived in the same house 5 years ago. Out of people who lived in different houses, 72% lived in this county. Out of people who lived in different counties, 50% lived in Washington.
85% of the 98408 zip code residents lived in the same house 1 year ago. Out of people who lived in different houses, 64% moved from this county. Out of people who lived in different houses, 24% moved from different county within same state. Out of people who lived in different houses, 8% moved from different state. Out of people who lived in different houses, 1% moved from abroad.
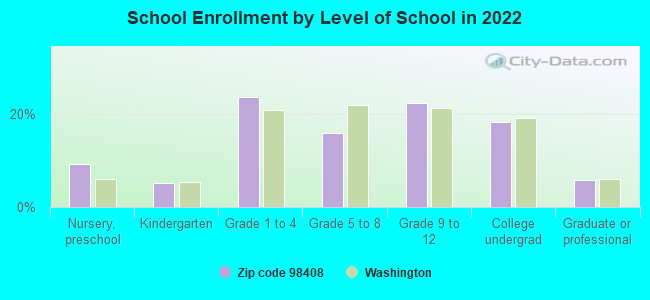
Private vs. public school enrollment:
Students in private schools in grades 1 to 8 (elementary and middle school): 426
Here:
24.9%
Washington:
12.4%
Students in private schools in grades 9 to 12 (high school): 1
Here:
0.1%
Washington:
9.2%
Students in private undergraduate colleges: 31
Here:
4.0%
Washington:
16.5%
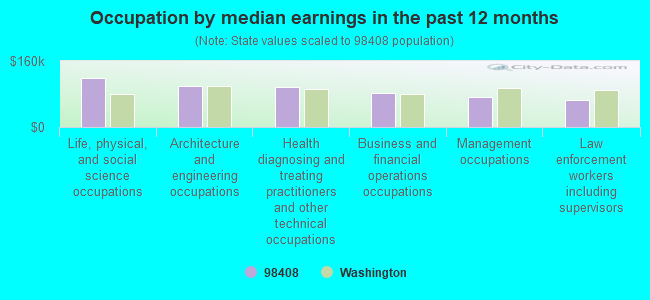
Occupation by median earnings in the past 12 months ($)
119,641Life, physical, and social science occupations
99,776Architecture and engineering occupations
96,658Health diagnosing and treating practitioners and other technical occupations
81,213Business and financial operations occupations
72,314Management occupations
66,493Law enforcement workers including supervisors
Companies with federal contracts located in this zip code (TACOMA, WA):
SHILO INN TACOMA LLC (7414 S HOSMER ST) : $856,898 in 4 contractsfrom 2003 to 2005
$539,330 with Army for Lodging - Hotel/Motel. Signed on 2003-02-28. Completion date: 2003-08-21.
$307,395, same as above.Signed on 2005-04-26. Completion date: 2005-08-18.
$30,321, same as above.Signed on 2003-05-19. Completion date: 2003-08-21.
-$20,148, same as above.Signed on 2005-08-26. Completion date: 2005-08-18.
MCGREGOR, HELEN (525 S 60TH STREET; small business) : $126,246 in 7 contractsfrom 2002 to 2006
Contracts for Nursing Services, Medical and Surgical Instruments, Equipment, and Supplies by Army Signed by year:2000: $0; 2001: $0; 2002: $45,606; 2003: $43,216; 2004: $43,216; 2005: -$3,546; 2006: -$2,246.
Biggest contracts:
$50,965 with Army for Nursing Services. Signed on 2005-10-18. Completion date: 2006-09-30.
$45,606 with Army for Medical and Surgical Instruments, Equipment, and Supplies. Signed on 2002-10-31. Completion date: 2003-09-30.
$43,216, same as above.Signed on 2004-10-01. Completion date: 2004-09-30.
$43,216, same as above.Signed on 2003-11-05. Completion date: 2004-09-30.
TOTAL SUPPLY & PROCUREMENT SER (523 SO. 54TH STREET; small business) : $121,801 in 2 contractsin 2000
$91,449 with Defense Logistics Agency for Valves, Powered. Signed on 2000-06-15. Completion date: 2000-10-23.
$30,352 with Defense Logistics Agency for Antennas, Waveguides, and Related Equipment. Signed on 2000-06-29. Completion date: 2000-07-29.
BRIGHT SHINY OBJECT LLC (6112 SOUTH M ST; small business) : $109,440 in 5 contractsfrom 2004 to 2006
Contracts for Programming Services by Army Signed by year:2000: $0; 2001: $0; 2002: $0; 2003: $0; 2004: $57,600; 2005: $34,560; 2006: $17,280.
Biggest contracts:
$57,600 with Army for Programming Services. Signed on 2004-08-31. Completion date: 2005-08-31.
$19,200, same as above.Signed on 2005-08-16. Completion date: 2005-12-31.
$17,280, same as above.Signed on 2006-03-31. Completion date: 2005-12-31.
$15,360, same as above.Signed on 2005-08-31. Completion date: 2005-12-31.
TOTAL SUPPLY AND PROCUREMENT S (523 S 54TH ST; small business)
$35,996 with Defense Logistics Agency for Switches. Signed on 2000-02-04. Completion date: 2000-06-04.
HILTON OUTBOARD MOTOR SERVICE (3914 CENTER ST; small business)
$9,476 with Army for Ship and Boat Propulsion Components. Signed on 2004-11-19. Completion date: 2004-12-21.
UNITED LAMP SUPPLY CO INC (215 S 50TH ST; small business) : $7,662 in 2 contractsin 2005
$4,376 with Defense Commissary Agency for Ballasts, Lampholders, and Starters. Signed on 2005-01-18. Completion date: 2005-01-28.
$3,286 with Defense Logistics Agency for Ballasts, Lampholders, and Starters. Signed on 2005-03-12. Completion date: 2005-03-23.
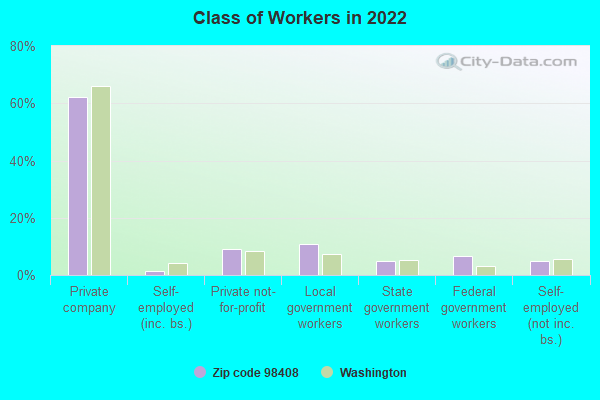
Top industries in this zip code by the number of employees in 2005:
2002 - 2018 National Fire Incident Reporting System (NFIRS) incidents
Based on the data from the years 2002 - 2018 the average number of fires per year is 97. The highest number of fire incidents - 191 took place in 2004, and the least - 51 in 2014. The data has a dropping trend.
When looking into fire subcategories, the most reports belonged to: Outside Fires (61.2%), and Structure Fires (23.6%).
Fire incident types reported to NFIRS in Zip Code 98408


 Nearest zip codes: 98418, 98404, 98409, 98444, 98402, 98447.


 Based on the data from the years 2002 - 2018 the average number of fires per year is 97. The highest number of fire incidents - 191 took place in 2004, and the least - 51 in 2014. The data has a dropping trend.
 When looking into fire subcategories, the most reports belonged to: Outside Fires (61.2%), and Structure Fires (23.6%).