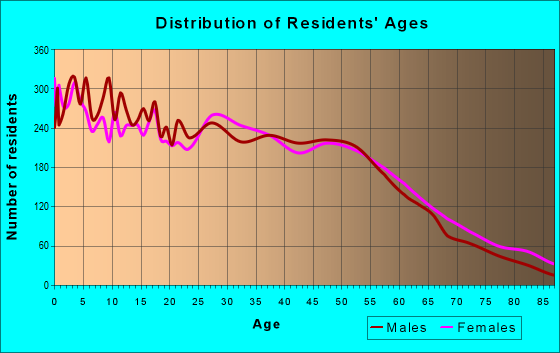
Estimated zip code population in 2022: 36,480 Zip code population in 2010: 32,086 Zip code population in 2000: 30,679
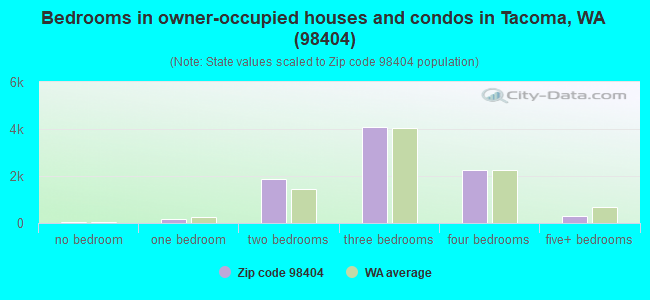
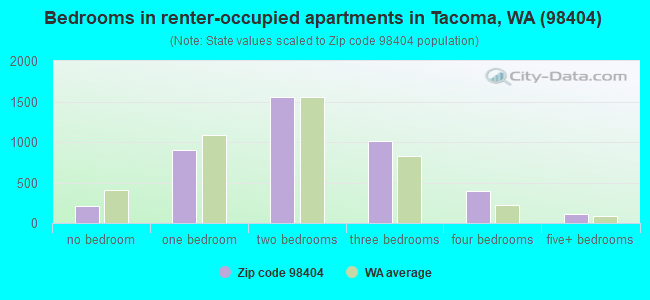
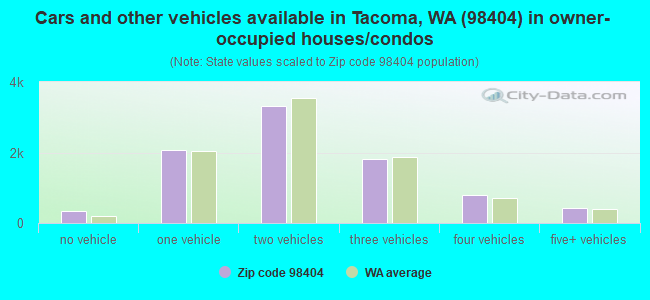
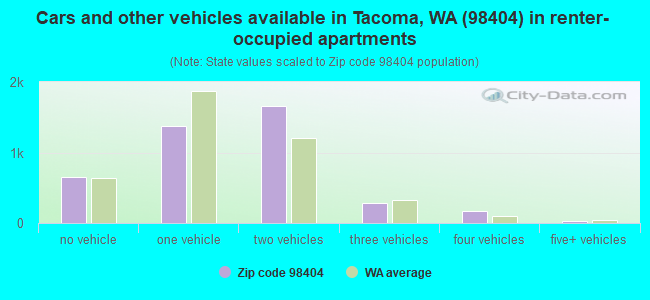
Houses and condos: 13,383 Renter-occupied apartments: 4,212
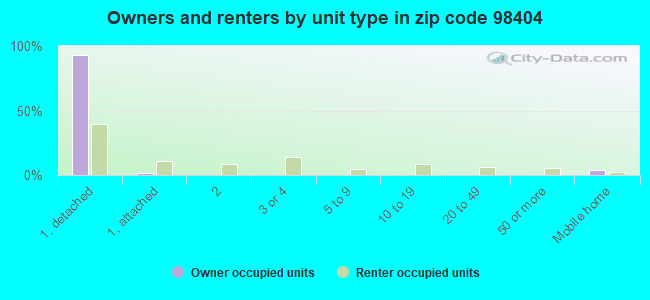
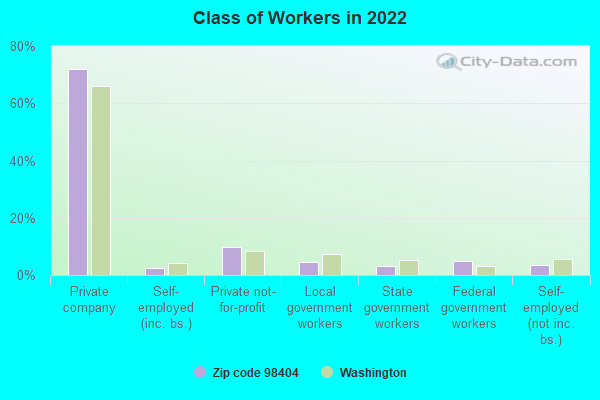
% of renters here:
32%
State:
36%
March 2022 cost of living index in zip code 98404: 108.7 (more than average, U.S. average is 100)
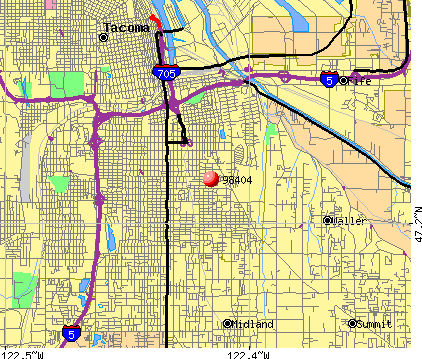
Land area: 7.6 sq. mi. Water area: 0.0 sq. mi.
Population density: 4,791 people per square mile
(average).
OSM Map
General Map
Google Map
MSN Map
OSM Map
General Map
Google Map
MSN Map
OSM Map
General Map
Google Map
MSN Map
OSM Map
General Map
Google Map
MSN Map
Please wait while loading the map...
Real estate property taxes paid for housing units in 2022:
This zip code:
0.8% ($3,333)
Washington:
0.8% ($4,283)
Median real estate property taxes paid for housing units with mortgages in 2022: $3,401 (0.8%) Median real estate property taxes paid for housing units with no mortgage in 2022: $2,992 (0.8%)
Averages for the 2020 tax year for zip code 98404, filed in 2021:
Average Adjusted Gross Income (AGI) in 2020: $49,050 (Individual Income Tax Returns)
Here:
$49,050
State:
$99,264
Salary/wage: $45,503 (reported on 85.5% of returns)
Here:
$45,503
State:
$80,347
(% of AGI for various income ranges: 1145.9% for AGIs below $25k, 3473.0% for AGIs $25k-50k, 6611.0% for AGIs $50k-75k, 9884.2% for AGIs $75k-100k, 16332.7% for AGIs $100k-200k, 75666.7% for AGIs over 200k)
Taxable interest for individuals: $496 (reported on 14.3% of returns)
This zip code:
$496
Washington:
$2,077
(% of AGI for various income ranges: 5.9% for AGIs below $25k, 5.0% for AGIs $25k-50k, 9.8% for AGIs $50k-75k, 11.1% for AGIs $75k-100k, 32.6% for AGIs $100k-200k, 226.7% for AGIs over 200k)
Ordinary dividends: $1,514 (reported on 8.5% of returns)
Here:
$1,514
State:
$10,013
(% of AGI for various income ranges: 7.3% for AGIs below $25k, 9.1% for AGIs $25k-50k, 14.6% for AGIs $50k-75k, 24.6% for AGIs $75k-100k, 64.3% for AGIs $100k-200k, 780.0% for AGIs over 200k)
Net capital gain/loss in AGI: +$5,984 (reported on 8.8% of returns)
Here:
+$5,984
State:
+$40,092
(% of AGI for various income ranges: 27.1% for AGIs $50k-75k, 55.0% for AGIs $75k-100k, 267.8% for AGIs $100k-200k, 18610.0% for AGIs over 200k)
Profit/loss from business: +$10,054 (reported on 9.8% of returns)
Here:
+$10,054
State:
+$18,312
(% of AGI for various income ranges: 84.2% for AGIs below $25k, 62.3% for AGIs $25k-50k, 126.8% for AGIs $50k-75k, 229.2% for AGIs $75k-100k, 388.2% for AGIs $100k-200k, 3600.0% for AGIs over 200k)
Taxable individual retirement arrangement distribution: $12,522 (reported on 2.7% of returns)
98404:
$12,522
Washington:
$24,221
(% of AGI for various income ranges: 17.6% for AGIs below $25k, 18.0% for AGIs $25k-50k, 54.1% for AGIs $50k-75k, 78.2% for AGIs $75k-100k, 216.4% for AGIs $100k-200k)
Total itemized deductions: $28,232 (reported on 5.9% of returns)
Here:
$28,232
State:
$39,068
(% of AGI for various income ranges: 24.7% for AGIs below $25k, 80.3% for AGIs $25k-50k, 288.0% for AGIs $50k-75k, 408.8% for AGIs $75k-100k, 732.9% for AGIs $100k-200k, 15506.7% for AGIs over 200k)
Charity contributions: $5,525 (reported on 3.6% of returns)
Here:
$5,525
State:
$15,331
(% of AGI for various income ranges: 2.0% for AGIs below $25k, 5.3% for AGIs $25k-50k, 25.1% for AGIs $50k-75k, 46.3% for AGIs $75k-100k, 141.4% for AGIs $100k-200k, 1693.3% for AGIs over 200k)
Taxes paid: $6,274 (reported on 5.7% of returns)
98404:
$6,274
State:
$7,774
(% of AGI for various income ranges: 5.8% for AGIs below $25k, 17.9% for AGIs $25k-50k, 70.2% for AGIs $50k-75k, 109.2% for AGIs $75k-100k, 170.7% for AGIs $100k-200k, 1286.7% for AGIs over 200k)
Earned income credit: $2,205 (reported on 17.7% of returns)
Here:
$2,205
State:
$2,020
(% of AGI for various income ranges: 96.0% for AGIs below $25k, 63.0% for AGIs $25k-50k, 0.9% for AGIs $50k-75k)
Percentage of individuals using paid preparers for their 2020 taxes: 93.8%
Here:
94%
State:
93%
(% for various income ranges: 92.8% for AGIs below $25k, 94.2% for AGIs $25k-50k, 94.7% for AGIs $50k-75k, 94.0% for AGIs $75k-100k, 93.9% for AGIs $100k-200k, 85.7% for AGIs over 200k)
Averages for the 2012 tax year for zip code 98404, filed in 2013:
Average Adjusted Gross Income (AGI) in 2012: $36,153 (Individual Income Tax Returns)
Here:
$36,153
State:
$69,533
Salary/wage: $34,175 (reported on 86.2% of returns)
Here:
$34,175
State:
$57,267
(% of AGI for various income ranges: 79.5% for AGIs below $25k, 79.4% for AGIs $25k-50k, 85.5% for AGIs $50k-75k, 84.6% for AGIs $75k-100k, 81.4% for AGIs $100k-200k, 57.7% for AGIs over 200k)
Taxable interest for individuals: $623 (reported on 18.5% of returns)
This zip code:
$623
Washington:
$1,816
(% of AGI for various income ranges: 0.3% for AGIs below $25k, 0.5% for AGIs $25k-50k, 0.2% for AGIs $50k-75k, 0.2% for AGIs $75k-100k, 0.2% for AGIs $100k-200k, 0.7% for AGIs over 200k)
Ordinary dividends: $2,465 (reported on 6.6% of returns)
Here:
$2,465
State:
$8,163
(% of AGI for various income ranges: 1.3% for AGIs below $25k, 0.3% for AGIs $25k-50k, 0.3% for AGIs $50k-75k, 0.3% for AGIs $75k-100k, 0.4% for AGIs $100k-200k)
Net capital gain/loss in AGI: +$451 (reported on 6.2% of returns)
Here:
+$451
State:
+$21,568
(% of AGI for various income ranges: 0.1% for AGIs $75k-100k, 0.9% for AGIs $100k-200k)
Profit/loss from business: +$8,509 (reported on 8.7% of returns)
Here:
+$8,509
State:
+$16,521
(% of AGI for various income ranges: 5.2% for AGIs below $25k, 1.7% for AGIs $25k-50k, 1.2% for AGIs $50k-75k, 1.5% for AGIs $75k-100k, 1.4% for AGIs $100k-200k)
Taxable individual retirement arrangement distribution: $9,494 (reported on 4.0% of returns)
98404:
$9,494
Washington:
$18,648
(% of AGI for various income ranges: 1.1% for AGIs below $25k, 0.8% for AGIs $25k-50k, 0.9% for AGIs $50k-75k, 1.2% for AGIs $75k-100k, 1.8% for AGIs $100k-200k)
Total itemized deductions: $16,899 (27% of AGI, reported on 21.5% of returns)
Here:
$16,899
State:
$23,872
Here:
27.1% of AGI
State:
18.2% of AGI
(% of AGI for various income ranges: 6.4% for AGIs below $25k, 8.5% for AGIs $25k-50k, 12.0% for AGIs $50k-75k, 12.1% for AGIs $75k-100k, 12.3% for AGIs $100k-200k, 10.8% for AGIs over 200k)
Charity contributions: $2,617 (reported on 14.7% of returns)
Here:
$2,617
State:
$4,465
(% of AGI for various income ranges: 0.4% for AGIs below $25k, 0.6% for AGIs $25k-50k, 1.4% for AGIs $50k-75k, 1.5% for AGIs $75k-100k, 1.8% for AGIs $100k-200k, 1.5% for AGIs over 200k)
Taxes paid: $4,034 (reported on 21.1% of returns)
98404:
$4,034
State:
$6,400
(% of AGI for various income ranges: 1.4% for AGIs below $25k, 1.8% for AGIs $25k-50k, 2.9% for AGIs $50k-75k, 3.0% for AGIs $75k-100k, 3.2% for AGIs $100k-200k, 2.8% for AGIs over 200k)
Earned income credit: $2,336 (reported on 25.9% of returns)
Here:
$2,336
State:
$2,073
(% of AGI for various income ranges: 8.1% for AGIs below $25k, 1.3% for AGIs $25k-50k)
Percentage of individuals using paid preparers for their 2012 taxes: 50.3%
Here:
50%
State:
43%
(% for various income ranges: 46.8% for AGIs below $25k, 55.8% for AGIs $25k-50k, 47.4% for AGIs $50k-75k, 50.6% for AGIs $75k-100k, 56.2% for AGIs $100k-200k)
Averages for the 2004 tax year for zip code 98404, filed in 2005:
Average Adjusted Gross Income (AGI) in 2004: $31,146 (Individual Income Tax Returns)
Here:
$31,146
State:
$54,331
Salary/wage: $29,738 (reported on 87.3% of returns)
Here:
$29,738
State:
$45,761
(% of AGI for various income ranges: 81.2% for AGIs below $10k, 82.8% for AGIs $10k-25k, 86.7% for AGIs $25k-50k, 85.2% for AGIs $50k-75k, 83.9% for AGIs $75k-100k, 65.0% for AGIs over 100k)
Taxable interest for individuals: $883 (reported on 23.7% of returns)
This zip code:
$883
Washington:
$2,110
(% of AGI for various income ranges: 1.4% for AGIs below $10k, 0.9% for AGIs $10k-25k, 0.5% for AGIs $25k-50k, 0.5% for AGIs $50k-75k, 0.5% for AGIs $75k-100k, 1.7% for AGIs over 100k)
Taxable dividends: $1,313 (reported on 8.8% of returns)
Here:
$1,313
State:
$5,879
(% of AGI for various income ranges: 0.7% for AGIs below $10k, 0.6% for AGIs $10k-25k, 0.3% for AGIs $25k-50k, 0.3% for AGIs $50k-75k, 0.3% for AGIs $75k-100k, 0.5% for AGIs over 100k)
Net capital gain/loss: +$5,700 (reported on 6.5% of returns)
Here:
+$5,700
State:
+$15,835
(% of AGI for various income ranges: -0.5% for AGIs below $10k, 0.0% for AGIs $10k-25k, 0.2% for AGIs $25k-50k, 0.4% for AGIs $50k-75k, 0.9% for AGIs $75k-100k, 11.0% for AGIs over 100k)
Profit/loss from business: +$6,289 (reported on 8.8% of returns)
Here:
+$6,289
State:
+$13,994
(% of AGI for various income ranges: 2.4% for AGIs below $10k, 3.3% for AGIs $10k-25k, 1.3% for AGIs $25k-50k, 1.7% for AGIs $50k-75k, 1.1% for AGIs $75k-100k, 1.7% for AGIs over 100k)
IRA payment deduction: $2,059 (reported on 1.3% of returns)
98404:
$2,059
Washington:
$3,001
(% of AGI for various income ranges: 0.1% for AGIs $10k-25k, 0.1% for AGIs $25k-50k, 0.1% for AGIs $50k-75k, 0.1% for AGIs $75k-100k)
Self-employed pension: $2,786 (reported on 0.1% of returns)
Here:
$2,786
Washington:
$14,244
Total itemized deductions: $14,024 (27% of AGI, reported on 25.4% of returns)
Here:
$14,024
State:
$19,669
Here:
27.2% of AGI
State:
20.7% of AGI
(% of AGI for various income ranges: 8.0% for AGIs below $10k, 7.8% for AGIs $10k-25k, 11.4% for AGIs $25k-50k, 14.2% for AGIs $50k-75k, 13.3% for AGIs $75k-100k, 9.7% for AGIs over 100k)
Charity contributions deductions: $2,018 (4% of AGI, reported on 19.9% of returns)
Here:
$2,018
State:
$3,569
Here:
3.7% of AGI
State:
3.5% of AGI
(% of AGI for various income ranges: 0.4% for AGIs below $10k, 0.7% for AGIs $10k-25k, 1.2% for AGIs $25k-50k, 1.6% for AGIs $50k-75k, 1.6% for AGIs $75k-100k, 1.8% for AGIs over 100k)
Total tax: $3,465 (reported on 66.2% of returns)
98404:
$3,465
State:
$9,065
(% of AGI for various income ranges: 2.6% for AGIs below $10k, 3.3% for AGIs $10k-25k, 5.7% for AGIs $25k-50k, 8.5% for AGIs $50k-75k, 10.8% for AGIs $75k-100k, 16.5% for AGIs over 100k)
Earned income credit: $1,784 (reported on 23.3% of returns)
Here:
$1,784
State:
$1,607
Percentage of individuals using paid preparers for their 2004 taxes: 59.2%
Here:
59%
State:
49%
(% for various income ranges: 56.2% for AGIs below $10k, 61.7% for AGIs $10k-25k, 60.2% for AGIs $25k-50k, 56.0% for AGIs $50k-75k, 53.8% for AGIs $75k-100k, 66.8% for AGIs over 100k)
Likely homosexual households (counted as self-reported same-sex unmarried-partner households)
Lesbian couples: 0.2% of all households
Gay men: 0.1% of all households
Household received Food Stamps/SNAP in the past 12 months: 3,373 Household did not receive Food Stamps/SNAP in the past 12 months: 9,628
Women who had a birth in the past 12 months: 804 (555 now married, 240 unmarried) Women who did not have a birth in the past 12 months: 7,967 (3,337 now married, 4,636 unmarried)
Housing units in zip code 98404 with a mortgage: 6,367 (567 second mortgage, 514 both second mortgage and home equity loan) Houses without a mortgage: 34
Median monthly owner costs for units with a mortgage: $1,873 Median monthly owner costs for units without a mortgage: $684
Residents with income below the poverty level in 2022:
This zip code:
15.9%
Whole state:
10.0%
Residents with income below 50% of the poverty level in 2022:
This zip code:
6.7%
Whole state:
4.6%
Median number of rooms in houses and condos:
Here:
5.9
State:
6.5
Median number of rooms in apartments:
Here:
4.5
State:
3.9
Notable locations in this zip code not listed on our city pages
Notable locations in zip code 98404: Tahoma Vista (A), 72nd Street Square (B), Tacoma Rehabilitation and Specialty Care Facility (C), Heartwood Extended Health Care Facility (D), Tacoma Fire Department Station 11 (E). Display/hide their locations on the map
Churches in zip code 98404 include: New Hope Baptist Church (A), Pilgrim Rest Baptist Church (B), Portland Avenue Evangelical Church (C), Ranier Tenrikyo Fellowship Church (D), Saints Peter and Paul Church (E), Tacoma Samon Seventh Day Adventist Church (F), The Church of Jesus Christ of Latter Day Saints (G), Trinity United Methodist Church (H), Wesleyan Holiness Church (I). Display/hide their locations on the map
Parks in zip code 98404 include: Swan Creek County Park (1), Stewart Heights Playfield (2), McKinley Park (3), Portland Avenue Park (4). Display/hide their locations on the map
Tourist attraction (not listed on the city page) : Tacoma City - Community Libraries- Mottet (Cultural Attractions- Events- & Facilities; 3523 East G Street).
4,511 married couples with children.
3,173 single-parent households (958 men, 2,215 women).
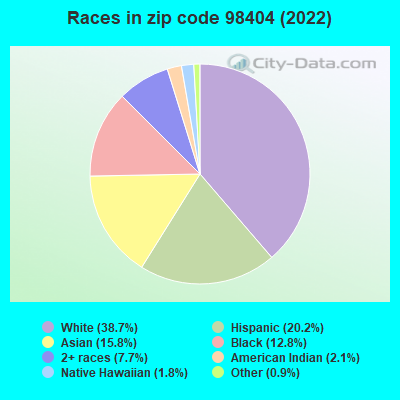
68.8% of residents of 98404 zip code speak English at home.
12.6% of residents speak Spanish at home (57% very well, 17% well, 22% not well, 4% not at all).
4.5% of residents speak other Indo-European language at home (49% very well, 11% well, 39% not well, 1% not at all).
13.1% of residents speak Asian or Pacific Island language at home (35% very well, 31% well, 30% not well, 4% not at all).
0.7% of residents speak other language at home (82% very well, 18% well).
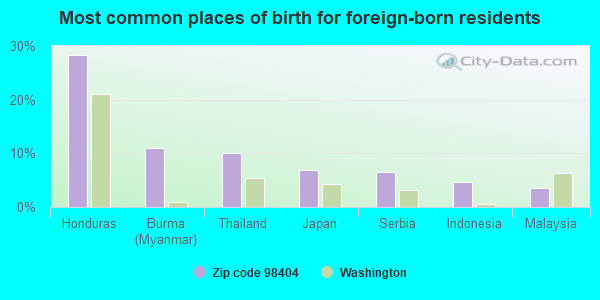
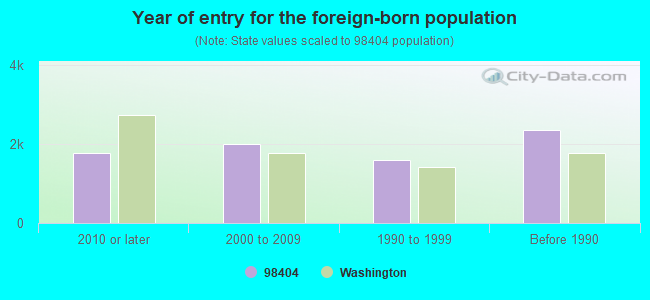
Foreign born population: 6,889 (18.9%) (56.5% of them are naturalized citizens)
Facilities with environmental interests located in this zip code:
80TH ST DRUG LAB (425 E 80TH ST in TACOMA, WA)
Conditionally Exempt Small Quantity Generators, less than 100 kg/month of hazardous waste (Resource Conservation and Recovery Act (tracking hazardous waste)) STATE MASTER (Washington State Department of Ecology's Facility/Site identification system) - HAZWASTE-WAD988507000, CESQG Business SIC classification: NONCLASSIFIABLE ESTABLISHMENTS Organizations: WA ECY (CONTACT/ HAZARDOUS WASTE)
, BRETT MANNING (CONTACT/OPERATOR)
BURNS TOWING (6454 MCKINLEY AVE in TACOMA, WA)
Conditionally Exempt Small Quantity Generators, less than 100 kg/month of hazardous waste (Resource Conservation and Recovery Act (tracking hazardous waste)) STATE MASTER (Washington State Department of Ecology's Facility/Site identification system) - HAZWASTE-WAD982658726, CESQG Business SIC classification: NONCLASSIFIABLE ESTABLISHMENTS Organizations: WA ECY (CONTACT/ HAZARDOUS WASTE)
, MIKE OSWEILER (CONTACT/OPERATOR)
BURNS AUTO SERVICE INC (716 E 64TH ST in TACOMA, WA)
(Resource Conservation and Recovery Act (tracking hazardous waste)) STATE MASTER (Washington State Department of Ecology's Facility/Site identification system) - TOXICS-7027, LEAKING STORAGE TANK, UNDERGROUND STORAGE TANK PROGRAM, HAZWASTE-WAD988522504, EPCRA, HAZARDOUS WASTE PROGRAM Business SIC classification: GASOLINE SERVICE STATIONS; AUTOMOTIVE REPAIR SHOPS; AUTOMOTIVE SERVICES, EXCEPT REPAIR AND CARWASHES Organizations: ROBERT BURNS SR (CONTACT/OPERATOR)
Alternative names: ROBERT F BURNS
BOSTONS INC (7517 PORTLAND AVE in TACOMA, WA)
(Resource Conservation and Recovery Act (tracking hazardous waste)) STATE MASTER (Washington State Department of Ecology's Facility/Site identification system) - TOXICS-, UNDERGROUND STORAGE TANK PROGRAM, HAZWASTE-WAD988476602, EPCRA Business SIC classification: FUEL OIL DEALERS; NONCLASSIFIABLE ESTABLISHMENTS Business NAICS classification: HEATING OIL DEALERS. Alternative names: BOSTONS INC UST 100263
BURNS AUTO BODY COLLISION CENTER INC (702 E 64TH ST in TACOMA, WA)
Small Quantity Generators, between 100 kg and 1000 kg of hazardous waste/month (Resource Conservation and Recovery Act (tracking hazardous waste)) - notification STATE MASTER (Washington State Department of Ecology's Facility/Site identification system) - HAZWASTE-WAD079246427, HAZARDOUS WASTE PROGRAM, SQG Business SIC classification: TOP, BODY, AND UPHOLSTERY REPAIR SHOPS AND PAINT SHOPS Organizations: DARREN ZACHARY (CONTACT/OPERATOR)
BOZE (1140 EAST 65TH in TACOMA, WA)
(National Center for Education Statistics) - STATE ID-3646 Organizations: TACOMA SCH DIST 10 (SCHOOL DISTRICT)
BURNS TOWING VAN (64TH & MCKINLEY in TACOMA, WA)
(Resource Conservation and Recovery Act (tracking hazardous waste)) Organizations: WA ECY (CONTACT/OWNER)
CHRISTIAN PARKER DRUM (5020 E PORTLAND AVE in TACOMA, WA)
(Resource Conservation and Recovery Act (tracking hazardous waste)) Organizations: WA ECY (CONTACT/OWNER)
Housing units lacking complete plumbing facilities: 0.5% Housing units lacking complete kitchen facilities: 1.7%
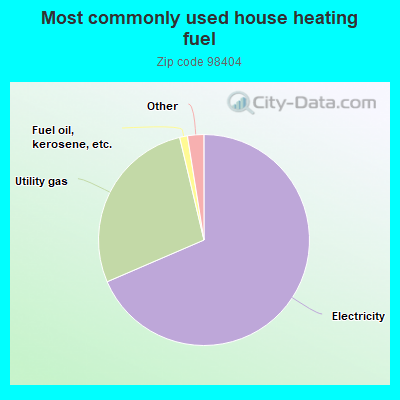
68.6%Electricity
27.8%Utility gas
1.2%Fuel oil, kerosene, etc.
0.9%No fuel used
0.8%Wood
0.7%Bottled, tank, or LP gas
Population in 1990: 27,135. Population change in the 1990s: +3,544 (+13.1%).
Place of birth for U.S.-born residents:
This state: 18,744
Northeast: 1,356
Midwest: 1,606
South: 2,082
West: 4,838
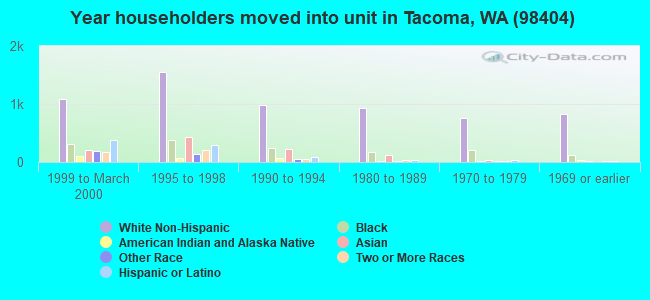
52% of the 98404 zip code residents lived in the same house 5 years ago. Out of people who lived in different houses, 71% lived in this county. Out of people who lived in different counties, 50% lived in Washington.
88% of the 98404 zip code residents lived in the same house 1 year ago. Out of people who lived in different houses, 40% moved from this county. Out of people who lived in different houses, 36% moved from different county within same state. Out of people who lived in different houses, 20% moved from different state. Out of people who lived in different houses, 6% moved from abroad.
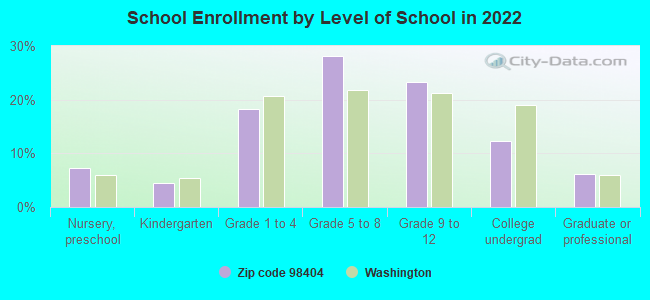
Private vs. public school enrollment:
Students in private schools in grades 1 to 8 (elementary and middle school): 587
Here:
15.0%
Washington:
12.4%
Students in private schools in grades 9 to 12 (high school): 308
Here:
15.6%
Washington:
9.2%
Students in private undergraduate colleges: 124
Here:
11.9%
Washington:
16.5%
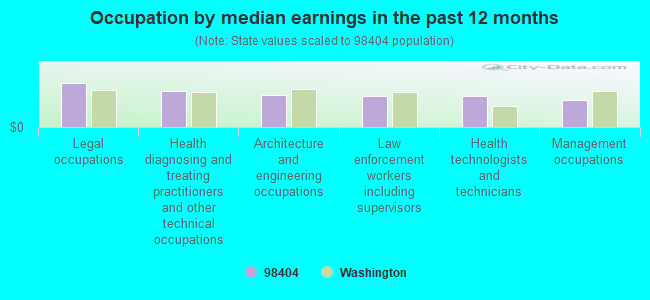
Occupation by median earnings in the past 12 months ($)
108,960Legal occupations
89,087Health diagnosing and treating practitioners and other technical occupations
80,091Architecture and engineering occupations
76,656Law enforcement workers including supervisors
76,325Health technologists and technicians
67,986Management occupations
Companies with biggest federal contracts located in this zip code (TACOMA, WA):
KEVIN MOSS (1423 E 29 ST; small business) : $573,450 in 27 contractsfrom 2000 to 2006
Contracts for Maintenance, Repair or Alteration of Real Property -- Highways, Roads, Streets, Bridges, and Railways (includes resurfacing), Landscaping/Groundskeeping Services, Lease or Rental of Equipment -- Construction, Mining, Excavating, and Highway Maintenance Equipment, Highways, Roads, Streets, Bridges, and Railways, and moreby Forest Service, Army, U.S. Army Corps of Engineers - civil program financing only, Federal Highway Administration, and others Signed by year:2000: $34,000; 2001: $10,660; 2002: $0; 2003: $0; 2004: $0; 2005: $484,790; 2006: $44,000.
Biggest contracts:
$265,000 with Forest Service for Maintenance, Repair or Alteration of Real Property -- Highways, Roads, Streets, Bridges, and Railways (includes resurfacing). Signed on 2005-05-23. Completion date: 2005-10-20.
$44,000 with Army for Landscaping/Groundskeeping Services. Signed on 2006-04-21. Completion date: 2006-04-06.
$39,550 with Army for Lease or Rental of Equipment -- Construction, Mining, Excavating, and Highway Maintenance Equipment. Signed on 2005-04-28. Completion date: 2005-05-02.
$39,550 with U.S. Army Corps of Engineers - civil program financing only for Lease or Rental of Equipment -- Construction, Mining, Excavating, and Highway Maintenance Equipment. Signed on 2005-04-28. Completion date: 2005-05-02.
RALPH CARNEY (320 E 32ND #110; small business) : $306,559 in 11 contractsfrom 2000 to 2006
Contracts for Chaplain Services, Other Professional Services by Army Signed by year:2000: $26,100; 2001: $0; 2002: $25,900; 2003: $16,650; 2004: $56,460; 2005: $96,410; 2006: $85,039.
Biggest contracts:
$85,039 with Army for Chaplain Services. Signed on 2006-03-09. Completion date: 2007-03-31.
$80,395, same as above.Signed on 2005-03-17. Completion date: 2006-03-31.
$41,110, same as above.Signed on 2004-10-21. Completion date: 2006-03-31.
$26,100, same as above.Signed on 2000-12-21. Completion date: 2001-12-31.
TACOMA STEEL SUPPLY CO (701 E 64TH ST; small business) : $167,280 in 15 contractsfrom 2002 to 2005
Contracts for Quality Control Services -- Metal Bars, Sheets, and Shapes, Bars and Rods, Structural Shapes, Gas Turbines and Jet Engines, Aircraft; Prime Moving, and Components by Army, Navy Signed by year:2000: $0; 2001: $0; 2002: $35,614; 2003: $3,622; 2004: $106,314; 2005: $21,730; 2006: $0.
Biggest contracts:
$71,428 with Army for Quality Control Services -- Metal Bars, Sheets, and Shapes. Signed on 2004-12-30. Completion date: 2005-01-06.
$23,176 with Navy for Bars and Rods. Signed on 2004-12-09. Completion date: 2005-03-10.
$15,069 with Army for Structural Shapes. Signed on 2002-08-19. Completion date: 2002-08-28.
$13,120 with Army for Bars and Rods. Signed on 2005-02-24. Completion date: 2005-03-15.
J.R. SERVICE OLIVO INC (1824 EAST HARRISON; small business)
$93,740 with Air Force for Warehousing and Storage Services. Signed on 1999-10-01. Completion date: 2000-09-30.
FERGUSON & SANDERSON (219 DIVISON COURT E; small business) : $82,433 in 15 contractsfrom 2003 to 2005
Contracts for Lodging - Hotel/Motel by Army Signed by year:2000: $0; 2001: $0; 2002: $0; 2003: $51,940; 2004: $26,313; 2005: $4,180; 2006: $0.
Biggest contracts:
$18,081 with Army for Lodging - Hotel/Motel. Signed on 2004-10-01. Completion date: 2005-01-31.
$14,504, same as above.Signed on 2003-10-29. Completion date: 2003-12-31.
$13,377, same as above.Signed on 2003-12-24. Completion date: 2004-03-31.
$13,377, same as above.Signed on 2004-06-08. Completion date: 2004-03-31.
PUYALLUP TRIBE OF INDIANS (2002 E 28TH ST.; small business)
$64,582 with Army for Environmental Studies and Assessments. Signed on 2000-09-11. Completion date: 2001-09-30.
JERRY HYMAN (320 EAST 32ND STREET #410; small business) : $61,923 in 9 contractsfrom 2003 to 2006
Contracts for Marine Hardware and Hull Items, Other Salvage Services, Preparation and Disposal of Excess and Surplus Property, Structural Shapes, Nonferrous Base Metal by Navy, Defense Logistics Agency Signed by year:2000: $0; 2001: $0; 2002: $0; 2003: $31,888; 2004: $13,952; 2005: $35,211; 2006: -$19,128.
Biggest contracts:
$31,888 with Navy for Marine Hardware and Hull Items. Signed on 2003-07-25. Completion date: 2003-09-05.
$13,952 with Navy for Other Salvage Services. Signed on 2005-03-24. Completion date: 2006-02-28.
$13,952, same as above.Signed on 2004-02-27. Completion date: 2005-02-28.
$10,200 with Defense Logistics Agency for Preparation and Disposal of Excess and Surplus Property. Signed on 2005-03-18. Completion date: 2005-04-19.
ANOTHER LEVEL PRODUCTS INC (1423 E 29TH; small business) : $39,446 in 3 contractsin 2005
$27,446 with Air Force for Miscellaneous Household and Commercial Furnishings and Appliances. Taking place in NY. Signed on 2005-04-16. Completion date: 2005-05-27.
$13,273 with Air Force for Fire Fighting Equipment. Signed on 2005-01-21. Completion date: 2005-02-20.
-$1,273 with Air Force for Miscellaneous Household and Commercial Furnishings and Appliances. Taking place in NY. Signed on 2005-06-17. Completion date: 2005-06-20.
TMG SERVICES INC (3216 E PORTLAND AVE; small business) : $22,172 in 2 contractsfrom 2004 to 2005
$13,688 with U.S. Fish and Wildlife Service for Utilities. Taking place in ID. Signed on 2004-07-29. Completion date: 2004-09-30.
$8,484 with Navy for Pressure, Temperature, and Humidity Measuring and Controlling Instruments. Signed on 2005-04-14. Completion date: 2005-06-23.
EVER SO GREEN LAWN & GROUNDS M (4802 EAST I ST; small business)
$12,282 with Navy for Landscaping/Groundskeeping Services. Signed on 2006-04-27. Completion date: 2007-04-26.
Top industries in this zip code by the number of employees in 2005:
2002 - 2018 National Fire Incident Reporting System (NFIRS) incidents
According to the data from the years 2002 - 2018 the average number of fire incidents per year is 170. The highest number of fires - 241 took place in 2003, and the least - 81 in 2013. The data has a dropping trend.
When looking into fire subcategories, the most reports belonged to: Outside Fires (64.7%), and Structure Fires (21.4%).
Fire incident types reported to NFIRS in Zip Code 98404


 Nearest zip codes: 98408, 98418, 98443, 98402, 98421, 98424.
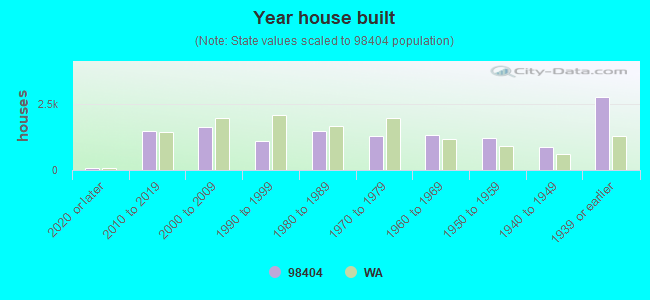


 According to the data from the years 2002 - 2018 the average number of fire incidents per year is 170. The highest number of fires - 241 took place in 2003, and the least - 81 in 2013. The data has a dropping trend.
 When looking into fire subcategories, the most reports belonged to: Outside Fires (64.7%), and Structure Fires (21.4%).