Bloomington: Fire Incidents, California (CA)
Where are fire incidents reported in Bloomington, CA
Something went wrong! Please refresh the page.
|
| |||||||||||||||||||||||||||||||||||||||||||||||||||||||||||||||||||||||||||||||||||||||||||||||||||||||||||||
2005 - 2018 National Fire Incident Reporting System (NFIRS) incidents
- Incident types reported to NFIRS in Bloomington, CA
- 1,94468.7%Rescue & EMS
- 39013.8%Good Intent Call
- 1736.1%Fire
- 1495.3%Service Call
- 1234.3%Hazardous Condition
- 491.7%False Alarm
- Fire incident types reported to NFIRS in Bloomington, CA
- 5934.1%Outside Fires
- 5531.8%Structure Fires
- 5431.2%Mobile Property/Vehicle Fires
- 52.9%Other
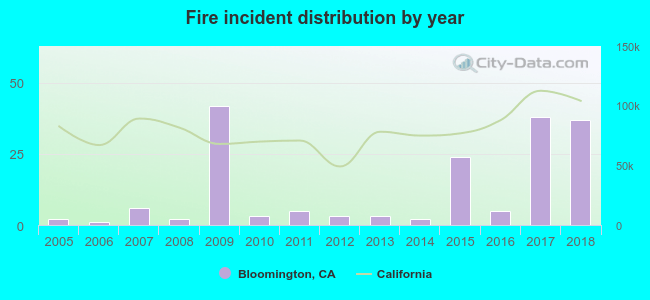 According to the data from the years 2005 - 2018 the average number of fires per year is 12. The highest number of reported fires - 42 took place in 2009, and the least - 1 in 2006. The data has a growing trend.
The average number of yearly fire incidents per 10k residents in Bloomington, CA compared to nearest cities:
(Note: Based on data for the last 3 years, including only cities with population 5,000 and above)
| Bloomington: | 11.2 |
| Rialto: | 4.3 |
| Fontana: | 8.5 |
| Colton: | 60.0 |
| Rubidoux: | 1.3 |
| Grand Terrace: | 8.3 |
| Jurupa: | 0.1 |
| Muscoy: | 21.0 |
| Riverside: | 29.1 |
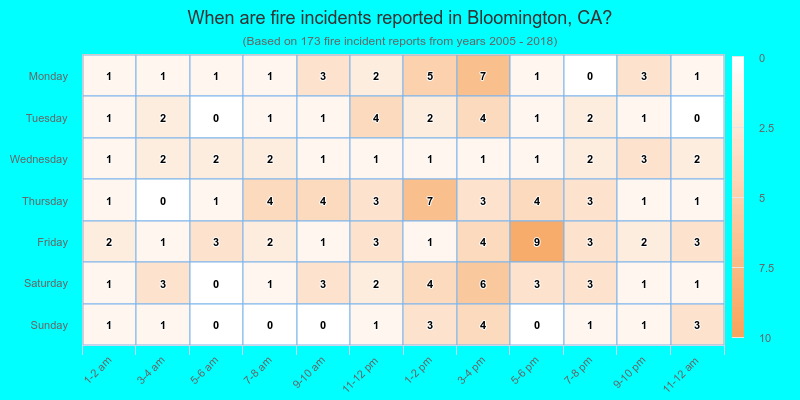
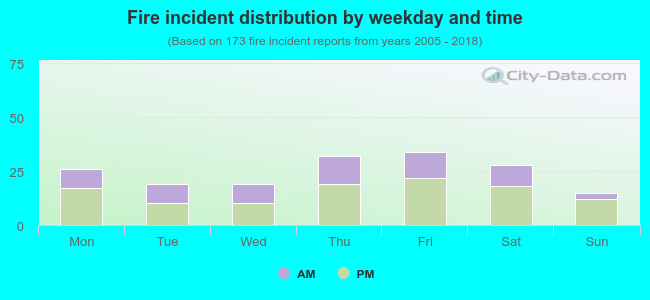 37.6% incidents where reported in the morning and 62.4% in the evening. The most fires (19.7%) took place on Friday, and the least (8.7%) on Sunday.
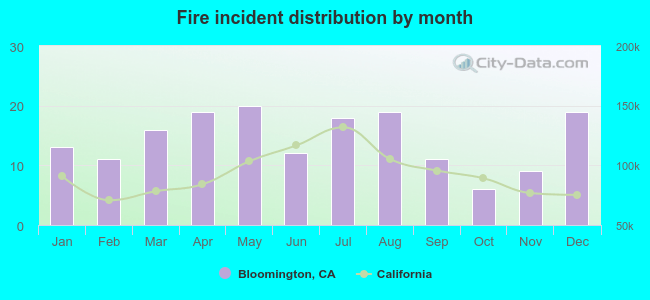 According to the 173 reports from years 2005 - 2018 most fires (11.6%) took place during May, and the least (3.5%) in October.
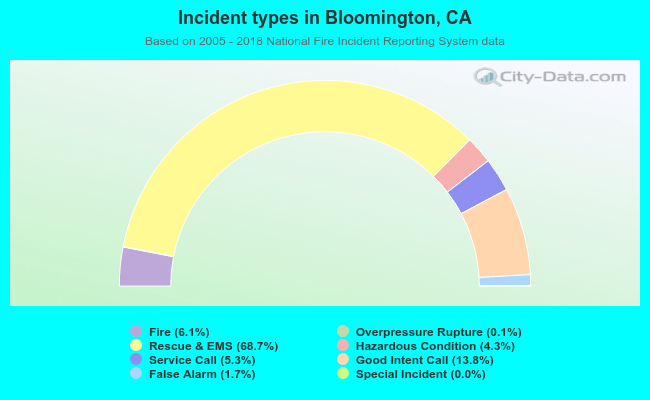 Out of all 2,831 cases reported during the years 2005 - 2018, the most belonged to the categories: Rescue & EMS (68.7%), Good Intent Call (13.8%), and Fire (6.1%).
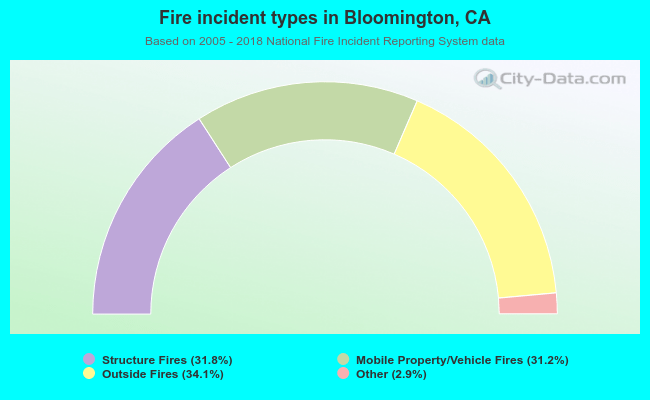 When looking into fire subcategories, the most reports belonged to: Outside Fires (34.1%), and Structure Fires (31.8%).