Brookfield: Fire Incidents, Illinois (IL)
Where are fire incidents reported in Brookfield, IL
Something went wrong! Please refresh the page.
| Fire incidents reported | |
|---|---|
| Sreet name | Count |
| MAPLE AVE | 104 |
| FOREST AVE | 80 |
| OGDEN AVE | 72 |
| PARK AVE | 70 |
| VERNON AVE | 70 |
| ARTHUR AVE | 56 |
| PARK | 56 |
| GRAND BLVD | 52 |
| BLANCHAN AVE | 50 |
| PRAIRIE AVE | 48 |
| SUNNYSIDE | 48 |
| VERNON | 46 |
| MAPLE | 42 |
| SUNNYSIDE AVE | 42 |
| MCCORMICK AVE | 40 |
| 47TH ST | 38 |
| MADISON | 38 |
| BROOKFIELD AVE | 36 |
| DEYO | 36 |
| MADISON AVE | 36 |
| JEFFERSON | 34 |
| ARTHUR | 30 |
| ELM | 30 |
| ELM AVE | 30 |
| GRAND | 30 |
| WASHINGTON AVE | 28 |
| EBERLY | 26 |
| BLANCHAN | 24 |
| FOREST | 24 |
| OAK | 24 |
2002 - 2018 National Fire Incident Reporting System (NFIRS) incidents
- Incident types reported to NFIRS in Brookfield, IL
- 1,81033.2%Hazardous Condition
- 1,20322.1%Fire
- 82015.0%False Alarm
- 67812.4%Good Intent Call
- 4518.3%Rescue & EMS
- 4408.1%Service Call
- 200.4%Special Incident
- 160.3%Severe Weather
- 150.3%Overpressure Rupture
- Fire incident types reported to NFIRS in Brookfield, IL
- 82368.4%Structure Fires
- 26021.6%Outside Fires
- 726.0%Mobile Property/Vehicle Fires
- 484.0%Other
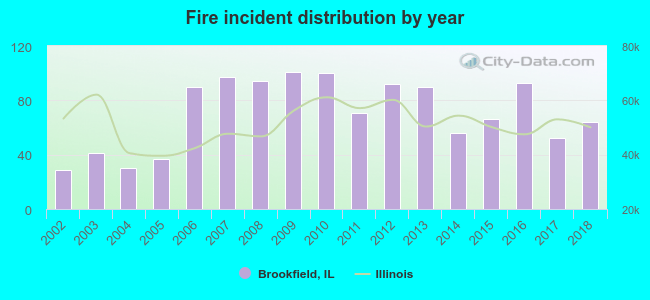 According to the data from the years 2002 - 2018 the average number of fires per year is 71. The highest number of fires - 101 took place in 2009, and the least - 29 in 2002. The data has a growing trend.
The average number of yearly fire incidents per 10k residents in Brookfield, IL compared to nearest cities:
(Note: Based on data for the last 3 years, including only cities with population 5,000 and above)
| Brookfield: | 36.6 |
| La Grange Park: | 15.4 |
| Lyons: | 67.8 |
| La Grange: | 20.1 |
| Riverside: | 20.6 |
| North Riverside: | 31.4 |
| Broadview: | 57.0 |
| Westchester: | 37.1 |
| Summit: | 57.7 |
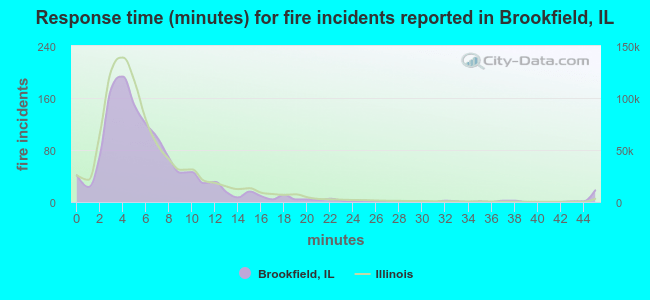 The median response time based on all reported fire incidents is 5 minutes. This is comparable to the state median value.
The median response time in Brookfield, IL compared to nearest cities:
(Note: Based on data for all years, including only cities with at least 500 fire incidents)
| Brookfield: | 5 minutes |
| Lyons: | 5 minutes |
| Riverside: | 6 minutes |
| Broadview: | 3 minutes |
| Westchester: | 4 minutes |
| Summit: | 5 minutes |
| Stickney: | 5 minutes |
| Berwyn: | 3 minutes |
| Forest Park: | 5 minutes |
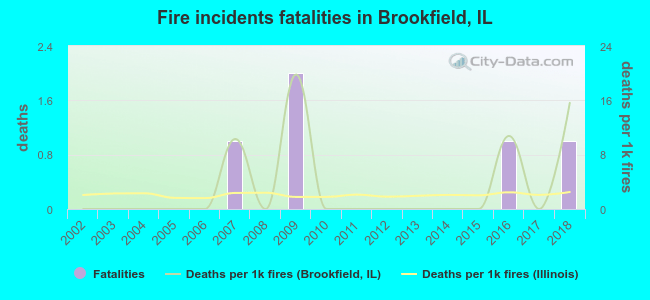 According to the reports from the years 2002 - 2018 the average number of fire-related yearly deaths is 0. The highest number of deaths - 2 took place in 2009, and the lowest - 0 in 2002. The data has an increasing trend.
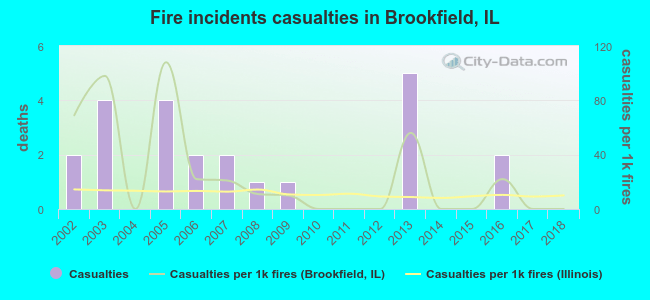 Based on the data from the years 2002 - 2018 the average number of fire-related casualties per year is 1. The highest number of reported injuries - 5 took place in 2013, and the lowest - 0 in 2004. The data has a declining trend.
The average number of injuries per 1,000 fire incidents is 25. This indicator was the highest - 108 in 2005, and the lowest 0 in 2004. The trend for injuries per 1,000 fire incidents is declining. Compared to the state value the number of casualties per 1,000 fire incidents is higher.
Based on the data from the years 2002 - 2018 the average number of fire-related casualties per year is 1. The highest number of reported injuries - 5 took place in 2013, and the lowest - 0 in 2004. The data has a declining trend.
The average number of injuries per 1,000 fire incidents is 25. This indicator was the highest - 108 in 2005, and the lowest 0 in 2004. The trend for injuries per 1,000 fire incidents is declining. Compared to the state value the number of casualties per 1,000 fire incidents is higher.Casualties per 1,000 incidents in Brookfield, IL compared to nearest cities:
(Note: Based on data for all years, including only cities with at least 500 fire incidents)
| Brookfield: | 19.1 |
| Lyons: | 15.7 |
| Riverside: | 11.7 |
| Broadview: | 17.9 |
| Westchester: | 15.6 |
| Summit: | 14.3 |
| Stickney: | 8.8 |
| Berwyn: | 15.9 |
| Forest Park: | 8.3 |
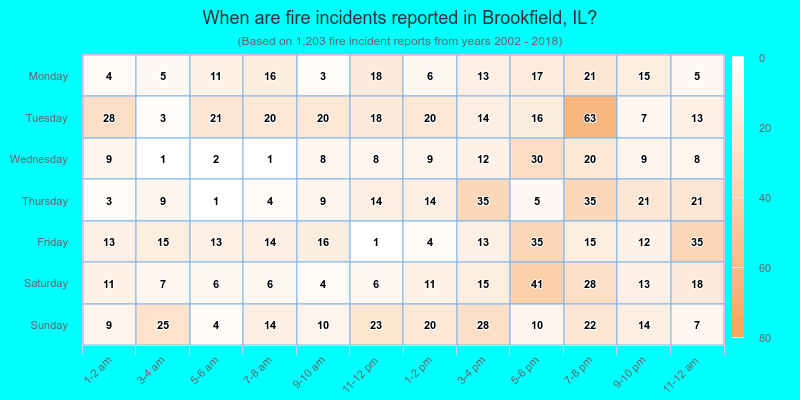
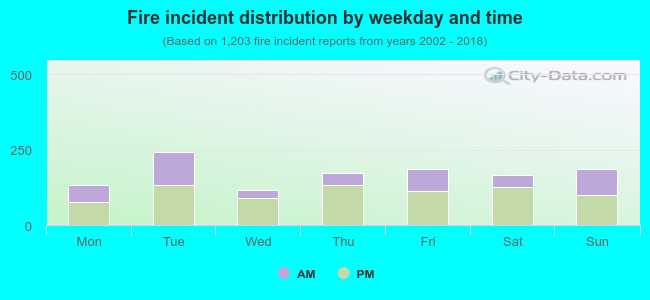 36.0% incidents where reported in the morning and 64.0% in the evening. The most fires (20.2%) took place on Tuesday, and the least (9.7%) on Wednesday.
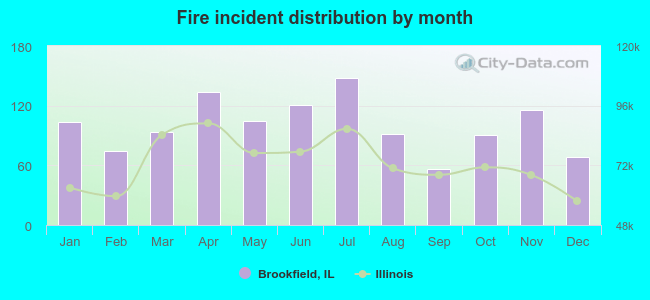 According to the 1,203 incident reports from years 2002 - 2018 most fires (12.3%) took place during July, and the least (4.7%) in September.
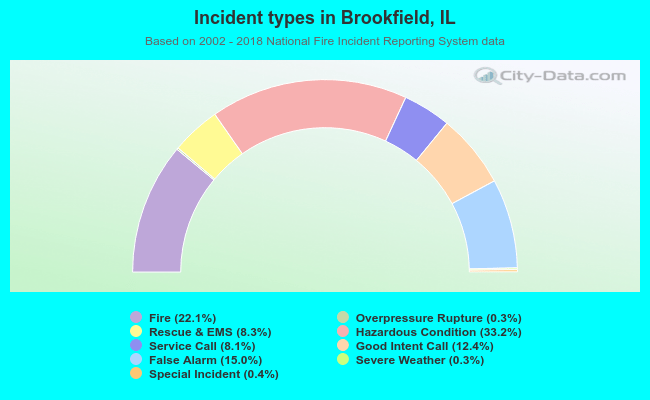 Out of all 5,453 cases reported during the years 2002 - 2018, the most belonged to the categories: Hazardous Condition (33.2%), Fire (22.1%), and False Alarm (15.0%).
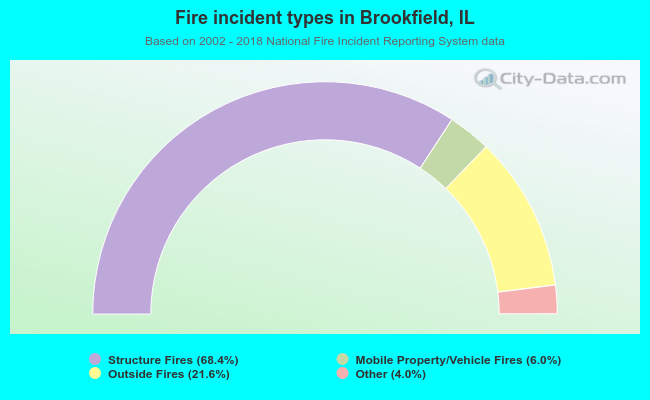 When looking into fire subcategories, the most reports belonged to: Structure Fires (68.4%), and Outside Fires (21.6%).