Conneaut: Fire Incidents, Ohio (OH)
Where are fire incidents reported in Conneaut, OH
Something went wrong! Please refresh the page.
| Fire incidents reported | |
|---|---|
| Sreet name | Count |
| MAIN ST | 132 |
| MAIN RD W AKA US RT 20 | 128 |
| CENTER RD | 104 |
| HARBOR ST | 74 |
| MAIN RD E AKA US RT 20 | 70 |
| BROAD ST | 62 |
| FURNACE RD | 60 |
| LAKE RD | 54 |
| CHESTNUT ST | 52 |
| LIBERTY ST | 50 |
| MIDDLE RD | 50 |
| MADISON ST | 46 |
| STATE STREET AKA US RT 20 | 46 |
| GORE RD | 44 |
| I 90 | 44 |
| PARRISH RD | 42 |
| SANDUSKY ST | 40 |
| CENTER ST | 36 |
| MILL ST | 36 |
| HILLDOM RD | 30 |
| ADAMS RD | 28 |
| BUFFALO ST | 28 |
| CHAMBERLAIN BLVD | 28 |
| UNDERRIDGE RD | 28 |
| ROOT RD | 26 |
| CLARK ST | 20 |
| NAYLOR DR | 20 |
| DAYS BLVD | 18 |
| SOUTH RIDGE RD | 18 |
| WHITNEY ST | 18 |
2003 - 2018 National Fire Incident Reporting System (NFIRS) incidents
- Incident types reported to NFIRS in Conneaut, OH
- 6,84558.0%Rescue & EMS
- 1,35711.5%Hazardous Condition
- 1,32911.3%Service Call
- 1,23810.5%Fire
- 5384.6%False Alarm
- 3493.0%Good Intent Call
- 1171.0%Severe Weather
- 180.2%Overpressure Rupture
- Fire incident types reported to NFIRS in Conneaut, OH
- 61549.7%Outside Fires
- 50640.9%Structure Fires
- 1159.3%Mobile Property/Vehicle Fires
- 20.2%Other
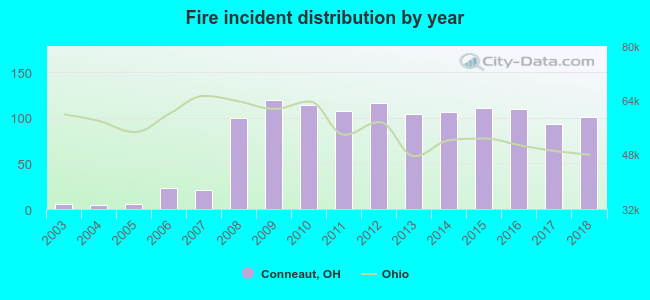 According to the data from the years 2003 - 2018 the average number of fires per year is 77. The highest number of reported fires - 119 took place in 2009, and the least - 4 in 2004. The data has a rising trend.
The average number of yearly fire incidents per 10k residents in Conneaut, OH compared to nearest cities:
(Note: Based on data for the last 3 years, including only cities with population 5,000 and above)
| Conneaut: | 78.8 |
| Ashtabula: | 98.7 |
| Geneva: | 92.7 |
| North Madison: | 1.2 |
| Painesville: | 54.8 |
| Chardon: | 147.8 |
| Cortland: | 120.2 |
| Mentor: | 21.3 |
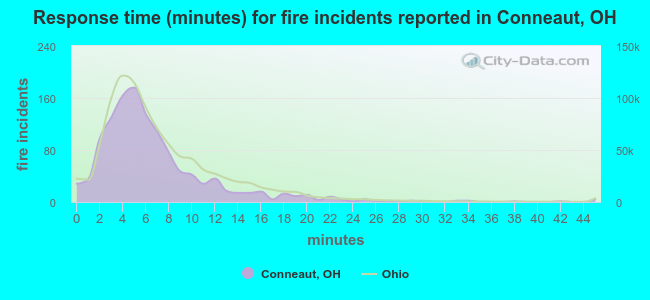 The median response time based on all reported fire incidents is 5 minutes. This is lower than the Ohio median value.
The median response time in Conneaut, OH compared to nearest cities:
(Note: Based on data for all years, including only cities with at least 500 fire incidents)
| Conneaut: | 5 minutes |
| Ashtabula: | 6 minutes |
| Jefferson: | 10 minutes |
| Geneva: | 7 minutes |
| Andover: | 10 minutes |
| Madison: | 7 minutes |
| Perry: | 6 minutes |
| Painesville: | 5 minutes |
| Chardon: | 7 minutes |
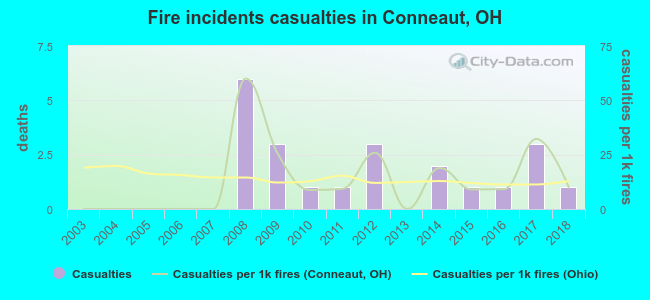 According to the reports from the years 2003 - 2018 the average number of fire-related casualties per year is 1. The highest number of reported injuries - 6 took place in 2008, and the lowest - 0 in 2003. The data has a rising trend.
The average number of casualties per 1,000 fire incidents is 13. This indicator was the highest - 60 in 2008, and the lowest 0 in 2003. The trend for casualties per 1,000 fires is increasing. Compared to the Ohio value the number of injuries per 1,000 fires is higher.
According to the reports from the years 2003 - 2018 the average number of fire-related casualties per year is 1. The highest number of reported injuries - 6 took place in 2008, and the lowest - 0 in 2003. The data has a rising trend.
The average number of casualties per 1,000 fire incidents is 13. This indicator was the highest - 60 in 2008, and the lowest 0 in 2003. The trend for casualties per 1,000 fires is increasing. Compared to the Ohio value the number of injuries per 1,000 fires is higher.
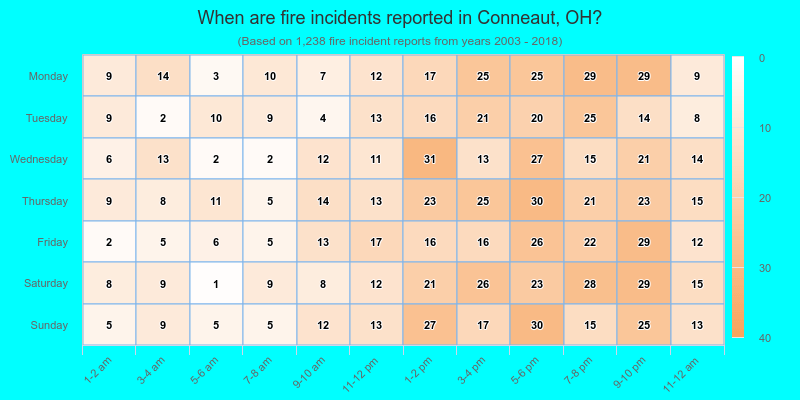
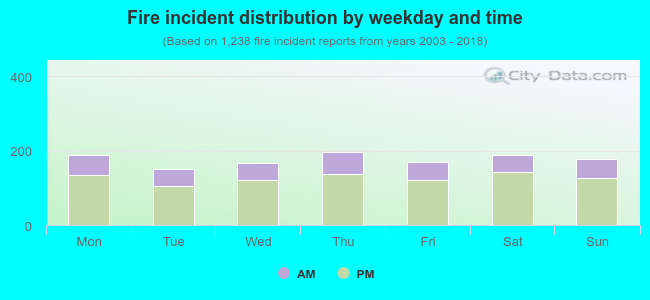 28.4% incidents where reported in the morning and 71.6% in the evening. The most fires (15.9%) took place on Thursday, and the least (12.2%) on Tuesday.
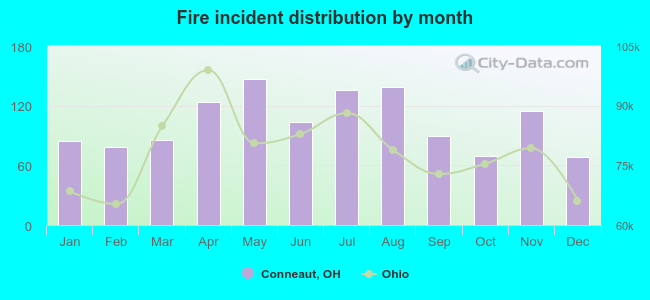 According to the 1,238 incident reports from years 2003 - 2018 most fires (11.9%) took place during May, and the least (5.5%) in December.
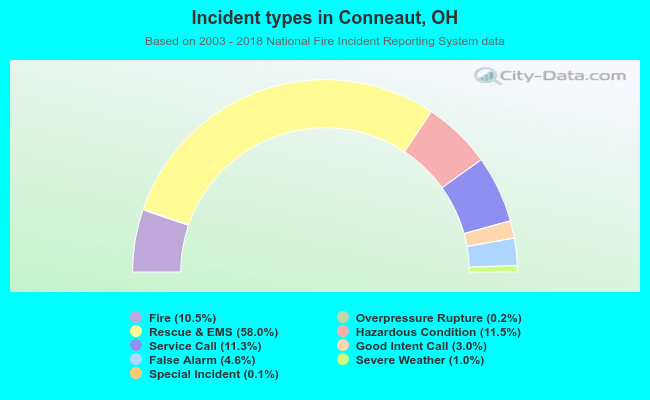 Out of all 11,799 cases reported during the years 2003 - 2018, the most belonged to the categories: Rescue & EMS (58.0%), Hazardous Condition (11.5%), and Service Call (11.3%).
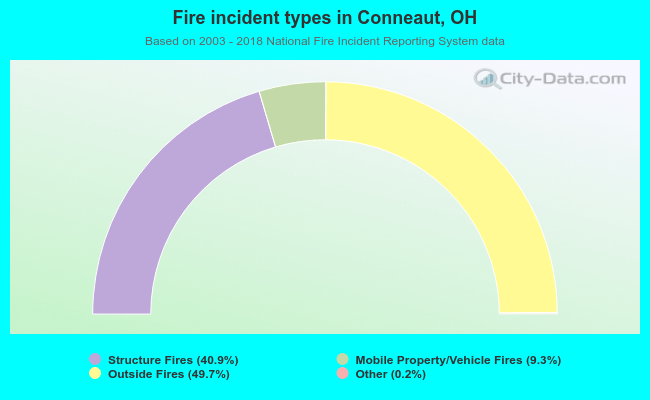 When looking into fire subcategories, the most incidents belonged to: Outside Fires (49.7%), and Structure Fires (40.9%).