Gridley: Fire Incidents, California (CA)
Where are fire incidents reported in Gridley, CA
Something went wrong! Please refresh the page.
|
| |||||||||||||||||||||||||||||||||||||||||||||||||||||||||||||||||||||||||||||||||||||||||||||||||||||||||||||
| Other | 34 | |||||||||||||||||||||||||||||||||||||||||||||||||||||||||||||||||||||||||||||||||||||||||||||||||||||||||||||
2003 - 2018 National Fire Incident Reporting System (NFIRS) incidents
- Incident types reported to NFIRS in Gridley, CA
- 70556.9%Rescue & EMS
- 23218.7%Fire
- 816.5%Service Call
- 786.3%Hazardous Condition
- 635.1%Good Intent Call
- 625.0%False Alarm
- 171.4%Special Incident
- Fire incident types reported to NFIRS in Gridley, CA
- 11549.6%Outside Fires
- 8235.3%Structure Fires
- 2611.2%Mobile Property/Vehicle Fires
- 93.9%Other
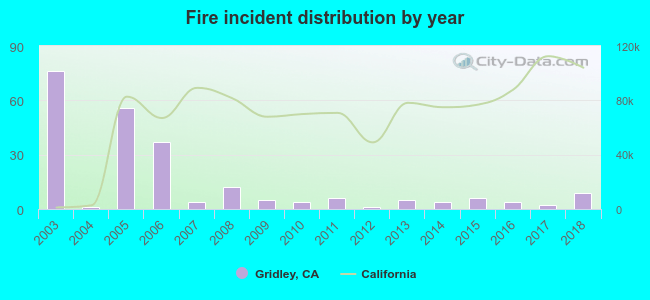 According to the data from the years 2003 - 2018 the average number of fires per year is 15. The highest number of fires - 76 took place in 2003, and the least - 1 in 2004. The data has a declining trend.
The average number of yearly fire incidents per 10k residents in Gridley, CA compared to nearest cities:
(Note: Based on data for the last 3 years, including only cities with population 5,000 and above)
| Gridley: | 7.6 |
| Palermo: | 78.7 |
| Thermalito: | 30.6 |
| Oroville: | 7.8 |
| Marysville: | 100.8 |
| Yuba City: | 39.0 |
| Linda: | 2.8 |
| Colusa: | 101.5 |
| Durham: | 19.9 |
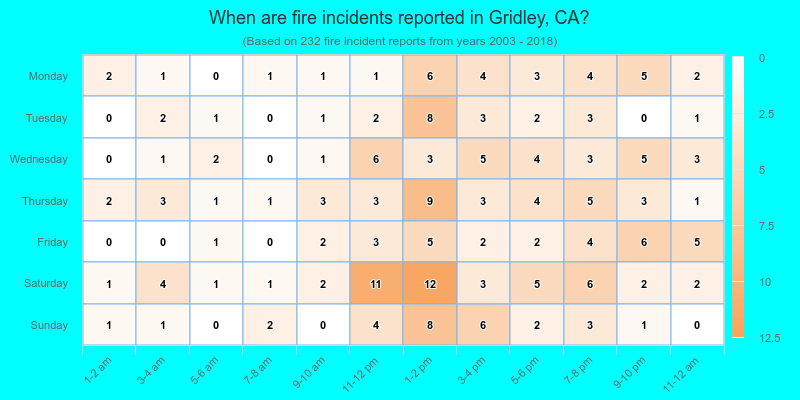
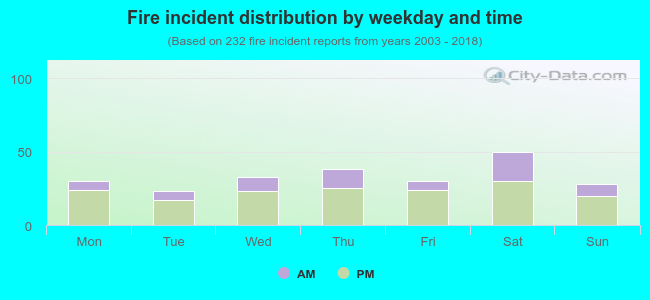 29.7% incidents where reported in the morning and 70.3% in the evening. The most fires (21.6%) took place on Saturday, and the least (9.9%) on Tuesday.
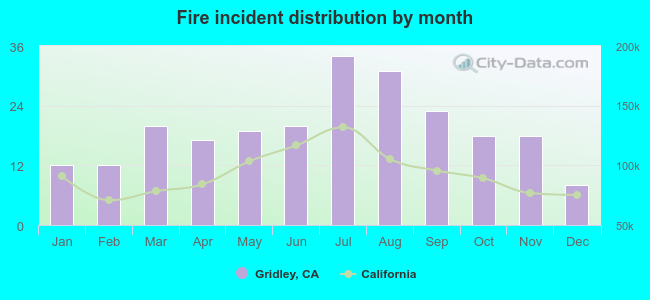 According to the 232 fires from years 2003 - 2018 most fires (14.7%) took place during July, and the least (3.4%) in December.
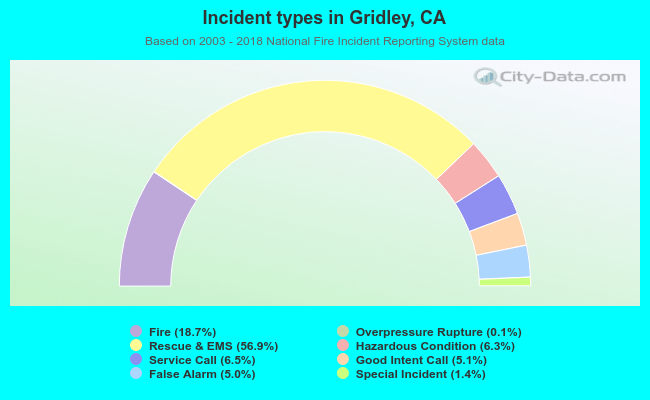 Out of all 1,239 cases reported during the years 2003 - 2018, the most belonged to the categories: Rescue & EMS (56.9%), Fire (18.7%), and Service Call (6.5%).
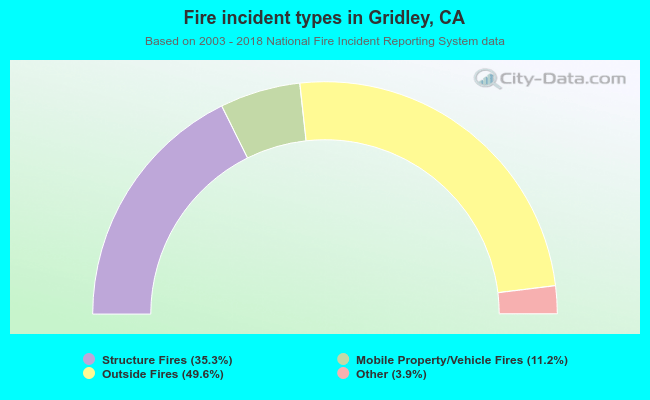 When looking into fire subcategories, the most incidents belonged to: Outside Fires (49.6%), and Structure Fires (35.3%).