Jasper: Fire Incidents, Texas (TX)
Where are fire incidents reported in Jasper, TX
Something went wrong! Please refresh the page.
| Fire incidents reported | |
|---|---|
| Sreet name | Count |
| GIBSON ST | 226 |
| HWY 96 | 188 |
| WHEELER ST | 176 |
| HWY 190 | 164 |
| FM 777 | 110 |
| HWY 63 | 108 |
| BOWIE ST | 82 |
| FM 252 | 68 |
| MAIN ST | 60 |
| MARTIN LUTHER KING JR BLVD | 60 |
| HOUSTON ST | 54 |
| POLLARD ST | 46 |
| FM 2799 | 44 |
| BEVIL LOOP RD | 42 |
| ROUTE 2 | 42 |
| 190 HWY | 38 |
| CR 138 | 34 |
| FM 776 | 34 |
| ROUTE 1 | 34 |
| FM 2800 | 32 |
| CR 296 | 30 |
| FRED ST | 30 |
| ROUTE 5 | 30 |
| CALDWELL ST | 28 |
| NELSON ST | 28 |
| LELA ST | 26 |
| ROUTE 4 | 26 |
| FLETCHER ST | 24 |
| SUNCREST CIR | 24 |
| FM 1747 | 22 |
| Other | 758 |
2002 - 2018 National Fire Incident Reporting System (NFIRS) incidents
- Incident types reported to NFIRS in Jasper, TX
- 2,66864.5%Fire
- 57714.0%Hazardous Condition
- 3608.7%Good Intent Call
- 2606.3%Rescue & EMS
- 1764.3%False Alarm
- 511.2%Service Call
- 250.6%Special Incident
- 120.3%Overpressure Rupture
- 50.1%Severe Weather
- Fire incident types reported to NFIRS in Jasper, TX
- 1,38351.8%Outside Fires
- 85031.9%Structure Fires
- 30911.6%Mobile Property/Vehicle Fires
- 1264.7%Other
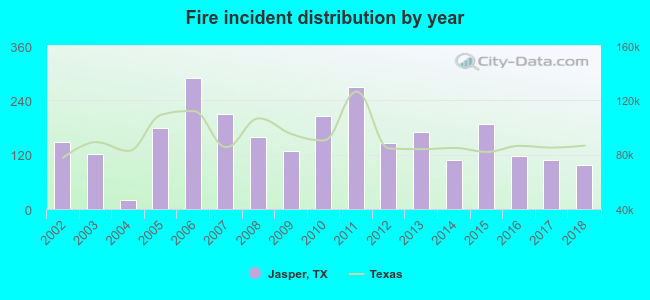 According to the data from the years 2002 - 2018 the average number of fires per year is 157. The highest number of reported fires - 290 took place in 2006, and the least - 19 in 2004. The data has a decreasing trend.
The average number of yearly fire incidents per 10k residents in Jasper, TX compared to nearest cities:
(Note: Based on data for the last 3 years, including only cities with population 5,000 and above)
| Jasper: | 141.9 |
| Spurger: | 23.3 |
| Silsbee: | 174.8 |
| Lumberton: | 3.5 |
| Diboll: | 1.9 |
| Lufkin: | 50.6 |
| Vidor: | 261.3 |
| Livingston: | 316.0 |
| Orange: | 82.5 |
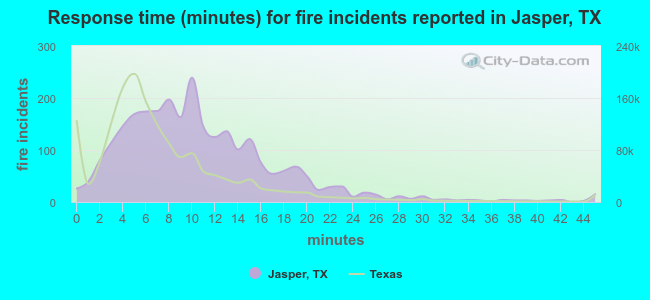 The median response time based on all reported fire incidents is 10 minutes. This is higher compared to the state median value.
The median response time in Jasper, TX compared to nearest cities:
(Note: Based on data for all years, including only cities with at least 500 fire incidents)
| Jasper: | 10 minutes |
| Kirbyville: | 9 minutes |
| Woodville: | 9 minutes |
| Silsbee: | 5 minutes |
| Kountze: | 7 minutes |
| San Augustine: | 10 minutes |
| Leesville: | 8 minutes |
| DeQuincy: | 9 minutes |
| Lumberton: | 8 minutes |
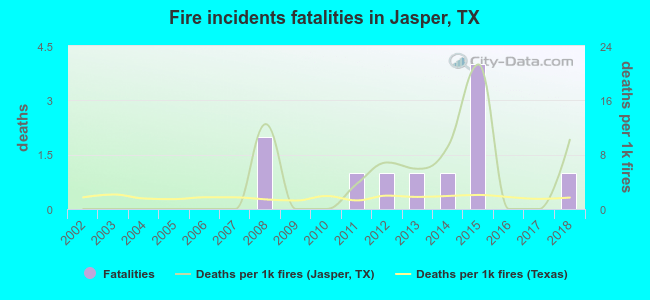 According to the data from the years 2002 - 2018 the average number of fire-related yearly deaths is 1. The highest number of reported deaths - 4 took place in 2015, and the lowest - 0 in 2002. The data has a growing trend.
The average number of deaths per 1,000 fire incidents is 4. This indicator was the highest - 21 in 2015, and the lowest 0 in 2002. The trend for deaths per 1,000 fires is rising. Compared to the Texas value the number of deaths per 1,000 fire incidents is much higher.
According to the data from the years 2002 - 2018 the average number of fire-related yearly deaths is 1. The highest number of reported deaths - 4 took place in 2015, and the lowest - 0 in 2002. The data has a growing trend.
The average number of deaths per 1,000 fire incidents is 4. This indicator was the highest - 21 in 2015, and the lowest 0 in 2002. The trend for deaths per 1,000 fires is rising. Compared to the Texas value the number of deaths per 1,000 fire incidents is much higher.
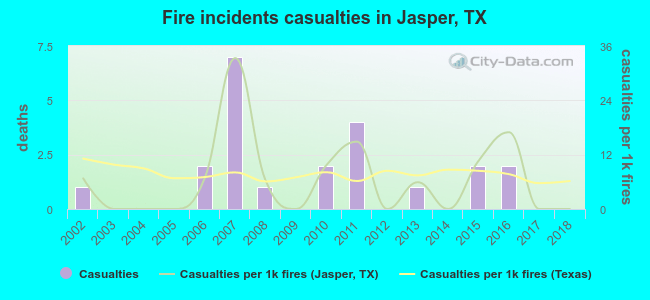 According to the reports from the years 2002 - 2018 the average number of fire-related casualties per year is 1. The highest number of casualties - 7 took place in 2007, and the lowest - 0 in 2003. The data has a decreasing trend.
The average number of casualties per 1,000 fires is 7. This indicator was the highest - 33 in 2007, and the lowest 0 in 2003. The trend for casualties per 1,000 fires is dropping. Compared to the state value the number of casualties per 1,000 fire incidents is similar.
According to the reports from the years 2002 - 2018 the average number of fire-related casualties per year is 1. The highest number of casualties - 7 took place in 2007, and the lowest - 0 in 2003. The data has a decreasing trend.
The average number of casualties per 1,000 fires is 7. This indicator was the highest - 33 in 2007, and the lowest 0 in 2003. The trend for casualties per 1,000 fires is dropping. Compared to the state value the number of casualties per 1,000 fire incidents is similar.Casualties per 1,000 incidents in Jasper, TX compared to nearest cities:
(Note: Based on data for all years, including only cities with at least 500 fire incidents)
| Jasper: | 8.2 |
| Kirbyville: | 0.0 |
| Woodville: | 2.2 |
| Silsbee: | 1.4 |
| Kountze: | 5.4 |
| San Augustine: | 1.2 |
| Leesville: | 1.6 |
| DeQuincy: | 9.2 |
| Lumberton: | 1.5 |
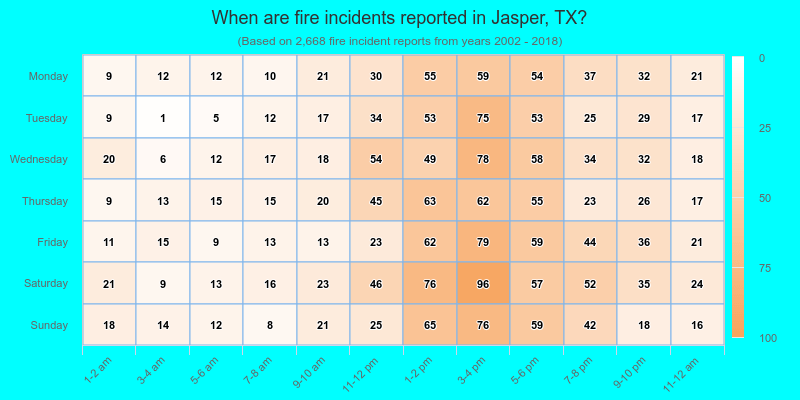
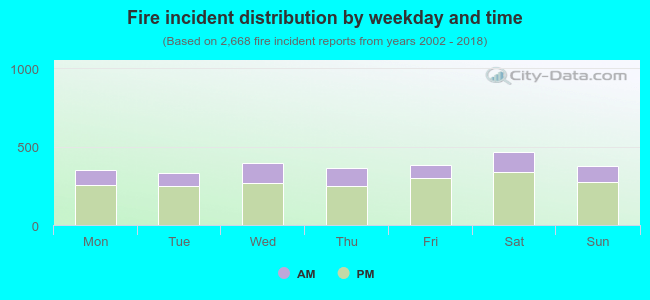 27.2% incidents where reported in the morning and 72.8% in the evening. The most fires (17.5%) took place on Saturday, and the least (12.4%) on Tuesday.
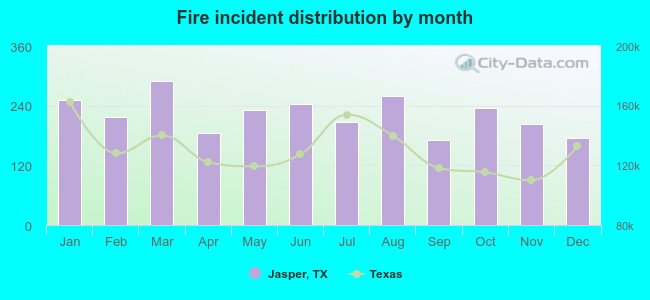 Based on the 2,668 fire incident reports from years 2002 - 2018 most fires (10.9%) took place during March, and the least (6.4%) in September.
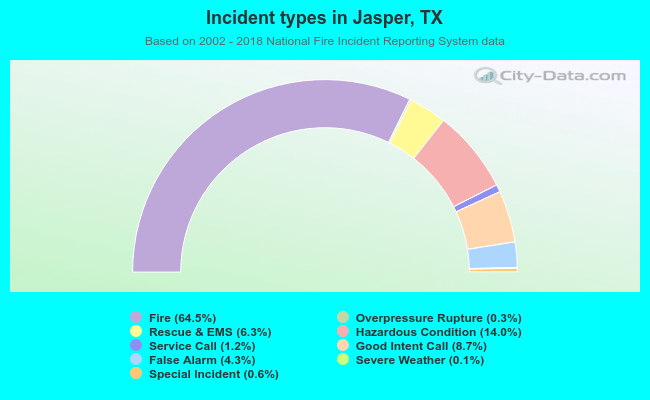 Out of all 4,134 cases reported during the years 2002 - 2018, the most belonged to the categories: Fire (64.5%), Hazardous Condition (14.0%), and Good Intent Call (8.7%).
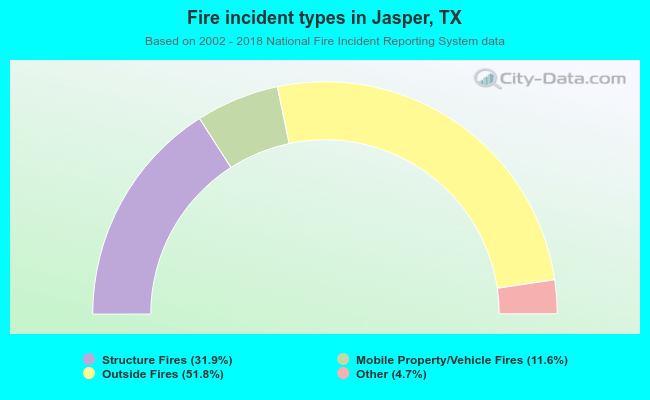 When looking into fire subcategories, the most reports belonged to: Outside Fires (51.8%), and Structure Fires (31.9%).