Parsons: Fire Incidents, Tennessee (TN)
Where are fire incidents reported in Parsons, TN
Something went wrong! Please refresh the page.
|
| |||||||||||||||||||||||||||||||||||||||||||||||||||||||||||||||||||||||||||||||||||||||||||||||||||||||||||||
| Other | 86 | |||||||||||||||||||||||||||||||||||||||||||||||||||||||||||||||||||||||||||||||||||||||||||||||||||||||||||||
2004 - 2018 National Fire Incident Reporting System (NFIRS) incidents
- Incident types reported to NFIRS in Parsons, TN
- 53469.8%Fire
- 12015.7%Hazardous Condition
- 405.2%False Alarm
- 243.1%Rescue & EMS
- 202.6%Service Call
- 202.6%Good Intent Call
- 70.9%Overpressure Rupture
- Fire incident types reported to NFIRS in Parsons, TN
- 23644.2%Structure Fires
- 19135.8%Outside Fires
- 8716.3%Mobile Property/Vehicle Fires
- 203.7%Other
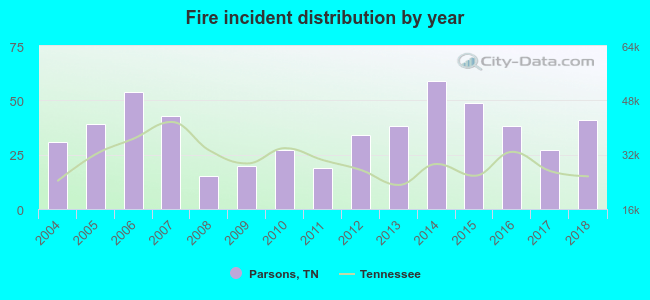 According to the data from the years 2004 - 2018 the average number of fire incidents per year is 36. The highest number of reported fires - 59 took place in 2014, and the least - 15 in 2008. The data has a growing trend.
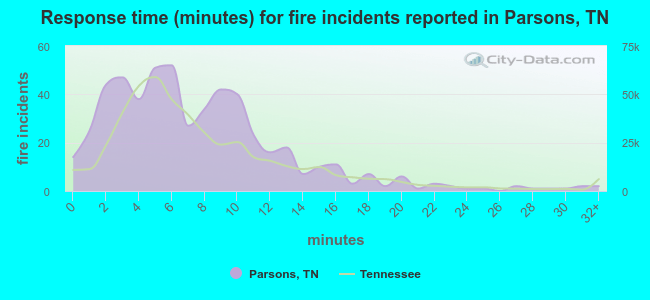 The median response time based on all reported fire incidents is 6 minutes. This is comparable to the Tennessee median value.
The median response time in Parsons, TN compared to nearest cities:
(Note: Based on data for all years, including only cities with at least 500 fire incidents)
| Parsons: | 6 minutes |
| Lexington: | 4 minutes |
| Camden: | 8 minutes |
| Huntingdon: | 7 minutes |
| Savannah: | 8 minutes |
| Waynesboro: | 15 minutes |
| Henderson: | 6 minutes |
| Hohenwald: | 7 minutes |
| Waverly: | 11 minutes |
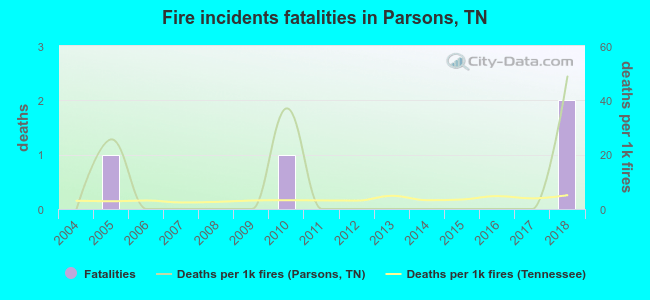 According to the data from the years 2004 - 2018 the average number of fire-related fatalities per year is 0. The highest number of deaths - 2 took place in 2018, and the lowest - 0 in 2004. The data has a growing trend.
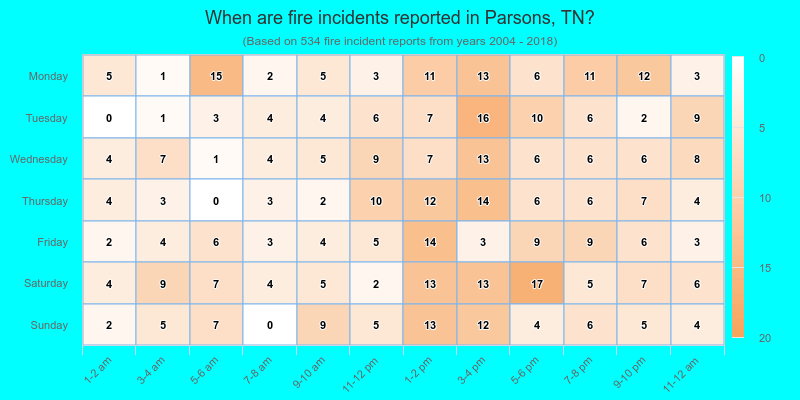
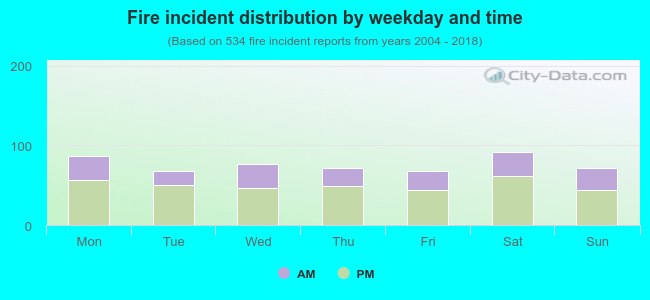 34.5% incidents where reported in the morning and 65.5% in the evening. The most fires (17.2%) took place on Saturday, and the least (12.7%) on Tuesday.
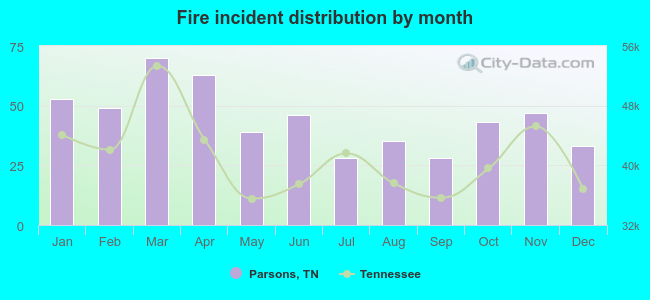 According to the 534 reports from years 2004 - 2018 most fires (13.1%) took place during March, and the least (5.2%) in July.
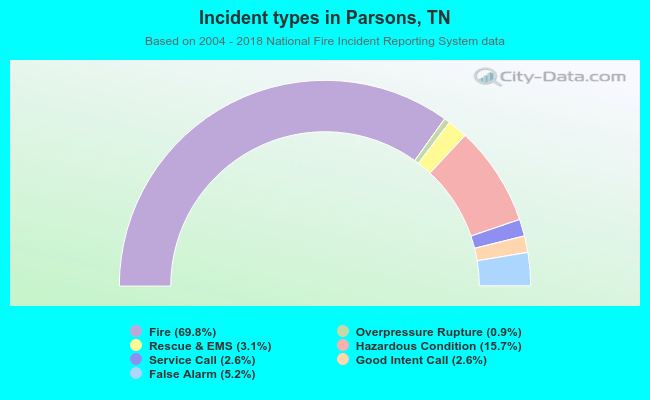 Out of all 765 cases reported during the years 2004 - 2018, the most belonged to the categories: Fire (69.8%), Hazardous Condition (15.7%), and False Alarm (5.2%).
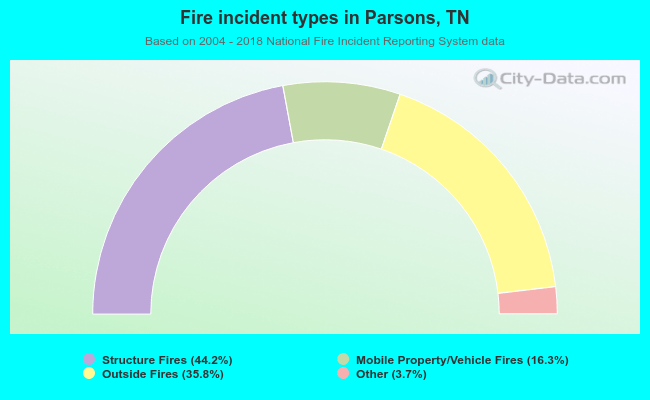 When looking into fire subcategories, the most reports belonged to: Structure Fires (44.2%), and Outside Fires (35.8%).