Patterson: Fire Incidents, California (CA)
Where are fire incidents reported in Patterson, CA
Something went wrong! Please refresh the page.
|
| |||||||||||||||||||||||||||||||||||||||||||||||||||||||||||||||||||||||||||||||||||||||||||||||||||||||||||||
2006 - 2018 National Fire Incident Reporting System (NFIRS) incidents
- Incident types reported to NFIRS in Patterson, CA
- 3,97466.6%Rescue & EMS
- 67611.3%Fire
- 3355.6%Good Intent Call
- 3315.5%Service Call
- 3145.3%False Alarm
- 2975.0%Hazardous Condition
- 330.6%Special Incident
- Fire incident types reported to NFIRS in Patterson, CA
- 33249.1%Outside Fires
- 21932.4%Structure Fires
- 7911.7%Mobile Property/Vehicle Fires
- 466.8%Other
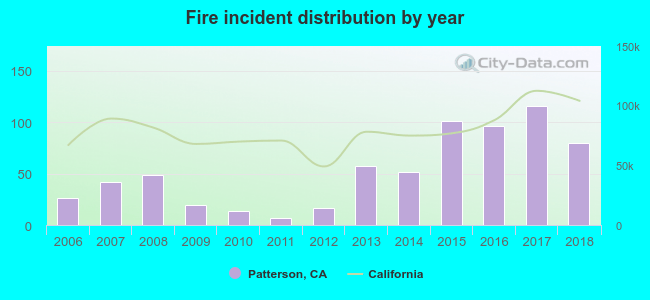 According to the data from the years 2006 - 2018 the average number of fires per year is 52. The highest number of fire incidents - 116 took place in 2017, and the least - 7 in 2011. The data has a rising trend.
The average number of yearly fire incidents per 10k residents in Patterson, CA compared to nearest cities:
(Note: Based on data for the last 3 years, including only cities with population 5,000 and above)
| Patterson: | 45.9 |
| Newman: | 19.8 |
| Ceres: | 36.3 |
| Keyes: | 22.3 |
| Modesto: | 68.9 |
| Turlock: | 16.4 |
| Salida: | 6.6 |
| Gustine: | 45.7 |
| Hughson: | 25.4 |
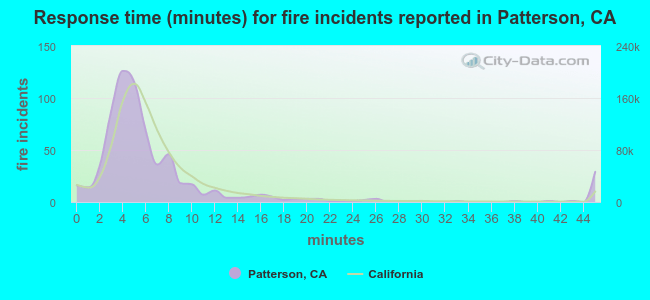 The median response time based on all reported fire incidents is 5 minutes. This is lower compared to the state median value.
The median response time in Patterson, CA compared to nearest cities:
(Note: Based on data for all years, including only cities with at least 500 fire incidents)
| Patterson: | 5 minutes |
| Ceres: | 5 minutes |
| Modesto: | 5 minutes |
| Turlock: | 5 minutes |
| Ripon: | 6 minutes |
| Delhi: | 7 minutes |
| Riverbank: | 6 minutes |
| Manteca: | 5 minutes |
| Tracy: | 7 minutes |
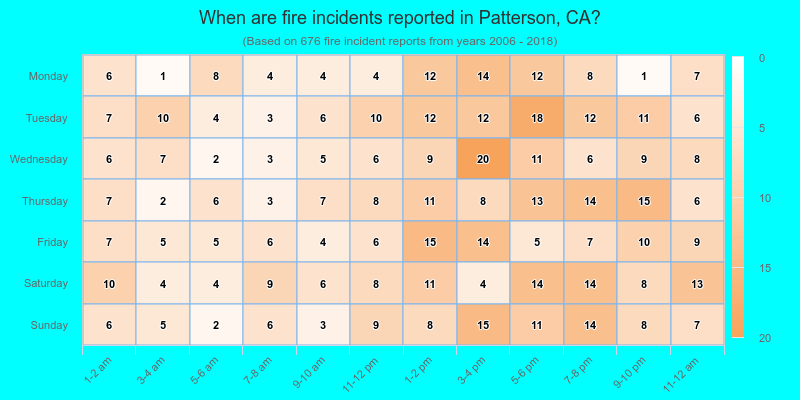
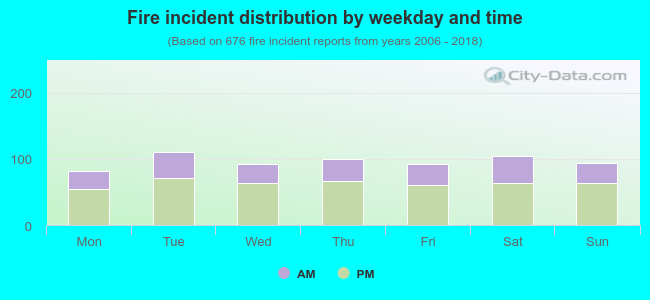 34.6% incidents where reported in the morning and 65.4% in the evening. The most fires (16.4%) took place on Tuesday, and the least (12.0%) on Monday.
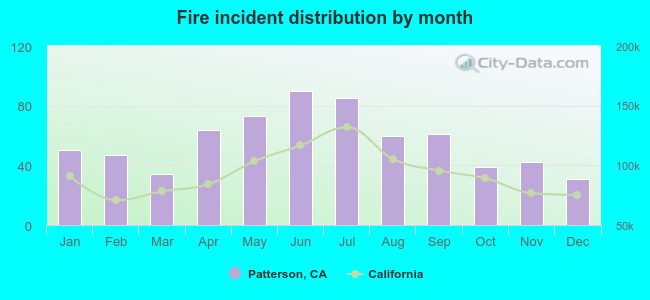 According to the 676 fire incidents from years 2006 - 2018 most fires (13.3%) took place during June, and the least (4.6%) in December.
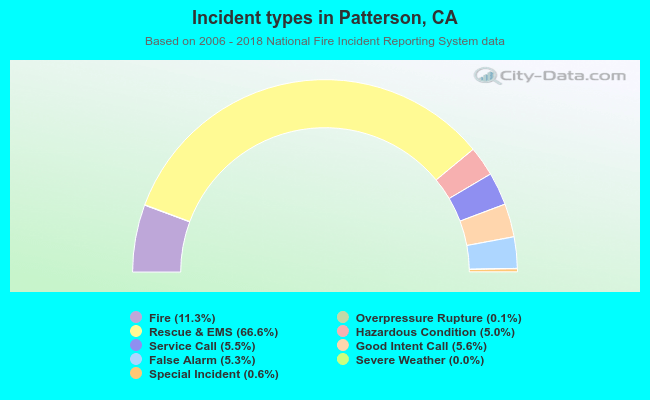 Out of all 5,966 cases reported during the years 2006 - 2018, the most belonged to the categories: Rescue & EMS (66.6%), Fire (11.3%), and Good Intent Call (5.6%).
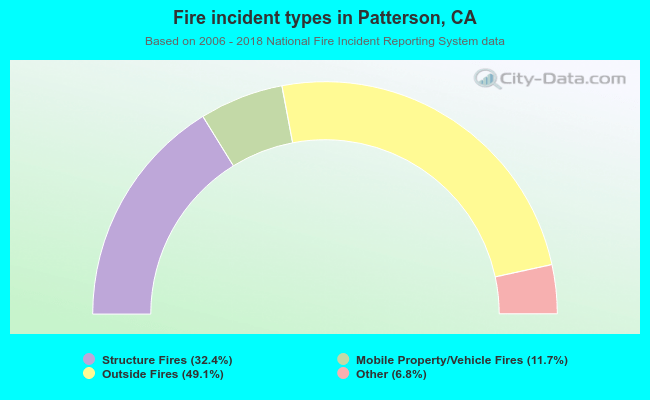 When looking into fire subcategories, the most reports belonged to: Outside Fires (49.1%), and Structure Fires (32.4%).