Percentage of residents living in poverty in 2022: 7.8%
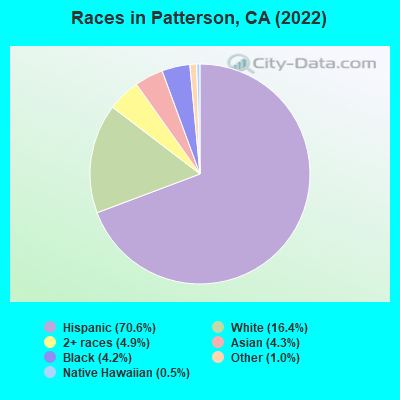
(6.9% for White Non-Hispanic residents, 5.6% for Black residents, 8.8% for Hispanic or Latino residents, 0.5% for American Indian residents, 25.0% for Native Hawaiian and other Pacific Islander residents, 6.6% for other race residents, 8.7% for two or more races residents)
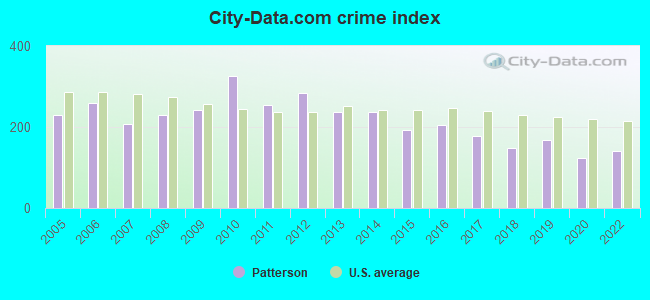
The City-Data.com crime index weighs serious crimes and violent crimes more heavily. Higher means more crime, U.S. average is 246.1. It adjusts for the number of visitors and daily workers commuting into cities.
Latest news from Patterson, CA collected exclusively by city-data.com from local newspapers, TV, and radio stations
Ancestries: Portuguese (3.3%), American (2.9%), Nigerian (2.7%), European (1.7%), German (1.5%).
Current Local Time: PST time zone
Elevation: 97 feet
Land area: 2.87 square miles.
Population density: 8,291 people per square mile (high).
5,868 residents are foreign born (19.6% Latin America).
This city:
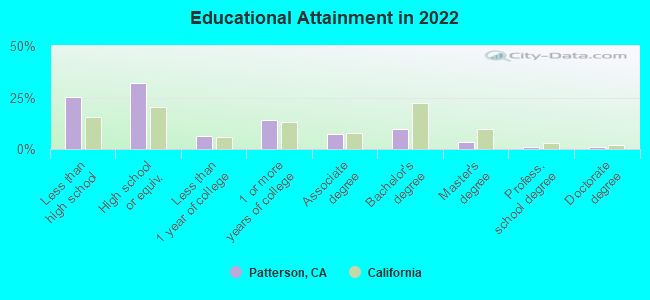
24.8%
California:
26.5%
Median real estate property taxes paid for housing units with mortgages in 2022: $5,356 (1.1%) Median real estate property taxes paid for housing units with no mortgage in 2022: $3,028 (0.6%)
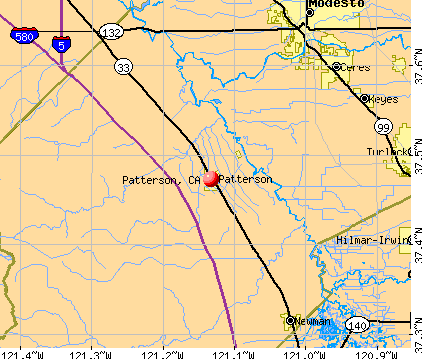
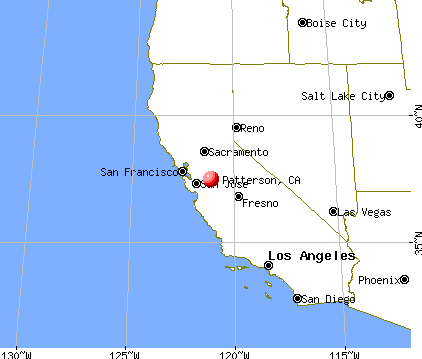
Nearest city with pop. 50,000+: Modesto, CA (15.1 miles , pop. 188,856).
Nearest city with pop. 200,000+: Stockton, CA (36.0 miles , pop. 243,771).
Nearest city with pop. 1,000,000+: Los Angeles, CA (280.7 miles , pop. 3,694,820).
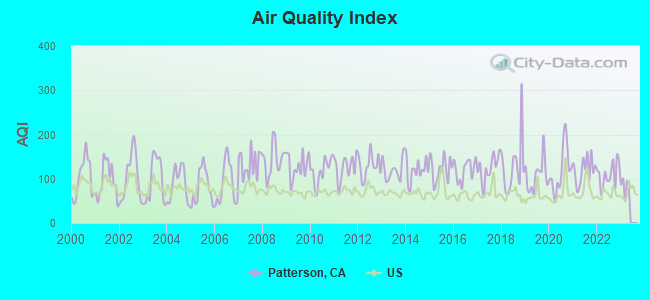
Air Quality Index (AQI) level in 2022 was 110. This is significantly worse than average.
City:
110
U.S.:
73
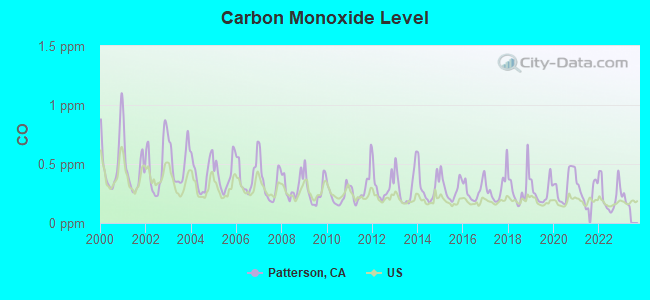
Carbon Monoxide (CO) [ppm] level in 2022 was 0.234. This is about average.Closest monitor was 7.1 miles away from the city center.
City:
0.234
U.S.:
0.251
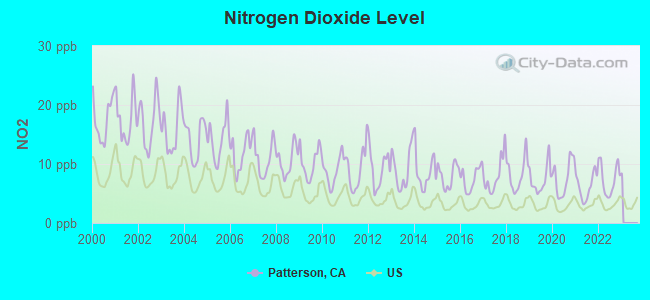
Nitrogen Dioxide (NO2) [ppb] level in 2022 was 7.41. This is significantly worse than average.Closest monitor was 7.1 miles away from the city center.
City:
7.41
U.S.:
5.11
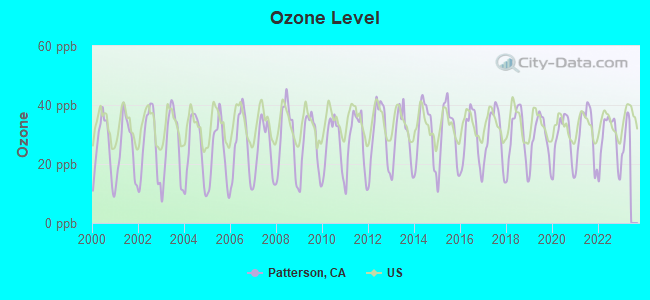
Ozone [ppb] level in 2022 was 28.2. This is about average.Closest monitor was 7.1 miles away from the city center.
City:
28.2
U.S.:
33.3
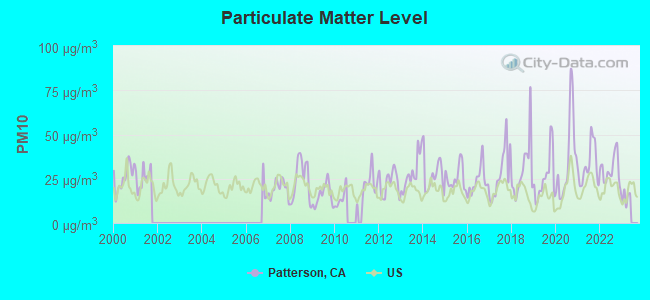
Particulate Matter (PM10) [µg/m3] level in 2022 was 30.0. This is significantly worse than average.Closest monitor was 7.1 miles away from the city center.
City:
30.0
U.S.:
19.2
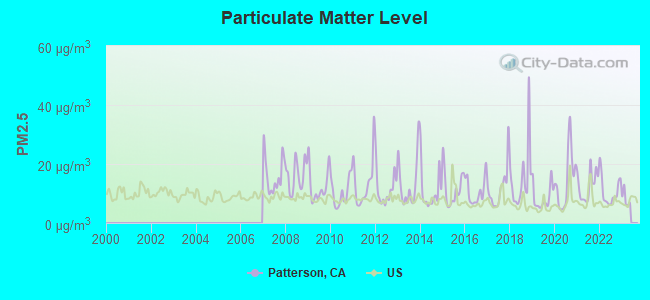
Particulate Matter (PM2.5) [µg/m3] level in 2022 was 10.8. This is worse than average.Closest monitor was 14.0 miles away from the city center.
City:
10.8
U.S.:
8.1
Earthquake activity:
Patterson-area historical earthquake activity is significantly above California state average. It is 8102% greater than the overall U.S. average.
On 4/18/1906 at 13:12:21, a magnitude 7.9 (7.9 UK, Class: Major, Intensity: VIII - XII) earthquake occurred 108.4 miles away from Patterson center, causing $524,000,000 total damage On 10/18/1989 at 00:04:15, a magnitude 7.1 (6.5 MB, 7.1 MS, 6.9 MW, 7.0 ML) earthquake occurred 43.1 miles away from Patterson center, causing 62 deaths (62 shaking deaths) and 3757 injuries, causing $1,305,032,704 total damage On 7/21/1952 at 11:52:14, a magnitude 7.7 (7.7 UK) earthquake occurred 208.4 miles away from Patterson center, causing $50,000,000 total damage On 11/4/1927 at 13:51:53, a magnitude 7.5 (7.5 UK) earthquake occurred 177.0 miles away from the city center On 12/21/1932 at 06:10:09, a magnitude 7.2 (7.2 UK) earthquake occurred 181.0 miles away from Patterson center On 10/3/1915 at 06:52:48, a magnitude 7.6 (7.6 UK) earthquake occurred 286.3 miles away from the city center Magnitude types: body-wave magnitude (MB), local magnitude (ML), surface-wave magnitude (MS), moment magnitude (MW)
Natural disasters:
The number of natural disasters in Stanislaus County (13) is near the US average (15). Major Disasters (Presidential) Declared: 8 Emergencies Declared: 2
Causes of natural disasters: Floods: 8, Storms: 4, Winter Storms: 3, Landslides: 2, Mudslides: 2, Drought: 1, Fire: 1, Freeze: 1, Heavy Rain: 1, Hurricane: 1, Tornado: 1, Other: 1 (Note: some incidents may be assigned to more than one category).
Hospitals and medical centers in Patterson:
DEL PUERTO HOSPITAL - D/P SNF (821 E STREET)
Other hospitals and medical centers near Patterson:
SAN LUIS CARE CENTER (Nursing Home, about 13 miles away; NEWMAN, CA)
HA-LE ALOHA CONVALESCENT HOSPITAL (Nursing Home, about 13 miles away; CERES, CA)
RENO AVE CONV HOSP (Nursing Home, about 14 miles away; MODESTO, CA)
SATELLITE DIALYSIS - CENTRAL MODESTO (Dialysis Facility, about 14 miles away; MODESTO, CA)
GLOBAL HEALTHCARE SERVICES, LLC (Home Health Center, about 14 miles away; MODESTO, CA)
CERES DIALYSIS CENTER (Dialysis Facility, about 15 miles away; CERES, CA)
KINDRED HOSPITAL MODESTO (Hospital, about 15 miles away; MODESTO, CA)
19 miles: MODESTO (1700 HELD DRIVE) . Services: ticket office, fully wheelchair accessible, enclosed waiting area, public restrooms, public payphones, vending machines, free short-term parking, free long-term parking, call for car rental service, call for taxi service, public transit connection.
19 miles: TURLOCK-DENAIR (DENAIR, SANTA FE ST. AT ELM ST.) . Services: fully wheelchair accessible, public payphones, vending machines, free short-term parking, free long-term parking, call for taxi service.
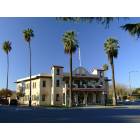
Notable locations in Patterson: Patterson District Ambulance (A), Patterson Fire Department Station 1 (B), West Stanislaus County Fire Protection District Headquarters (C), The Center Building (D), Patterson City Hall (E), Patterson Branch Stanislaus County Free Library (F). Display/hide their locations on the map
Churches in Patterson include: Evangelical Covenant Church (A), Federated Methodist-Presbyterian Church (B), First Assembly of God Church (C), First Baptist Church (D), Our Saviours Lutheran Church (E), Sacred Heart Catholic Church (F). Display/hide their locations on the map
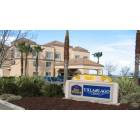
Hotel: Best Western Villa Del Lago In (2959 Speno Drive).
Birthplace of: Amy Franceschini - Designer.
Stanislaus County has a predicted average indoor radon screening level less than 2 pCi/L (pico curies per liter) - Low Potential
Drinking water stations with addresses in Patterson and their reported violations in the past:
BUEHNER WATER SYSTEM (Population served: 150, Groundwater):
Past health violations:
MCL, Monthly (TCR) - In NOV-2011, Contaminant: Coliform. Follow-up actions: St Violation/Reminder Notice (NOV-18-2011), St Public Notif requested (NOV-18-2011)
MCL, Monthly (TCR) - In DEC-2010, Contaminant: Coliform. Follow-up actions: St Violation/Reminder Notice (DEC-23-2010), St Public Notif requested (DEC-23-2010)
MCL, Monthly (TCR) - In JAN-2010, Contaminant: Coliform. Follow-up actions: St Violation/Reminder Notice (JAN-14-2010), St Public Notif requested (JAN-14-2010)
MCL, Monthly (TCR) - In JAN-2009, Contaminant: Coliform. Follow-up actions: St Public Notif requested (JAN-28-2009), St Violation/Reminder Notice (JAN-28-2009)
MCL, Monthly (TCR) - In JAN-2009, Contaminant: Coliform. Follow-up actions: St Public Notif requested (JAN-28-2009), St Violation/Reminder Notice (JAN-28-2009)
BUEHNER WATER SYSTEM - WEBER COMPLEX (Population served: 100, Groundwater):
Past health violations:
MCL, Monthly (TCR) - In APR-2014, Contaminant: Coliform. Follow-up actions: St AO (w/o penalty) issued (APR-09-2014)
MCL, Monthly (TCR) - In AUG-2012, Contaminant: Coliform. Follow-up actions: St Violation/Reminder Notice (AUG-09-2012)
MCL, Monthly (TCR) - In JUL-2008, Contaminant: Coliform. Follow-up actions: St Violation/Reminder Notice (JUL-25-2008)
MCL, Monthly (TCR) - In JUL-2008, Contaminant: Coliform. Follow-up actions: St Violation/Reminder Notice (JUL-25-2008)
MCL, Monthly (TCR) - In MAY-2005, Contaminant: Coliform. Follow-up actions: St Violation/Reminder Notice (MAY-31-2005)
MCL, Monthly (TCR) - In MAY-2005, Contaminant: Coliform. Follow-up actions: St Violation/Reminder Notice (MAY-31-2005)
NEW HOPE CHURCH OF THE NAZARENE (Population served: 70, Groundwater):
MCL, Average - Between OCT-2013 and DEC-2013, Contaminant: Arsenic. Follow-up actions: St AO (w/o penalty) issued (MAY-01-2013)
MCL, Average - Between JUL-2013 and SEP-2013, Contaminant: Arsenic. Follow-up actions: St AO (w/o penalty) issued (MAY-01-2013)
MCL, Average - Between APR-2013 and JUN-2013, Contaminant: Arsenic. Follow-up actions: St AO (w/o penalty) issued (MAY-01-2013)
MCL, Average - Between JAN-2013 and MAR-2013, Contaminant: Arsenic. Follow-up actions: St AO (w/o penalty) issued (MAY-01-2013)
MCL, Monthly (TCR) - In JUN-2009, Contaminant: Coliform. Follow-up actions: St Violation/Reminder Notice (JUN-25-2009), St Public Notif requested (JUN-25-2009)
MCL, Monthly (TCR) - In JUN-2009, Contaminant: Coliform. Follow-up actions: St Violation/Reminder Notice (JUN-25-2009), St Public Notif requested (JUN-25-2009)
2 other older health violations
Past monitoring violations:
2 minor monitoring violations
Average household size:
This city:
3.6 people
California:
2.9 people
Percentage of family households:
This city:
82.5%
Whole state:
68.7%
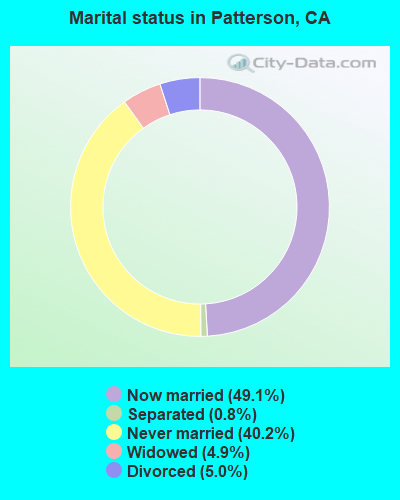
Percentage of households with unmarried partners:
This city:
8.9%
Whole state:
7.2%
Likely homosexual households (counted as self-reported same-sex unmarried-partner households)
Lesbian couples: 0.4% of all households
Gay men: 0.4% of all households
3 people in other noninstitutional facilities in 2010
People in group quarters in Patterson in 2000:
212 people in agriculture workers' dormitories on farms
12 people in other noninstitutional group quarters
3 people in religious group quarters
2 people in other nonhousehold living situations
Banks with branches in Patterson (2011 data):
Wells Fargo Bank, National Association: Patterson Save Mart Branch at 1035 Sperry Ave, branch established on 2007/02/26. Info updated 2011/04/05: Bank assets: $1,161,490.0 mil, Deposits: $905,653.0 mil, headquarters in Sioux Falls, SD, positive income, 6395 total offices, Holding Company: Wells Fargo & Company
Bank of the West: Patterson Branch at 5 Plaza, branch established on 1961/02/27. Info updated 2009/11/16: Bank assets: $62,408.3 mil, Deposits: $43,995.2 mil, headquarters in San Francisco, CA, positive income, 647 total offices, Holding Company: Bnp Paribas
U.S. Bank National Association: Patterson Branch at 13 Plaza Circle, branch established on 1983/03/15. Info updated 2012/01/30: Bank assets: $330,470.8 mil, Deposits: $236,091.5 mil, headquarters in Cincinnati, OH, positive income, 3121 total offices, Holding Company: U.S. Bancorp
Tri Counties Bank: Patterson Branch at 17 Plaza, branch established on 1955/06/27. Info updated 2011/09/26: Bank assets: $2,554.4 mil, Deposits: $2,191.2 mil, headquarters in Chico, CA, positive income, Commercial Lending Specialization, 71 total offices, Holding Company: Trico Bancshares
Oak Valley Community Bank: Patterson Branch at 20 Plaza Circle, branch established on 2005/11/17. Info updated 2006/11/03: Bank assets: $612.4 mil, Deposits: $536.2 mil, headquarters in Oakdale, CA, positive income, Commercial Lending Specialization, 14 total offices, Holding Company: Oak Valley Bancorp
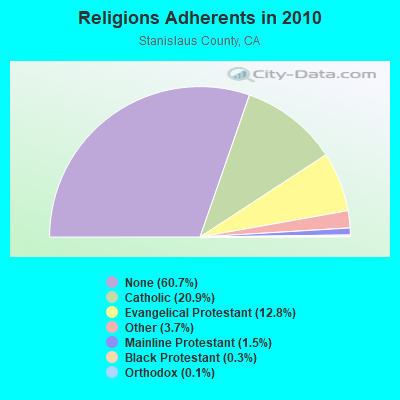
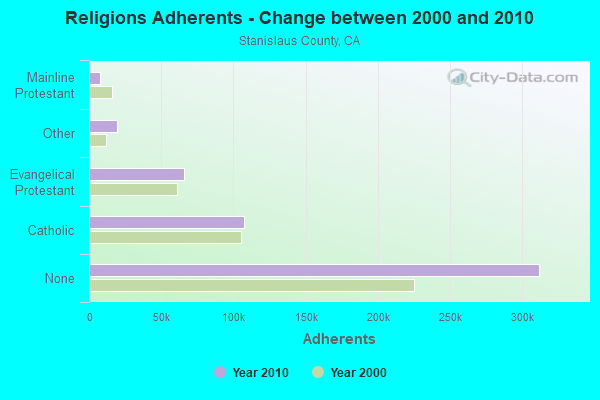
Religion statistics for Patterson, CA (based on Stanislaus County data)
Religion
Adherents
Congregations
Catholic
107,529
18
Evangelical Protestant
65,976
268
Other
19,198
59
Mainline Protestant
7,730
34
Black Protestant
1,312
8
Orthodox
625
2
None
312,083
-
Source: Clifford Grammich, Kirk Hadaway, Richard Houseal, Dale E.Jones, Alexei Krindatch, Richie Stanley and Richard H.Taylor. 2012. 2010 U.S.Religion Census: Religious Congregations & Membership Study. Association of Statisticians of American Religious Bodies. Jones, Dale E., et al. 2002. Congregations and Membership in the United States 2000. Nashville, TN: Glenmary Research Center. Graphs represent county-level data
Aircraft: PIPER PA-28RT-201T (Category: Land, Seats: 4, Weight: Up to 12,499 Pounds), Engine: CONT MOTOR TSIO-360 SER (225 HP) (Reciprocating) N-Number: 29247, N29247, N-29247, Serial Number: 28R-7931195, Year manufactured: 1979, Airworthiness Date: 04/18/1979, Certificate Issue Date: 03/24/2020 Registrant (Individual): Gilbert T Howard, 616 Roadrunner Dr, Patterson, CA 95363
Aircraft: PIPER PA-28-140 (Category: Land, Seats: 4, Weight: Up to 12,499 Pounds, Speed: 107 mph), Engine: LYCOMING 0-320 SERIES (180 HP) (Reciprocating) N-Number: 6493R, N6493R, N-6493R, Serial Number: 28-21685, Year manufactured: 1966, Airworthiness Date: 05/02/1966, Certificate Issue Date: 01/20/2012 Registrant (Individual): Jay S Reifschneider, 616 Westfield Ln, Patterson, CA 95363
Aircraft: MOULLETTE BRUCE L EAA-BIPLANE (Category: Land, Weight: Up to 12,499 Pounds), Engine: Reciprocating N-Number: 999XW, N999XW, N-999XW, Serial Number: EDLAY 1, Certificate Issue Date: 07/03/2012 Registrant (Individual): Bruce L Moullette, 1461 Henley Pkwy, Patterson, CA 95363
Aircraft: CONSOLIDATED VULTEE BT-13A (Category: Land, Seats: 2, Weight: Up to 12,499 Pounds, Speed: 108 mph), Engine: P&W R-985 SERIES (450 HP) (Reciprocating) N-Number: 64699, N64699, N-64699, Serial Number: 1463, Year manufactured: 1941 Registrant (Individual): Bob Turner, 301 S 5th, Patterson, CA 95363 Deregistered:Cancel Date: 04/05/2018
Home Mortgage Disclosure Act Aggregated Statistics For Year 2009 (Based on 3 partial tracts)
A) FHA, FSA/RHS & VA Home Purchase Loans
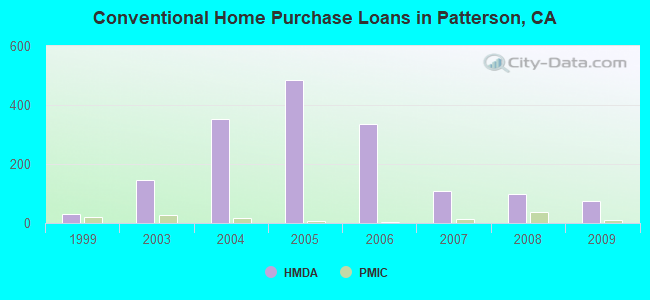
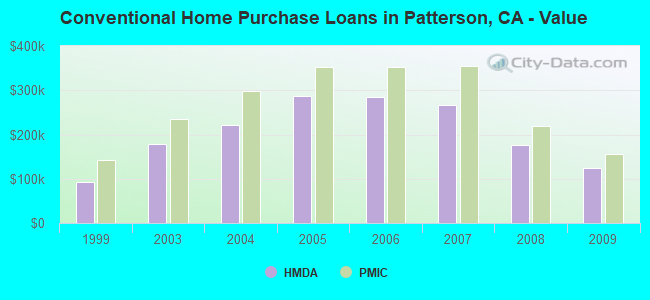
B) Conventional Home Purchase Loans
C) Refinancings
D) Home Improvement Loans
F) Non-occupant Loans on < 5 Family Dwellings (A B C & D)
Number
Average Value
Number
Average Value
Number
Average Value
Number
Average Value
Number
Average Value
LOANS ORIGINATED
156
$155,686
76
$124,672
44
$187,248
2
$74,940
34
$110,798
APPLICATIONS APPROVED, NOT ACCEPTED
10
$185,590
13
$134,246
11
$177,585
0
$0
5
$121,888
APPLICATIONS DENIED
25
$168,898
23
$134,461
32
$171,572
5
$39,286
12
$117,931
APPLICATIONS WITHDRAWN
15
$153,035
11
$136,377
13
$181,011
1
$81,860
6
$134,113
FILES CLOSED FOR INCOMPLETENESS
7
$180,816
4
$108,772
6
$207,138
1
$48,520
3
$127,423
Aggregated Statistics For Year 2008 (Based on 3 partial tracts)
A) FHA, FSA/RHS & VA Home Purchase Loans
B) Conventional Home Purchase Loans
C) Refinancings
D) Home Improvement Loans
F) Non-occupant Loans on < 5 Family Dwellings (A B C & D)
G) Loans On Manufactured Home Dwelling (A B C & D)
Number
Average Value
Number
Average Value
Number
Average Value
Number
Average Value
Number
Average Value
Number
Average Value
LOANS ORIGINATED
114
$206,694
98
$176,907
28
$185,873
3
$69,857
35
$155,563
0
$0
APPLICATIONS APPROVED, NOT ACCEPTED
7
$214,856
14
$192,706
12
$259,966
1
$15,960
4
$205,360
1
$49,180
APPLICATIONS DENIED
24
$216,291
38
$204,586
67
$258,208
8
$40,140
18
$196,402
0
$0
APPLICATIONS WITHDRAWN
17
$197,458
17
$184,477
24
$260,152
2
$136,040
7
$187,224
0
$0
FILES CLOSED FOR INCOMPLETENESS
4
$203,342
8
$217,382
9
$245,451
1
$98,180
1
$65,750
0
$0
Aggregated Statistics For Year 2007 (Based on 3 partial tracts)
A) FHA, FSA/RHS & VA Home Purchase Loans
B) Conventional Home Purchase Loans
C) Refinancings
D) Home Improvement Loans
F) Non-occupant Loans on < 5 Family Dwellings (A B C & D)
G) Loans On Manufactured Home Dwelling (A B C & D)
Number
Average Value
Number
Average Value
Number
Average Value
Number
Average Value
Number
Average Value
Number
Average Value
LOANS ORIGINATED
4
$294,558
109
$267,255
174
$288,097
20
$175,614
30
$289,732
0
$0
APPLICATIONS APPROVED, NOT ACCEPTED
0
$0
31
$286,029
64
$312,517
7
$149,771
9
$283,949
0
$0
APPLICATIONS DENIED
1
$324,990
77
$306,847
229
$345,448
25
$181,116
29
$377,343
1
$164,880
APPLICATIONS WITHDRAWN
0
$0
23
$287,409
80
$342,527
6
$158,543
14
$303,396
0
$0
FILES CLOSED FOR INCOMPLETENESS
0
$0
10
$294,270
26
$365,745
2
$327,310
3
$294,737
0
$0
Aggregated Statistics For Year 2006 (Based on 3 partial tracts)
B) Conventional Home Purchase Loans
C) Refinancings
D) Home Improvement Loans
F) Non-occupant Loans on < 5 Family Dwellings (A B C & D)
G) Loans On Manufactured Home Dwelling (A B C & D)
Number
Average Value
Number
Average Value
Number
Average Value
Number
Average Value
Number
Average Value
LOANS ORIGINATED
334
$284,805
329
$300,470
46
$149,790
52
$295,869
1
$202,820
APPLICATIONS APPROVED, NOT ACCEPTED
84
$279,978
90
$301,714
13
$147,508
16
$292,891
1
$151,610
APPLICATIONS DENIED
156
$300,670
212
$344,365
45
$177,930
25
$332,686
1
$140,720
APPLICATIONS WITHDRAWN
88
$291,822
133
$324,731
8
$193,015
12
$334,128
0
$0
FILES CLOSED FOR INCOMPLETENESS
12
$320,187
30
$294,122
2
$124,885
2
$326,620
0
$0
Aggregated Statistics For Year 2005 (Based on 3 partial tracts)
B) Conventional Home Purchase Loans
C) Refinancings
D) Home Improvement Loans
F) Non-occupant Loans on < 5 Family Dwellings (A B C & D)
G) Loans On Manufactured Home Dwelling (A B C & D)
Number
Average Value
Number
Average Value
Number
Average Value
Number
Average Value
Number
Average Value
LOANS ORIGINATED
486
$286,478
402
$278,059
45
$185,816
54
$273,165
2
$135,905
APPLICATIONS APPROVED, NOT ACCEPTED
119
$285,368
71
$281,932
9
$113,739
13
$246,981
0
$0
APPLICATIONS DENIED
170
$300,929
173
$314,166
33
$139,786
25
$303,896
1
$28,220
APPLICATIONS WITHDRAWN
103
$309,726
106
$278,561
17
$238,352
10
$253,285
0
$0
FILES CLOSED FOR INCOMPLETENESS
24
$315,246
34
$273,471
1
$99,410
3
$242,107
0
$0
Aggregated Statistics For Year 2004 (Based on 3 partial tracts)
B) Conventional Home Purchase Loans
C) Refinancings
D) Home Improvement Loans
F) Non-occupant Loans on < 5 Family Dwellings (A B C & D)
G) Loans On Manufactured Home Dwelling (A B C & D)
Number
Average Value
Number
Average Value
Number
Average Value
Number
Average Value
Number
Average Value
LOANS ORIGINATED
354
$221,591
284
$210,711
31
$121,302
42
$215,763
1
$265,330
APPLICATIONS APPROVED, NOT ACCEPTED
79
$237,083
54
$201,394
6
$90,900
7
$229,424
0
$0
APPLICATIONS DENIED
129
$214,340
123
$213,181
23
$93,032
9
$204,206
1
$41,130
APPLICATIONS WITHDRAWN
93
$251,654
93
$212,737
6
$124,838
6
$247,230
0
$0
FILES CLOSED FOR INCOMPLETENESS
18
$255,151
37
$219,491
3
$102,343
2
$180,035
0
$0
Aggregated Statistics For Year 2003 (Based on 3 partial tracts)
A) FHA, FSA/RHS & VA Home Purchase Loans
B) Conventional Home Purchase Loans
C) Refinancings
D) Home Improvement Loans
F) Non-occupant Loans on < 5 Family Dwellings (A B C & D)
Number
Average Value
Number
Average Value
Number
Average Value
Number
Average Value
Number
Average Value
LOANS ORIGINATED
5
$219,562
146
$179,625
308
$162,874
10
$38,803
25
$150,525
APPLICATIONS APPROVED, NOT ACCEPTED
0
$0
20
$179,922
50
$171,891
3
$62,377
5
$184,546
APPLICATIONS DENIED
1
$129,260
27
$178,073
110
$176,988
16
$43,958
7
$159,240
APPLICATIONS WITHDRAWN
0
$0
47
$222,044
77
$170,486
4
$44,552
3
$133,763
FILES CLOSED FOR INCOMPLETENESS
0
$0
2
$247,195
14
$160,714
1
$117,640
1
$157,380
Aggregated Statistics For Year 1999 (Based on 2 partial tracts)
A) FHA, FSA/RHS & VA Home Purchase Loans
B) Conventional Home Purchase Loans
C) Refinancings
D) Home Improvement Loans
F) Non-occupant Loans on < 5 Family Dwellings (A B C & D)
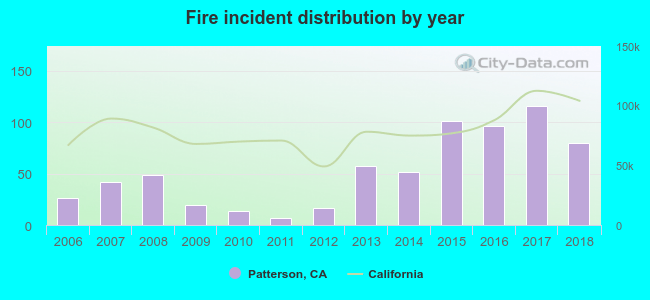
2006 - 2018 National Fire Incident Reporting System (NFIRS) incidents
According to the data from the years 2006 - 2018 the average number of fire incidents per year is 52. The highest number of fires - 116 took place in 2017, and the least - 7 in 2011. The data has an increasing trend.
When looking into fire subcategories, the most reports belonged to: Outside Fires (49.1%), and Structure Fires (32.4%).
Fire incident types reported to NFIRS in Patterson, CA


 Recent articles from our blog. Our writers, many of them Ph.D. graduates or candidates, create easy-to-read articles on a wide variety of topics.

 (15.1 miles


 According to the data from the years 2006 - 2018 the average number of fire incidents per year is 52. The highest number of fires - 116 took place in 2017, and the least - 7 in 2011. The data has an increasing trend.
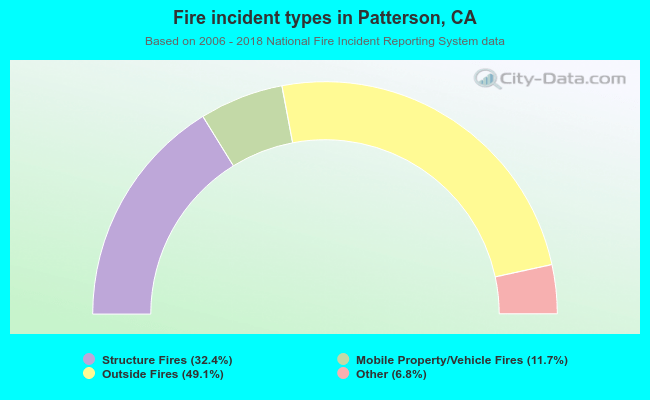 When looking into fire subcategories, the most reports belonged to: Outside Fires (49.1%), and Structure Fires (32.4%).