Estimated zip code population in 2022: 29,536 Zip code population in 2010: 25,237 Zip code population in 2000: 15,529
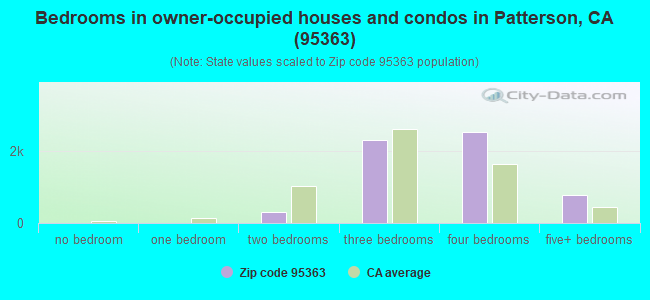
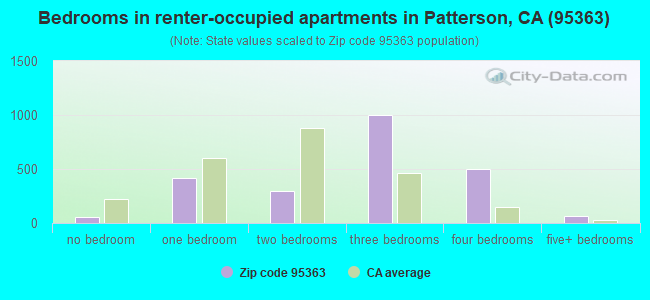
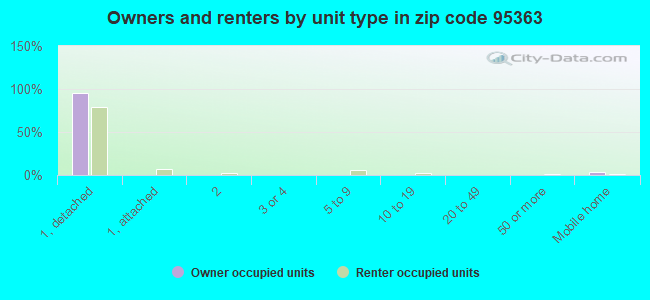
Houses and condos: 8,690 Renter-occupied apartments: 2,340
% of renters here:
28%
State:
44%
March 2022 cost of living index in zip code 95363: 98.2 (near average, U.S. average is 100)
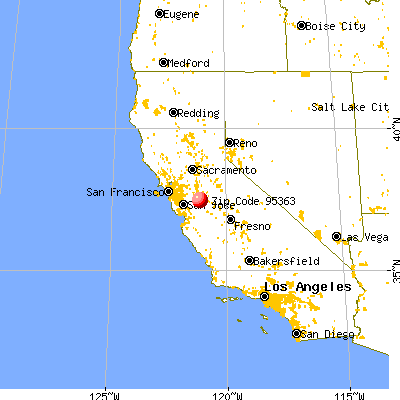
Land area: 118.0 sq. mi. Water area: 0.3 sq. mi.
Population density: 250 people per square mile
(very low).
OSM Map
General Map
Google Map
MSN Map
OSM Map
General Map
Google Map
MSN Map
OSM Map
General Map
Google Map
MSN Map
OSM Map
General Map
Google Map
MSN Map
Please wait while loading the map...
Real estate property taxes paid for housing units in 2022:
This zip code:
1.0% ($4,589)
California:
0.7% ($4,831)
Median real estate property taxes paid for housing units with mortgages in 2022: $5,428 (1.2%) Median real estate property taxes paid for housing units with no mortgage in 2022: $2,944 (0.6%)
Averages for the 2020 tax year for zip code 95363, filed in 2021:
Average Adjusted Gross Income (AGI) in 2020: $58,812 (Individual Income Tax Returns)
Here:
$58,812
State:
$95,910
Salary/wage: $53,912 (reported on 86.4% of returns)
Here:
$53,912
State:
$77,331
(% of AGI for various income ranges: 1300.7% for AGIs below $25k, 3969.2% for AGIs $25k-50k, 7643.2% for AGIs $50k-75k, 10630.6% for AGIs $75k-100k, 21196.8% for AGIs $100k-200k, 75284.4% for AGIs over 200k)
Taxable interest for individuals: $567 (reported on 28.5% of returns)
This zip code:
$567
California:
$2,294
(% of AGI for various income ranges: 5.2% for AGIs below $25k, 6.4% for AGIs $25k-50k, 14.5% for AGIs $50k-75k, 32.2% for AGIs $75k-100k, 44.3% for AGIs $100k-200k, 997.8% for AGIs over 200k)
Ordinary dividends: $5,488 (reported on 7.5% of returns)
Here:
$5,488
State:
$10,949
(% of AGI for various income ranges: 8.6% for AGIs below $25k, 10.5% for AGIs $25k-50k, 17.8% for AGIs $50k-75k, 50.1% for AGIs $75k-100k, 86.5% for AGIs $100k-200k, 3798.9% for AGIs over 200k)
Net capital gain/loss in AGI: +$12,066 (reported on 8.4% of returns)
Here:
+$12,066
State:
+$49,306
(% of AGI for various income ranges: 4.7% for AGIs below $25k, 13.4% for AGIs $25k-50k, 53.5% for AGIs $50k-75k, 113.2% for AGIs $75k-100k, 279.7% for AGIs $100k-200k, 9473.3% for AGIs over 200k)
Profit/loss from business: +$10,732 (reported on 14.2% of returns)
Here:
+$10,732
State:
+$15,671
(% of AGI for various income ranges: 91.3% for AGIs below $25k, 207.9% for AGIs $25k-50k, 283.8% for AGIs $50k-75k, 140.0% for AGIs $75k-100k, 392.6% for AGIs $100k-200k, 3467.8% for AGIs over 200k)
Taxable individual retirement arrangement distribution: $19,237 (reported on 3.2% of returns)
95363:
$19,237
California:
$23,505
(% of AGI for various income ranges: 20.0% for AGIs below $25k, 38.4% for AGIs $25k-50k, 71.4% for AGIs $50k-75k, 140.5% for AGIs $75k-100k, 454.6% for AGIs $100k-200k)
Total itemized deductions: $27,909 (reported on 11.4% of returns)
Here:
$27,909
State:
$39,517
(% of AGI for various income ranges: 56.9% for AGIs below $25k, 148.0% for AGIs $25k-50k, 508.7% for AGIs $50k-75k, 780.4% for AGIs $75k-100k, 1687.9% for AGIs $100k-200k, 6672.2% for AGIs over 200k)
Charity contributions: $4,860 (reported on 8.4% of returns)
Here:
$4,860
State:
$12,598
(% of AGI for various income ranges: 4.9% for AGIs below $25k, 11.8% for AGIs $25k-50k, 47.0% for AGIs $50k-75k, 86.5% for AGIs $75k-100k, 239.2% for AGIs $100k-200k, 1356.7% for AGIs over 200k)
Taxes paid: $8,668 (reported on 11.2% of returns)
95363:
$8,668
State:
$8,807
(% of AGI for various income ranges: 14.2% for AGIs below $25k, 38.6% for AGIs $25k-50k, 168.7% for AGIs $50k-75k, 267.8% for AGIs $75k-100k, 552.3% for AGIs $100k-200k, 1472.2% for AGIs over 200k)
Earned income credit: $2,318 (reported on 17.0% of returns)
Here:
$2,318
State:
$2,074
(% of AGI for various income ranges: 105.2% for AGIs below $25k, 83.9% for AGIs $25k-50k, 1.8% for AGIs $50k-75k)
Percentage of individuals using paid preparers for their 2020 taxes: 94.6%
Here:
95%
State:
92%
(% for various income ranges: 93.6% for AGIs below $25k, 94.5% for AGIs $25k-50k, 94.7% for AGIs $50k-75k, 96.4% for AGIs $75k-100k, 95.1% for AGIs $100k-200k, 96.8% for AGIs over 200k)
Averages for the 2012 tax year for zip code 95363, filed in 2013:
Average Adjusted Gross Income (AGI) in 2012: $46,987 (Individual Income Tax Returns)
Here:
$46,987
State:
$72,726
Salary/wage: $42,260 (reported on 87.0% of returns)
Here:
$42,260
State:
$59,079
(% of AGI for various income ranges: 74.4% for AGIs below $25k, 82.3% for AGIs $25k-50k, 85.1% for AGIs $50k-75k, 84.8% for AGIs $75k-100k, 81.2% for AGIs $100k-200k, 43.3% for AGIs over 200k)
Taxable interest for individuals: $701 (reported on 28.0% of returns)
This zip code:
$701
California:
$2,146
(% of AGI for various income ranges: 0.6% for AGIs below $25k, 0.2% for AGIs $25k-50k, 0.3% for AGIs $50k-75k, 0.4% for AGIs $75k-100k, 0.5% for AGIs $100k-200k, 0.9% for AGIs over 200k)
Ordinary dividends: $2,677 (reported on 8.3% of returns)
Here:
$2,677
State:
$9,308
(% of AGI for various income ranges: 0.6% for AGIs below $25k, 0.2% for AGIs $25k-50k, 0.3% for AGIs $50k-75k, 0.3% for AGIs $75k-100k, 0.4% for AGIs $100k-200k, 1.7% for AGIs over 200k)
Net capital gain/loss in AGI: +$5,825 (reported on 6.4% of returns)
Here:
+$5,825
State:
+$30,460
(% of AGI for various income ranges: 0.1% for AGIs $75k-100k, 0.5% for AGIs $100k-200k, 6.7% for AGIs over 200k)
Profit/loss from business: +$11,160 (reported on 13.5% of returns)
Here:
+$11,160
State:
+$17,064
(% of AGI for various income ranges: 8.2% for AGIs below $25k, 3.9% for AGIs $25k-50k, 2.2% for AGIs $50k-75k, 2.0% for AGIs $75k-100k, 3.1% for AGIs $100k-200k)
Taxable individual retirement arrangement distribution: $14,876 (reported on 4.9% of returns)
95363:
$14,876
California:
$19,557
(% of AGI for various income ranges: 2.0% for AGIs below $25k, 1.1% for AGIs $25k-50k, 1.5% for AGIs $50k-75k, 1.5% for AGIs $75k-100k, 2.4% for AGIs $100k-200k)
Self-employment retirement plans: $21,800 (reported on 0.2% of returns)
95363:
$21,800
California:
$24,530
Total itemized deductions: $22,927 (27% of AGI, reported on 32.5% of returns)
Here:
$22,927
State:
$34,004
Here:
27.3% of AGI
State:
22.7% of AGI
(% of AGI for various income ranges: 8.2% for AGIs below $25k, 13.8% for AGIs $25k-50k, 17.4% for AGIs $50k-75k, 18.8% for AGIs $75k-100k, 18.7% for AGIs $100k-200k, 15.0% for AGIs over 200k)
Charity contributions: $2,664 (reported on 25.2% of returns)
Here:
$2,664
State:
$4,659
(% of AGI for various income ranges: 0.4% for AGIs below $25k, 1.0% for AGIs $25k-50k, 1.2% for AGIs $50k-75k, 1.6% for AGIs $75k-100k, 1.7% for AGIs $100k-200k, 2.9% for AGIs over 200k)
Taxes paid: $7,646 (reported on 32.4% of returns)
95363:
$7,646
State:
$14,448
(% of AGI for various income ranges: 2.0% for AGIs below $25k, 3.4% for AGIs $25k-50k, 5.2% for AGIs $50k-75k, 6.1% for AGIs $75k-100k, 7.1% for AGIs $100k-200k, 7.7% for AGIs over 200k)
Earned income credit: $2,519 (reported on 23.9% of returns)
Here:
$2,519
State:
$2,286
(% of AGI for various income ranges: 8.4% for AGIs below $25k, 1.5% for AGIs $25k-50k)
Percentage of individuals using paid preparers for their 2012 taxes: 69.3%
Here:
69%
State:
64%
(% for various income ranges: 68.4% for AGIs below $25k, 69.7% for AGIs $25k-50k, 71.5% for AGIs $50k-75k, 68.2% for AGIs $75k-100k, 69.3% for AGIs $100k-200k, 75.0% for AGIs over 200k)
Averages for the 2004 tax year for zip code 95363, filed in 2005:
Average Adjusted Gross Income (AGI) in 2004: $42,992 (Individual Income Tax Returns)
Here:
$42,992
State:
$58,600
Salary/wage: $39,258 (reported on 89.9% of returns)
Here:
$39,258
State:
$49,455
(% of AGI for various income ranges: 174.9% for AGIs below $10k, 81.6% for AGIs $10k-25k, 87.8% for AGIs $25k-50k, 89.8% for AGIs $50k-75k, 87.9% for AGIs $75k-100k, 62.5% for AGIs over 100k)
Taxable interest for individuals: $1,380 (reported on 37.6% of returns)
This zip code:
$1,380
California:
$2,365
(% of AGI for various income ranges: 6.6% for AGIs below $10k, 1.3% for AGIs $10k-25k, 0.8% for AGIs $25k-50k, 0.5% for AGIs $50k-75k, 0.9% for AGIs $75k-100k, 2.2% for AGIs over 100k)
Taxable dividends: $2,019 (reported on 11.0% of returns)
Here:
$2,019
State:
$4,746
(% of AGI for various income ranges: 3.3% for AGIs below $10k, 0.6% for AGIs $10k-25k, 0.3% for AGIs $25k-50k, 0.2% for AGIs $50k-75k, 0.3% for AGIs $75k-100k, 1.0% for AGIs over 100k)
Net capital gain/loss: +$16,104 (reported on 10.3% of returns)
Here:
+$16,104
State:
+$23,418
(% of AGI for various income ranges: 12.8% for AGIs below $10k, 0.1% for AGIs $10k-25k, 0.4% for AGIs $25k-50k, 0.9% for AGIs $50k-75k, 0.9% for AGIs $75k-100k, 12.9% for AGIs over 100k)
Profit/loss from business: +$12,653 (reported on 12.1% of returns)
Here:
+$12,653
State:
+$16,826
(% of AGI for various income ranges: 0.2% for AGIs below $10k, 5.2% for AGIs $10k-25k, 3.3% for AGIs $25k-50k, 2.4% for AGIs $50k-75k, 3.0% for AGIs $75k-100k, 4.8% for AGIs over 100k)
IRA payment deduction: $3,089 (reported on 1.5% of returns)
95363:
$3,089
California:
$3,192
(% of AGI for various income ranges: 0.1% for AGIs $10k-25k, 0.1% for AGIs $25k-50k, 0.1% for AGIs $50k-75k, 0.1% for AGIs $75k-100k, 0.1% for AGIs over 100k)
Self-employed pension: $17,633 (reported on 0.4% of returns)
Here:
$17,633
California:
$17,688
Total itemized deductions: $22,179 (31% of AGI, reported on 41.5% of returns)
Here:
$22,179
State:
$28,113
Here:
31.0% of AGI
State:
25.3% of AGI
(% of AGI for various income ranges: 29.7% for AGIs below $10k, 13.2% for AGIs $10k-25k, 20.3% for AGIs $25k-50k, 25.9% for AGIs $50k-75k, 25.2% for AGIs $75k-100k, 18.6% for AGIs over 100k)
Charity contributions deductions: $2,014 (3% of AGI, reported on 35.2% of returns)
Here:
$2,014
State:
$3,923
Here:
2.7% of AGI
State:
3.3% of AGI
(% of AGI for various income ranges: 0.8% for AGIs below $10k, 0.7% for AGIs $10k-25k, 1.3% for AGIs $25k-50k, 1.9% for AGIs $50k-75k, 2.1% for AGIs $75k-100k, 1.8% for AGIs over 100k)
Total tax: $5,345 (reported on 66.2% of returns)
95363:
$5,345
State:
$10,761
(% of AGI for various income ranges: 4.3% for AGIs below $10k, 3.1% for AGIs $10k-25k, 4.8% for AGIs $25k-50k, 6.4% for AGIs $50k-75k, 8.1% for AGIs $75k-100k, 15.1% for AGIs over 100k)
Earned income credit: $1,938 (reported on 20.0% of returns)
Here:
$1,938
State:
$1,763
Percentage of individuals using paid preparers for their 2004 taxes: 71.1%
Here:
71%
State:
66%
(% for various income ranges: 61.3% for AGIs below $10k, 73.3% for AGIs $10k-25k, 72.5% for AGIs $25k-50k, 74.5% for AGIs $50k-75k, 69.4% for AGIs $75k-100k, 75.4% for AGIs over 100k)
Likely homosexual households (counted as self-reported same-sex unmarried-partner households)
Lesbian couples: 0.2% of all households
Gay men: 0.0% of all households
Household received Food Stamps/SNAP in the past 12 months: 915 Household did not receive Food Stamps/SNAP in the past 12 months: 7,261
Women who had a birth in the past 12 months: 263 (143 now married, 120 unmarried) Women who did not have a birth in the past 12 months: 6,890 (3,182 now married, 3,688 unmarried)
Housing units in zip code 95363 with a mortgage: 3,930 (77 second mortgage, 41 both second mortgage and home equity loan) Median monthly owner costs for units with a mortgage: $2,211 Median monthly owner costs for units without a mortgage: $669
Residents with income below the poverty level in 2022:
This zip code:
7.9%
Whole state:
12.2%
Residents with income below 50% of the poverty level in 2022:
This zip code:
5.0%
Whole state:
6.2%
Median number of rooms in houses and condos:
Here:
6.3
State:
6.0
Median number of rooms in apartments:
Here:
5.1
State:
3.9
Notable locations in this zip code not listed on our city pages
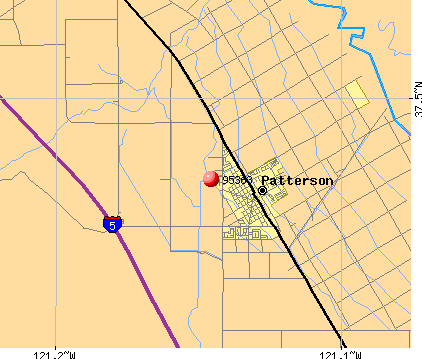
Notable locations in zip code 95363: City of Patterson Sewage Disposal (A), Stanislaus County Ranch (B), Oak Flats Ranch (C), Williams Ranch (D), Tripp Ranch (E), Kronkite Ranch (F), Jones Ranch (G), Herman Ranch (H), Gerber Ranch (I), Frame Ranch (J), Vanormer Pumping Station (K), Salado Substation (L), Patterson District Ambulance (M), Department of Forestry and Fire Protection Station 15 Del Puerto (N), West Stanislaus County Fire Protection District Diablo Grande Station (O), West Stanislaus County Fire Protection District Westley Station (P), West Stanislaus County Fire Protection District - Patterson Fire Department Station 2 (Q), Patterson Fire Department Station 1 (R), West Stanislaus County Fire Protection District Headquarters (S), The Center Building (T). Display/hide their locations on the map
Churches in zip code 95363 include: Evangelical Covenant Church (A), Federated Methodist-Presbyterian Church (B), First Assembly of God Church (C), First Baptist Church (D), Our Saviours Lutheran Church (E), Sacred Heart Catholic Church (F). Display/hide their locations on the map
Creeks: Del Puerto Creek (A), Lotta Creek (B), Falls Creek (C), Garden Canyon Creek (D), Salado Creek (E), Adobe Creek (F), Peach Tree Creek (G). Display/hide their locations on the map
Parks in zip code 95363 include: Frank Raines Park (1), Felipe Garza Park (2), North Park (3), Patterson Community Stadium (4), South Park (5). Display/hide their locations on the map
5,709 married couples with children.
1,527 single-parent households (757 men, 770 women).
39.6% of residents of 95363 zip code speak English at home.
52.4% of residents speak Spanish at home (61% very well, 13% well, 16% not well, 9% not at all).
1.7% of residents speak other Indo-European language at home (73% very well, 23% well, 4% not well).
3.8% of residents speak Asian or Pacific Island language at home (37% very well, 37% well, 22% not well, 4% not at all).
2.1% of residents speak other language at home (54% very well, 30% well, 16% not well).
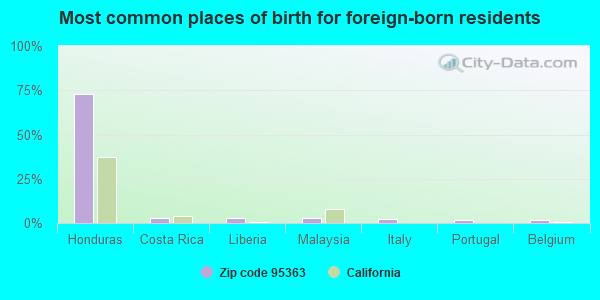
Foreign born population: 7,555 (25.6%) (44.7% of them are naturalized citizens)
This zip code:
25.6%
Whole state:
26.7%
73%Honduras
3%Costa Rica
3%Liberia
3%Malaysia
2%Italy
2%Portugal
2%Belgium
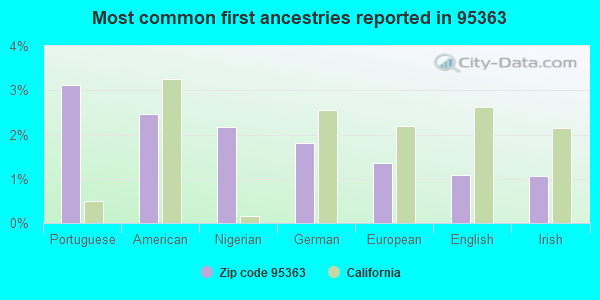
3%Portuguese
2%American
2%Nigerian
2%German
1%European
1%English
1%Irish
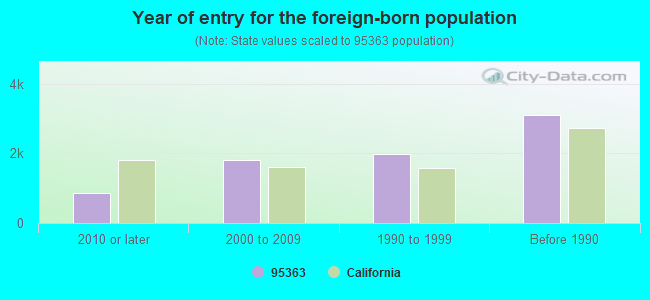
Year of entry for the foreign-born population
8632010 or later
1,8082000 to 2009
1,9711990 to 1999
3,106Before 1990
Major facilities with environmental interests located in this zip code:
JM EQUIPMENT (16507 HWY 33 in PATTERSON, CA)
STATE MASTER (California - Hazardous Waste Tracking) - HAZARDOU WASTE PROGRAM Small Quantity Generators, between 100 kg and 1000 kg of hazardous waste/month (Resource Conservation and Recovery Act (tracking hazardous waste))
FRED FRIAS UNION SERVICES (226 N 2ND ST in PATTERSON, CA)
CRITERIA AND HAZARDOUS AIR POLLUTANT INVENTORY (Inventory of air pollution sources) STATE MASTER (California - Used Oil Recycling System ) - USED OIL RECYCLING Business SIC classification: GASOLINE SERVICE STATIONS
LAS PALMAS ELEMENTARY (624 W. LAS PALMAS AVE. in PATTERSON, CA)
(National Center for Education Statistics) - STATE ID-6052948 Organizations: PATTERSON JOINT UNIFIED (SCHOOL DISTRICT)
NORTHMEAD ELEMENTARY (625 L ST. in PATTERSON, CA)
(National Center for Education Statistics) - STATE ID-6052955 Organizations: PATTERSON JOINT UNIFIED (SCHOOL DISTRICT)
CASTLE A L INC (1607 W MARSHALL RD in PATTERSON, CA)
SUPERFUND (Superfund database) (Resource Conservation and Recovery Act (tracking hazardous waste)) Organizations: A L CASTLE INC (CONTACT/OWNER)
CALIFORNIA NORTHERN RAILROAD (CFNR STATION OF PATTERSON in PATTERSON, CA)
(Resource Conservation and Recovery Act (tracking hazardous waste))
JOHN ROBERT PENDLEY (304 BARROS ST in PATTERSON, CA)
TRANSPORTER (Resource Conservation and Recovery Act (tracking hazardous waste)) Business NAICS classification: SOLID WASTE COLLECTION.; HAZARDOUS WASTE COLLECTION. Organizations: JOHN R PENDLEY (CONTACT/OPERATOR)
MICHAEL D HINSON (949 MARY JANE AVE in PATTERSON, CA)
TRANSPORTER (Resource Conservation and Recovery Act (tracking hazardous waste)) Organizations: HINSON MICHAEL (CONTACT/OWNER)
CALTRANS (2060 SPERRY AVE in PATTERSON, CA)
Small Quantity Generators, between 100 kg and 1000 kg of hazardous waste/month (Resource Conservation and Recovery Act (tracking hazardous waste)) - notification Business NAICS classification: AIR TRAFFIC CONTROL. Organizations: CALIFORNIA STATE OF (CONTACT/OWNER)
HOLTON ENTERPRISE (208 S EL CIRCULO AVE in PATTERSON, CA)
Small Quantity Generators, between 100 kg and 1000 kg of hazardous waste/month (Resource Conservation and Recovery Act (tracking hazardous waste)) Business NAICS classification: GENERAL AUTOMOTIVE REPAIR.
KENNETH L RENFROW (14719 WARD AVE in PATTERSON, CA)
TRANSPORTER (Resource Conservation and Recovery Act (tracking hazardous waste))
LAZO TRUCKING (250 K ST NO 5 in PATTERSON, CA)
TRANSPORTER (Resource Conservation and Recovery Act (tracking hazardous waste)) - notification Organizations: RICHARD LAZO (CONTACT/OWNER)
FAMILY FORD (250 EL CIRCULO in PATTERSON, CA)
CRITERIA AND HAZARDOUS AIR POLLUTANT INVENTORY (Inventory of air pollution sources) Business SIC classification: MOTOR VEHICLE DEALERS (NEW AND USED)
Housing units lacking complete plumbing facilities: 0.2% Housing units lacking complete kitchen facilities: 2.5%
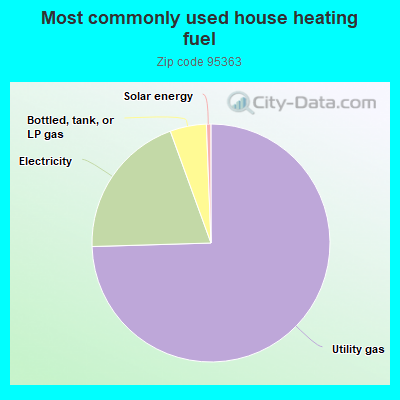
74.0%Utility gas
19.8%Electricity
4.9%Bottled, tank, or LP gas
0.6%Solar energy
Population in 1990: 13,437. Population change in the 1990s: +2,092 (+15.6%).
Place of birth for U.S.-born residents:
This state: 19,879
Northeast: 150
Midwest: 294
South: 578
West: 797
54% of the 95363 zip code residents lived in the same house 5 years ago. Out of people who lived in different houses, 61% lived in this county. Out of people who lived in different counties, 50% lived in California.
97% of the 95363 zip code residents lived in the same house 1 year ago. Out of people who lived in different houses, 60% moved from this county. Out of people who lived in different houses, 46% moved from different county within same state. Out of people who lived in different houses, 5% moved from different state. Out of people who lived in different houses, 2% moved from abroad.
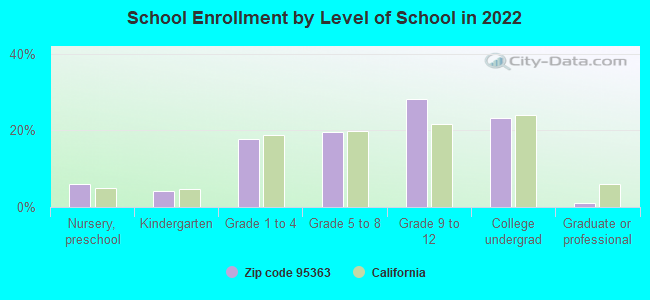
Private vs. public school enrollment:
Students in private schools in grades 1 to 8 (elementary and middle school): 402
Here:
12.9%
California:
10.5%
Students in private schools in grades 9 to 12 (high school): 176
Here:
7.5%
California:
8.5%
Students in private undergraduate colleges: 275
Here:
14.3%
California:
15.9%
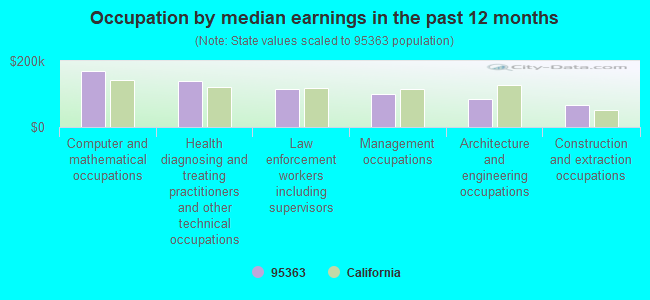
Occupation by median earnings in the past 12 months ($)
169,919Computer and mathematical occupations
139,951Health diagnosing and treating practitioners and other technical occupations
114,846Law enforcement workers including supervisors
101,134Management occupations
84,289Architecture and engineering occupations
65,649Construction and extraction occupations
Top industries in this zip code by the number of employees in 2005:
2006 - 2018 National Fire Incident Reporting System (NFIRS) incidents
Based on the data from the years 2006 - 2018 the average number of fires per year is 74. The highest number of reported fire incidents - 172 took place in 2017, and the least - 11 in 2011. The data has a growing trend.
When looking into fire subcategories, the most incidents belonged to: Outside Fires (54.4%), and Structure Fires (26.2%).
Fire incident types reported to NFIRS in Zip Code 95363


 Nearest zip codes: 95387, 95360, 95385, 95313, 95358, 95304.


 Based on the data from the years 2006 - 2018 the average number of fires per year is 74. The highest number of reported fire incidents - 172 took place in 2017, and the least - 11 in 2011. The data has a growing trend.
 When looking into fire subcategories, the most incidents belonged to: Outside Fires (54.4%), and Structure Fires (26.2%).