Estimated zip code population in 2022: 13,666 Zip code population in 2010: 11,712 Zip code population in 2000: 8,485
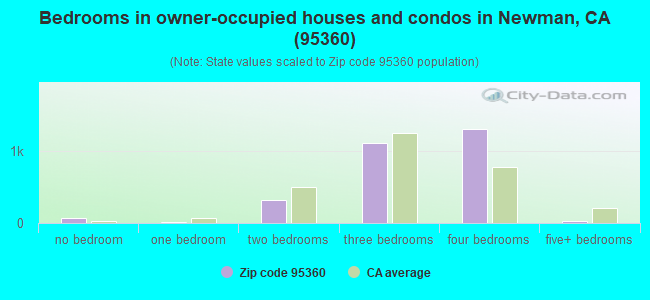
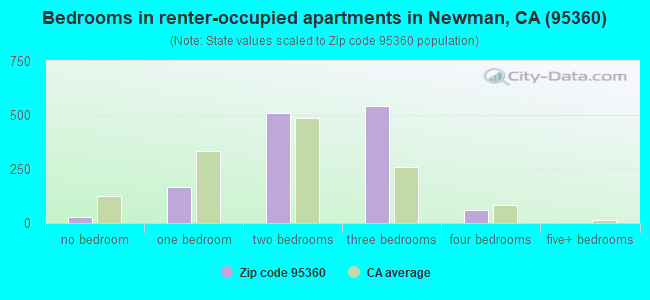
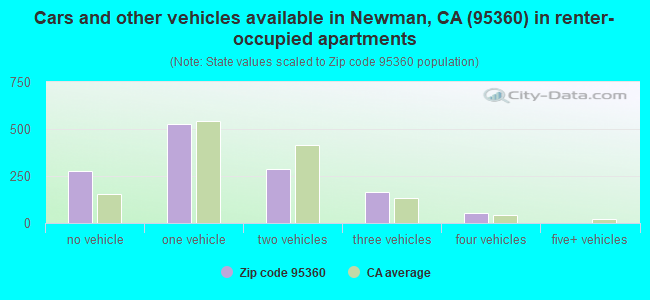
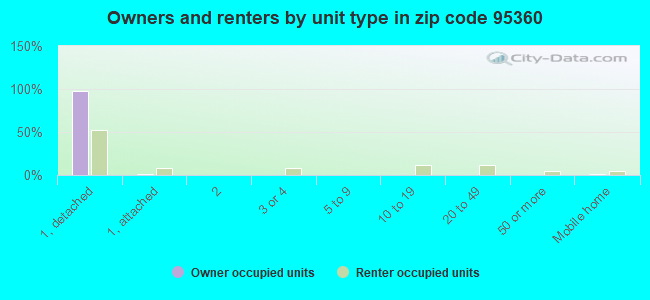
Houses and condos: 4,616 Renter-occupied apartments: 1,309
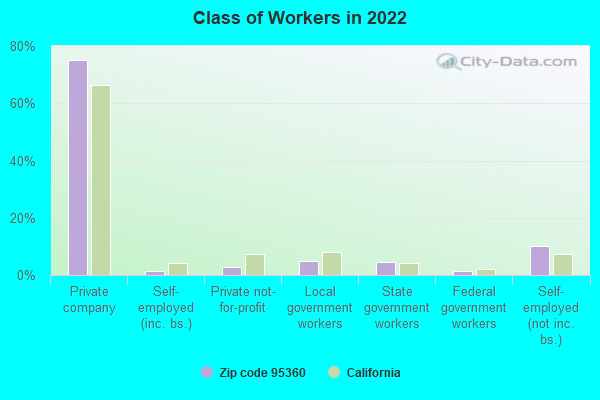
% of renters here:
31%
State:
44%
March 2022 cost of living index in zip code 95360: 97.5 (near average, U.S. average is 100)
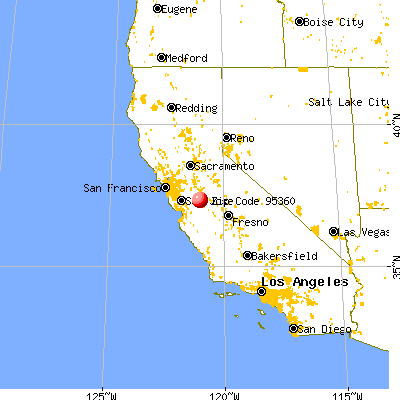
Land area: 334.7 sq. mi. Water area: 1.7 sq. mi.
Population density: 41 people per square mile
(very low).
OSM Map
General Map
Google Map
MSN Map
OSM Map
General Map
Google Map
MSN Map
OSM Map
General Map
Google Map
MSN Map
OSM Map
General Map
Google Map
MSN Map
Please wait while loading the map...
Real estate property taxes paid for housing units in 2022:
This zip code:
0.7% ($2,581)
California:
0.7% ($4,831)
Median real estate property taxes paid for housing units with mortgages in 2022: $2,715 (0.7%) Median real estate property taxes paid for housing units with no mortgage in 2022: $1,887 (0.5%)
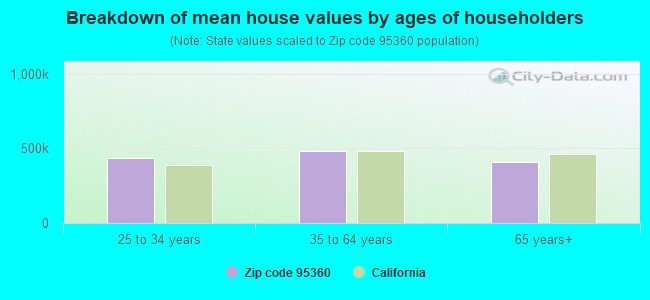
Estimated median house/condo value in 2022: $387,431
95360:
$387,431
California:
$715,900
According to our research of California and other state lists, there were 13 registered sex offenders living in 95360 zip code as of April 27, 2024. The ratio of all residents to sex offenders in zip code 95360 is 955 to 1. The ratio of registered sex offenders to all residents in this zip code is lower than the state average.
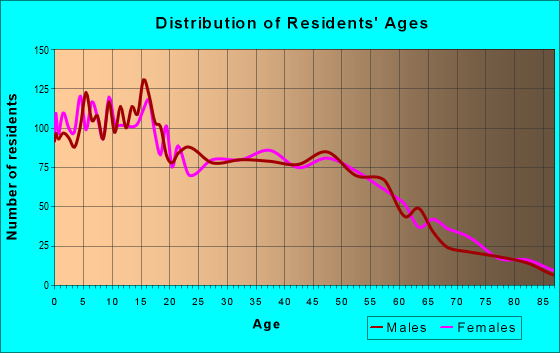
Median resident age:
This zip code:
35.5 years
California median age:
37.9 years
Average household size:
This zip code:
3.3 people
California:
2.8 people
Averages for the 2020 tax year for zip code 95360, filed in 2021:
Average Adjusted Gross Income (AGI) in 2020: $52,698 (Individual Income Tax Returns)
Here:
$52,698
State:
$95,910
Salary/wage: $48,420 (reported on 86.6% of returns)
Here:
$48,420
State:
$77,331
(% of AGI for various income ranges: 1331.0% for AGIs below $25k, 4184.3% for AGIs $25k-50k, 7715.1% for AGIs $50k-75k, 10410.7% for AGIs $75k-100k, 21156.7% for AGIs $100k-200k)
Taxable interest for individuals: $497 (reported on 28.4% of returns)
This zip code:
$497
California:
$2,294
(% of AGI for various income ranges: 8.3% for AGIs below $25k, 9.9% for AGIs $25k-50k, 14.9% for AGIs $50k-75k, 12.1% for AGIs $75k-100k, 60.0% for AGIs $100k-200k)
Ordinary dividends: $2,760 (reported on 5.9% of returns)
Here:
$2,760
State:
$10,949
(% of AGI for various income ranges: 5.7% for AGIs below $25k, 12.3% for AGIs $25k-50k, 28.7% for AGIs $50k-75k, 24.3% for AGIs $75k-100k, 64.5% for AGIs $100k-200k)
Net capital gain/loss in AGI: +$22,934 (reported on 6.9% of returns)
Here:
+$22,934
State:
+$49,306
(% of AGI for various income ranges: 2.1% for AGIs below $25k, 10.6% for AGIs $25k-50k, 58.1% for AGIs $50k-75k, 103.8% for AGIs $75k-100k, 604.8% for AGIs $100k-200k)
Profit/loss from business: +$9,709 (reported on 13.2% of returns)
Here:
+$9,709
State:
+$15,671
(% of AGI for various income ranges: 125.3% for AGIs below $25k, 133.4% for AGIs $25k-50k, 129.0% for AGIs $50k-75k, 203.1% for AGIs $75k-100k, 776.4% for AGIs $100k-200k)
Taxable individual retirement arrangement distribution: $12,474 (reported on 3.2% of returns)
95360:
$12,474
California:
$23,505
(% of AGI for various income ranges: 21.5% for AGIs below $25k, 31.8% for AGIs $25k-50k, 59.0% for AGIs $50k-75k, 62.9% for AGIs $75k-100k, 310.9% for AGIs $100k-200k)
Total itemized deductions: $28,709 (reported on 7.4% of returns)
Here:
$28,709
State:
$39,517
(% of AGI for various income ranges: 133.3% for AGIs $25k-50k, 385.9% for AGIs $50k-75k, 631.0% for AGIs $75k-100k, 1282.4% for AGIs $100k-200k)
Charity contributions: $5,359 (reported on 5.4% of returns)
Here:
$5,359
State:
$12,598
(% of AGI for various income ranges: 13.6% for AGIs $25k-50k, 35.6% for AGIs $50k-75k, 100.2% for AGIs $75k-100k, 196.1% for AGIs $100k-200k)
Taxes paid: $7,952 (reported on 7.4% of returns)
95360:
$7,952
State:
$8,807
(% of AGI for various income ranges: 27.5% for AGIs $25k-50k, 108.0% for AGIs $50k-75k, 192.4% for AGIs $75k-100k, 390.0% for AGIs $100k-200k)
Earned income credit: $2,400 (reported on 17.9% of returns)
Here:
$2,400
State:
$2,074
(% of AGI for various income ranges: 111.0% for AGIs below $25k, 88.3% for AGIs $25k-50k, 3.0% for AGIs $50k-75k)
Percentage of individuals using paid preparers for their 2020 taxes: 94.6%
Here:
95%
State:
92%
(% for various income ranges: 93.6% for AGIs below $25k, 94.7% for AGIs $25k-50k, 95.1% for AGIs $50k-75k, 96.7% for AGIs $75k-100k, 95.3% for AGIs $100k-200k, 85.7% for AGIs over 200k)
Averages for the 2012 tax year for zip code 95360, filed in 2013:
Average Adjusted Gross Income (AGI) in 2012: $42,932 (Individual Income Tax Returns)
Here:
$42,932
State:
$72,726
Salary/wage: $37,852 (reported on 88.2% of returns)
Here:
$37,852
State:
$59,079
(% of AGI for various income ranges: 78.0% for AGIs below $25k, 83.4% for AGIs $25k-50k, 85.3% for AGIs $50k-75k, 84.3% for AGIs $75k-100k, 80.4% for AGIs $100k-200k, 29.3% for AGIs over 200k)
Taxable interest for individuals: $887 (reported on 28.5% of returns)
This zip code:
$887
California:
$2,146
(% of AGI for various income ranges: 0.4% for AGIs below $25k, 0.5% for AGIs $25k-50k, 0.4% for AGIs $75k-100k, 0.8% for AGIs $100k-200k, 2.1% for AGIs over 200k)
Ordinary dividends: $2,682 (reported on 6.1% of returns)
Here:
$2,682
State:
$9,308
(% of AGI for various income ranges: 0.4% for AGIs below $25k, 0.3% for AGIs $25k-50k, 0.3% for AGIs $50k-75k, 0.2% for AGIs $75k-100k, 0.3% for AGIs $100k-200k, 1.3% for AGIs over 200k)
Net capital gain/loss in AGI: +$15,004 (reported on 5.5% of returns)
Here:
+$15,004
State:
+$30,460
(% of AGI for various income ranges: 1.5% for AGIs $50k-75k, 1.2% for AGIs $75k-100k, 1.1% for AGIs $100k-200k, 17.0% for AGIs over 200k)
Profit/loss from business: +$9,998 (reported on 11.4% of returns)
Here:
+$9,998
State:
+$17,064
(% of AGI for various income ranges: 5.7% for AGIs below $25k, 3.1% for AGIs $25k-50k, 2.4% for AGIs $50k-75k, 1.7% for AGIs $75k-100k, 2.3% for AGIs $100k-200k)
Taxable individual retirement arrangement distribution: $14,200 (reported on 4.8% of returns)
95360:
$14,200
California:
$19,557
(% of AGI for various income ranges: 1.1% for AGIs below $25k, 1.3% for AGIs $25k-50k, 1.1% for AGIs $50k-75k, 2.2% for AGIs $75k-100k, 3.3% for AGIs $100k-200k)
Total itemized deductions: $21,019 (26% of AGI, reported on 27.9% of returns)
Here:
$21,019
State:
$34,004
Here:
26.4% of AGI
State:
22.7% of AGI
(% of AGI for various income ranges: 5.9% for AGIs below $25k, 10.8% for AGIs $25k-50k, 15.7% for AGIs $50k-75k, 16.1% for AGIs $75k-100k, 17.5% for AGIs $100k-200k, 15.8% for AGIs over 200k)
Charity contributions: $2,142 (reported on 21.5% of returns)
Here:
$2,142
State:
$4,659
(% of AGI for various income ranges: 0.3% for AGIs below $25k, 0.8% for AGIs $25k-50k, 1.1% for AGIs $50k-75k, 1.4% for AGIs $75k-100k, 1.8% for AGIs $100k-200k, 0.9% for AGIs over 200k)
Taxes paid: $5,993 (reported on 27.9% of returns)
95360:
$5,993
State:
$14,448
(% of AGI for various income ranges: 1.0% for AGIs below $25k, 2.1% for AGIs $25k-50k, 3.6% for AGIs $50k-75k, 4.5% for AGIs $75k-100k, 5.7% for AGIs $100k-200k, 9.0% for AGIs over 200k)
Earned income credit: $2,458 (reported on 26.1% of returns)
Here:
$2,458
State:
$2,286
(% of AGI for various income ranges: 8.2% for AGIs below $25k, 1.8% for AGIs $25k-50k)
Percentage of individuals using paid preparers for their 2012 taxes: 70.0%
Here:
70%
State:
64%
(% for various income ranges: 67.7% for AGIs below $25k, 74.4% for AGIs $25k-50k, 71.4% for AGIs $50k-75k, 64.7% for AGIs $75k-100k, 64.3% for AGIs $100k-200k, 100.0% for AGIs over 200k)
Averages for the 2004 tax year for zip code 95360, filed in 2005:
Average Adjusted Gross Income (AGI) in 2004: $43,168 (Individual Income Tax Returns)
Here:
$43,168
State:
$58,600
Salary/wage: $37,301 (reported on 89.9% of returns)
Here:
$37,301
State:
$49,455
(% of AGI for various income ranges: 117.2% for AGIs below $10k, 81.5% for AGIs $10k-25k, 87.3% for AGIs $25k-50k, 89.3% for AGIs $50k-75k, 90.2% for AGIs $75k-100k, 45.5% for AGIs over 100k)
Taxable interest for individuals: $1,160 (reported on 36.5% of returns)
This zip code:
$1,160
California:
$2,365
(% of AGI for various income ranges: 4.7% for AGIs below $10k, 1.1% for AGIs $10k-25k, 0.9% for AGIs $25k-50k, 0.5% for AGIs $50k-75k, 0.4% for AGIs $75k-100k, 1.5% for AGIs over 100k)
Taxable dividends: $1,339 (reported on 9.8% of returns)
Here:
$1,339
State:
$4,746
(% of AGI for various income ranges: 1.4% for AGIs below $10k, 0.5% for AGIs $10k-25k, 0.4% for AGIs $25k-50k, 0.2% for AGIs $50k-75k, 0.1% for AGIs $75k-100k, 0.3% for AGIs over 100k)
Net capital gain/loss: +$24,406 (reported on 8.1% of returns)
Here:
+$24,406
State:
+$23,418
(% of AGI for various income ranges: 4.2% for AGIs below $10k, -0.1% for AGIs $10k-25k, 0.1% for AGIs $25k-50k, 1.4% for AGIs $50k-75k, 1.3% for AGIs $75k-100k, 16.0% for AGIs over 100k)
Profit/loss from business: +$9,688 (reported on 11.0% of returns)
Here:
+$9,688
State:
+$16,826
(% of AGI for various income ranges: 14.5% for AGIs below $10k, 4.1% for AGIs $10k-25k, 3.2% for AGIs $25k-50k, 1.3% for AGIs $50k-75k, 0.9% for AGIs $75k-100k, 2.5% for AGIs over 100k)
Profit/loss from farming: +$16,327 (reported on 1.4% of returns)
Here:
+$16,327
State:
-$7,562
(% of AGI for various income ranges: -5.3% for AGIs below $10k, -0.1% for AGIs $25k-50k, 0.3% for AGIs $50k-75k, 2.3% for AGIs over 100k)
IRA payment deduction: $3,180 (reported on 1.6% of returns)
95360:
$3,180
California:
$3,192
Self-employed pension: $12,000 (reported on 0.3% of returns)
Here:
$12,000
California:
$17,688
Total itemized deductions: $19,934 (26% of AGI, reported on 37.0% of returns)
Here:
$19,934
State:
$28,113
Here:
26.1% of AGI
State:
25.3% of AGI
(% of AGI for various income ranges: 16.8% for AGIs below $10k, 10.1% for AGIs $10k-25k, 16.9% for AGIs $25k-50k, 22.8% for AGIs $50k-75k, 21.3% for AGIs $75k-100k, 12.2% for AGIs over 100k)
Charity contributions deductions: $1,730 (2% of AGI, reported on 32.2% of returns)
Here:
$1,730
State:
$3,923
Here:
2.2% of AGI
State:
3.3% of AGI
(% of AGI for various income ranges: 0.6% for AGIs below $10k, 0.7% for AGIs $10k-25k, 1.2% for AGIs $25k-50k, 1.6% for AGIs $50k-75k, 1.8% for AGIs $75k-100k, 1.1% for AGIs over 100k)
Total tax: $5,628 (reported on 66.6% of returns)
95360:
$5,628
State:
$10,761
(% of AGI for various income ranges: 3.3% for AGIs below $10k, 3.0% for AGIs $10k-25k, 4.5% for AGIs $25k-50k, 6.4% for AGIs $50k-75k, 8.7% for AGIs $75k-100k, 17.6% for AGIs over 100k)
Earned income credit: $1,831 (reported on 20.6% of returns)
Here:
$1,831
State:
$1,763
Percentage of individuals using paid preparers for their 2004 taxes: 69.7%
Here:
70%
State:
66%
(% for various income ranges: 62.1% for AGIs below $10k, 71.4% for AGIs $10k-25k, 72.6% for AGIs $25k-50k, 69.0% for AGIs $50k-75k, 70.3% for AGIs $75k-100k, 73.5% for AGIs over 100k)
Household received Food Stamps/SNAP in the past 12 months: 567 Household did not receive Food Stamps/SNAP in the past 12 months: 3,602
Women who had a birth in the past 12 months: 87 (51 now married, 36 unmarried) Women who did not have a birth in the past 12 months: 3,184 (1,329 now married, 1,852 unmarried)
Housing units in zip code 95360 with a mortgage: 2,170 (113 second mortgage, 75 both second mortgage and home equity loan) Median monthly owner costs for units with a mortgage: $1,826 Median monthly owner costs for units without a mortgage: $473
Residents with income below the poverty level in 2022:
This zip code:
9.5%
Whole state:
12.2%
Residents with income below 50% of the poverty level in 2022:
This zip code:
7.2%
Whole state:
6.2%
Median number of rooms in houses and condos:
Here:
6.1
State:
6.0
Median number of rooms in apartments:
Here:
4.5
State:
3.9
Notable locations in this zip code not listed on our city pages
Notable locations in zip code 95360: Richey Camp (A), Highway 33 Egg Ranch (B), Beltran Farms (C), Fink Road Landfill (D), Miller Ranch (E), Outside Creek Elementary School (F), Isom Ranch (G), Gill Ranch (H), Fremont Ford (I), Mikes Peak Lookout (J), Lower Ranch (K), Newman Gun Club (L), Newman Youth Center (M), Newman Memorial Center (N), Newman Branch Stanislaus County Free Library (O), West Side Community Ambulance Newman (P), West Stanislaus County Fire Protection District - City of Newman Fire Department (Q). Display/hide their locations on the map
Streams, rivers, and creeks: Hartman Creek (A), Merced River (B), Mud Slough (C), South Fork Orestimba Creek (D), Richard Creek (E), Los Banos Creek (F), Sheep Thief Creek (G), Robison Creek (H), Red Creek (I). Display/hide their locations on the map
In group quarters: 66 (-1 institutionalized population)
Size of family households: 878 2-persons, 932 3-persons, 867 4-persons, 458 5-persons, 254 6-persons, 42 7-or-more-persons
Size of nonfamily households: 549 1-person, 124 2-persons, 16 3-persons
2,260 married couples with children.
746 single-parent households (281 men, 465 women).
38.7% of residents of 95360 zip code speak English at home.
53.0% of residents speak Spanish at home (63% very well, 12% well, 17% not well, 8% not at all).
6.6% of residents speak other Indo-European language at home (74% very well, 20% well, 6% not well).
1.5% of residents speak Asian or Pacific Island language at home (10% very well, 17% not well, 73% not at all).
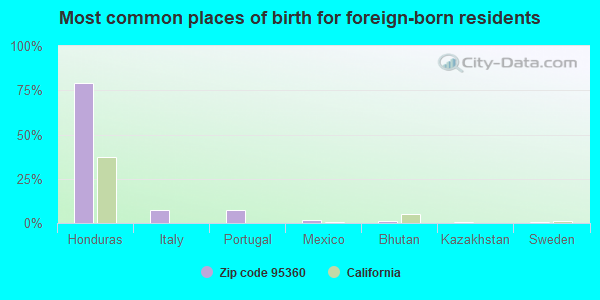
Foreign born population: 3,699 (27.1%) (43.4% of them are naturalized citizens)
This zip code:
27.1%
Whole state:
26.7%
79%Honduras
7%Italy
7%Portugal
2%Mexico
1%Bhutan
1%Kazakhstan
1%Sweden
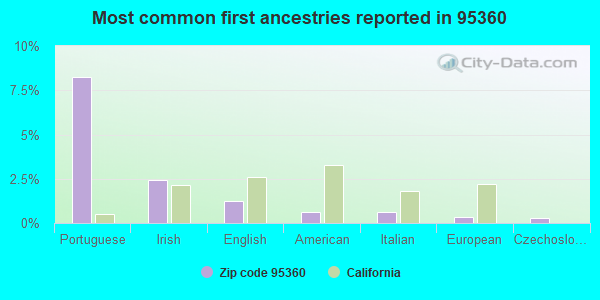
8%Portuguese
2%Irish
1%English
1%American
1%Italian
0%European
0%Czechoslovakian
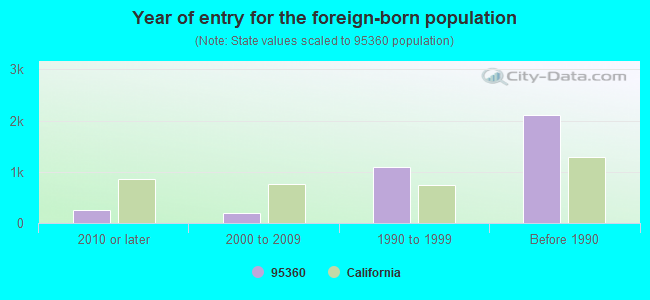
Year of entry for the foreign-born population
2632010 or later
1942000 to 2009
1,0941990 to 1999
2,110Before 1990
Major facilities with environmental interests located in this zip code:
F AND A DAIRY OF CALIFORNIA INCORPORATED (691 INYO AVENUE in NEWMAN, CA)
ENFORCEMENT/COMPLIANCE ACTIVITY (Integrated Compliance Information System) - ICIS-09-2000-0360, FORMAL ENFORCEMENT ACTION (Integrated Compliance Information System) - ICIS-09-2000-0360, FORMAL ENFORCEMENT ACTION COMPLIANCE ACTIVITY (Tracking inspections of insecticide, fungicide, and rodenticide, and toxic substances) CRITERIA AND HAZARDOUS AIR POLLUTANT INVENTORY (Inventory of air pollution sources) National Pollutant Discharge Elimination System NON-MAJOR (Tracking pollutant discharge elimination systems) - permit TRI REPORTER (Tracking of toxic chemicals releasing facilities) Business SIC classification: DAIRY FARMS; NATURAL, PROCESSED, AND IMITATION CHEESE Alternative names: A & F DAIRY, F & A DAIRY
GARTON TRACTOR (2100 L ST in NEWMAN, CA)
STATE MASTER (California - Hazardous Waste Tracking) - HAZARDOU WASTE PROGRAM Small Quantity Generators, between 100 kg and 1000 kg of hazardous waste/month (Resource Conservation and Recovery Act (tracking hazardous waste)) - notification Organizations: GARTON TRACTOR, INC (CONTACT/OWNER)
J STEVENSON CORP (79029 N RIVER RD in NEWMAN, CA)
STATE MASTER (California - Hazardous Waste Tracking) - HAZARDOU WASTE PROGRAM Small Quantity Generators, between 100 kg and 1000 kg of hazardous waste/month (Resource Conservation and Recovery Act (tracking hazardous waste)) Alternative names: JAMES J STEVINSON A CORP
NEW BEGINNINGS COMMUNITY DAY (1315 YOLO ST. in NEWMAN, CA)
(National Center for Education Statistics) - STATE ID-6118343 Organizations: NEWMAN-CROWS LANDING UNIFIED (SCHOOL DISTRICT)
NEWMAN-CROWS LANDING INDEPENDENT STUDY (890 MAIN ST. in NEWMAN, CA)
(National Center for Education Statistics) - STATE ID-5030184 Organizations: NEWMAN-CROWS LANDING UNIFIED (SCHOOL DISTRICT)
ESTATE OF J W MOWRY (1259 T ST in NEWMAN, CA)
(Resource Conservation and Recovery Act (tracking hazardous waste)) Organizations: ESTATE OF JOHN W MOWRY (CONTACT/OWNER)
NEWMAN, CITY OF (2600 HILLS FERRY RD in NEWMAN, CA)
National Pollutant Discharge Elimination System NON-MAJOR (Tracking pollutant discharge elimination systems) - permit Organizations: CITY OF NEWMAN (CONTACT/OWNER)
CALIFORNIA NORTHERN RAILROAD (CFNR STATION OF NEWMAN in NEWMAN, CA)
(Resource Conservation and Recovery Act (tracking hazardous waste))
HAROLD MATTOS (171 ANDERSON RD in NEWMAN, CA)
Small Quantity Generators, between 100 kg and 1000 kg of hazardous waste/month (Resource Conservation and Recovery Act (tracking hazardous waste))
CERVUTTI BROS (26118 MCCLINTOCK RD in NEWMAN, CA)
Small Quantity Generators, between 100 kg and 1000 kg of hazardous waste/month (Resource Conservation and Recovery Act (tracking hazardous waste)) Organizations: WILLIAM P CERUTTI (CONTACT/OWNER)
MICHAEL VASTBINDER (1969 S ST in NEWMAN, CA)
Small Quantity Generators, between 100 kg and 1000 kg of hazardous waste/month (Resource Conservation and Recovery Act (tracking hazardous waste))
MODEL CLEANERS (1501 O ST in NEWMAN, CA)
Small Quantity Generators, between 100 kg and 1000 kg of hazardous waste/month (Resource Conservation and Recovery Act (tracking hazardous waste)) - notification Organizations: HAROLD BEARD (CONTACT/OWNER)
ED AMARAL TRANSPORT INC (28424 DRAPER RD in NEWMAN, CA)
TRANSPORTER (Resource Conservation and Recovery Act (tracking hazardous waste)) Organizations: EDWARD AMARAL (CONTACT/OWNER)
Housing units lacking complete plumbing facilities: 1.1% Housing units lacking complete kitchen facilities: 3.1%
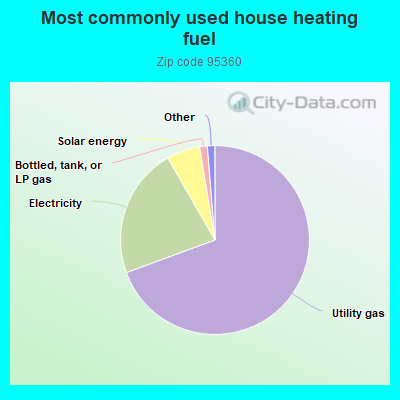
69.4%Utility gas
22.3%Electricity
5.7%Solar energy
1.3%Bottled, tank, or LP gas
0.7%Wood
0.7%No fuel used
Population in 1990: 5,313. Population change in the 1990s: +3,172 (+59.7%).
Place of birth for U.S.-born residents:
This state: 9,225
Northeast: 223
Midwest: 102
South: 192
West: 179
55% of the 95360 zip code residents lived in the same house 5 years ago. Out of people who lived in different houses, 54% lived in this county. Out of people who lived in different counties, 50% lived in California.
96% of the 95360 zip code residents lived in the same house 1 year ago. Out of people who lived in different houses, 41% moved from this county. Out of people who lived in different houses, 67% moved from different county within same state.
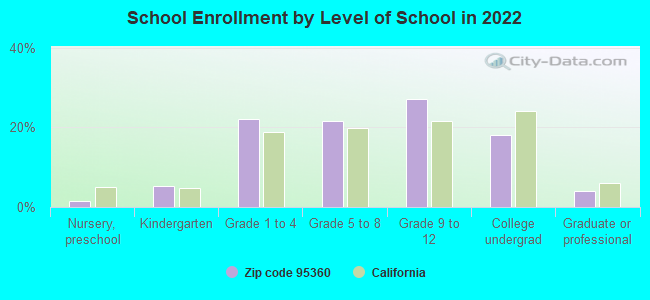
Private vs. public school enrollment:
Students in private schools in grades 1 to 8 (elementary and middle school): 12
Here:
0.8%
California:
10.5%
Students in private schools in grades 9 to 12 (high school):
Here:
0.0%
California:
8.5%
Students in private undergraduate colleges: 114
Here:
17.5%
California:
15.9%
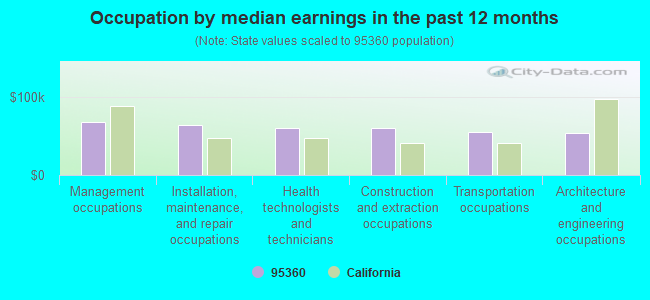
Occupation by median earnings in the past 12 months ($)
68,839Management occupations
64,665Installation, maintenance, and repair occupations
60,705Health technologists and technicians
60,503Construction and extraction occupations
54,870Transportation occupations
54,080Architecture and engineering occupations
Companies with federal contracts located in this zip code:
KAILUA KONA SELF STORAGE, LLC. (1350 O ST in NEWMAN, CA; small business) : $101,557 in 37 contractsfrom 2003 to 2006
Contracts for Lease or Rental of Facilities -- Office Buildings by Public Buildings Service Signed by year:2000: $0; 2001: $0; 2002: $0; 2003: $39,061; 2004: $7,812; 2005: $33,852; 2006: $20,832.
Biggest contracts:
$7,813 with Public Buildings Service for Lease or Rental of Facilities -- Office Buildings. Taking place in HI. Signed on 2003-09-15. Completion date: 2003-09-15.
$2,604, same as above.Signed on 2006-04-01. Completion date: 2006-09-30.
$2,604, same as above.Signed on 2006-04-01. Completion date: 2006-09-30.
$2,604, same as above.Signed on 2006-01-01. Completion date: 2006-09-30.
R-SAFE (27431 HWY 33 , UNIT 8A in NEWMAN, CA; small business)
$4,783 with Air Force for Sets, Kits, and Outfits of Measuring Tools. Signed on 2005-05-13. Completion date: 2005-06-15.
Top industries in this zip code by the number of employees in 2005:
Professional, Scientific, and Technical Services: Building Inspection Services (50-99 employees: 1 establishment)
Health Care and Social Assistance: Nursing Care Facilities (50-99: 1)
Accommodation and Food Services: Limited-Service Restaurants (20-49: 1, 1-4: 1)
People in group quarters in 2010:
66 people in nursing facilities/skilled-nursing facilities
People in group quarters in 2000:
66 people in nursing homes
Fatal accident statistics in 2014:
Fatal accident count: 3
Vehicles involved in fatal accidents: 6
Fatal accidents caused by drunken drivers: 1
Fatalities: 3
Persons involved in fatal accidents: 11
Pedestrians involved in fatal accidents: 0
Fatal accident statistics in 2013:
Fatal accident count: 1
Vehicles involved in fatal accidents: 1
Fatal accidents caused by drunken drivers: 1
Fatalities: 1
Persons involved in fatal accidents: 1
Pedestrians involved in fatal accidents: 0
Home Mortgage Disclosure Act Aggregated Statistics For Year 2009 (Based on 1 full and 2 partial tracts)
A) FHA, FSA/RHS & VA Home Purchase Loans
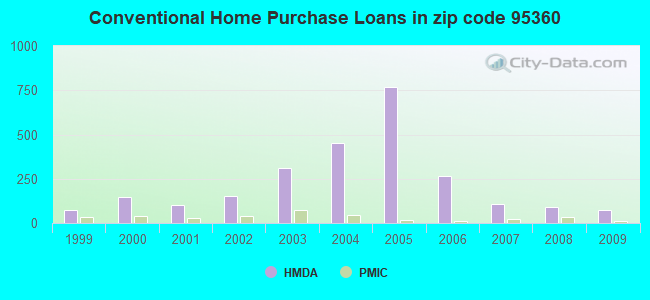
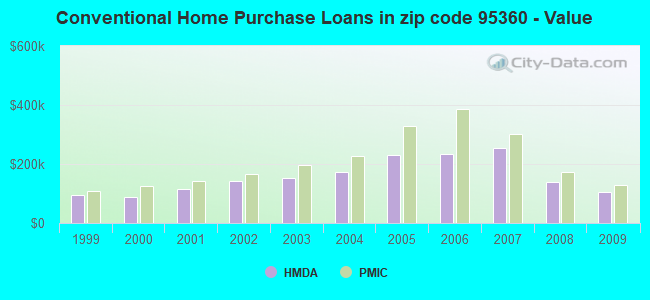
B) Conventional Home Purchase Loans
C) Refinancings
D) Home Improvement Loans
F) Non-occupant Loans on < 5 Family Dwellings (A B C & D)
G) Loans On Manufactured Home Dwelling (A B C & D)
Number
Average Value
Number
Average Value
Number
Average Value
Number
Average Value
Number
Average Value
Number
Average Value
LOANS ORIGINATED
192
$134,778
75
$106,588
62
$161,938
0
$0
31
$99,032
1
$86,550
APPLICATIONS APPROVED, NOT ACCEPTED
20
$134,100
8
$128,125
12
$143,988
2
$35,000
3
$84,333
0
$0
APPLICATIONS DENIED
36
$153,611
17
$120,706
56
$173,575
4
$77,250
12
$92,148
0
$0
APPLICATIONS WITHDRAWN
18
$148,156
14
$99,571
24
$154,666
1
$2,010
7
$77,571
0
$0
FILES CLOSED FOR INCOMPLETENESS
2
$91,500
4
$121,250
6
$117,727
0
$0
2
$57,500
0
$0
Aggregated Statistics For Year 2008 (Based on 1 full and 2 partial tracts)
A) FHA, FSA/RHS & VA Home Purchase Loans
B) Conventional Home Purchase Loans
C) Refinancings
D) Home Improvement Loans
E) Loans on Dwellings For 5+ Families
F) Non-occupant Loans on < 5 Family Dwellings (A B C & D)
G) Loans On Manufactured Home Dwelling (A B C & D)
Number
Average Value
Number
Average Value
Number
Average Value
Number
Average Value
Number
Average Value
Number
Average Value
Number
Average Value
LOANS ORIGINATED
151
$182,212
92
$139,199
56
$170,004
12
$62,583
0
$0
35
$135,640
2
$194,565
APPLICATIONS APPROVED, NOT ACCEPTED
13
$192,538
28
$170,708
26
$206,923
3
$64,000
0
$0
1
$399,000
3
$39,710
APPLICATIONS DENIED
19
$202,673
31
$176,635
156
$243,759
27
$107,355
1
$710,000
13
$240,154
2
$179,895
APPLICATIONS WITHDRAWN
25
$176,504
23
$166,057
39
$217,751
2
$209,000
0
$0
8
$110,000
1
$291,860
FILES CLOSED FOR INCOMPLETENESS
3
$125,333
3
$194,333
10
$222,800
2
$122,500
0
$0
0
$0
0
$0
Aggregated Statistics For Year 2007 (Based on 1 full and 2 partial tracts)
A) FHA, FSA/RHS & VA Home Purchase Loans
B) Conventional Home Purchase Loans
C) Refinancings
D) Home Improvement Loans
E) Loans on Dwellings For 5+ Families
F) Non-occupant Loans on < 5 Family Dwellings (A B C & D)
G) Loans On Manufactured Home Dwelling (A B C & D)
Number
Average Value
Number
Average Value
Number
Average Value
Number
Average Value
Number
Average Value
Number
Average Value
Number
Average Value
LOANS ORIGINATED
9
$263,390
108
$252,604
244
$238,768
49
$122,498
0
$0
35
$263,229
1
$211,000
APPLICATIONS APPROVED, NOT ACCEPTED
0
$0
62
$205,454
109
$256,319
19
$94,776
0
$0
21
$244,395
1
$41,000
APPLICATIONS DENIED
0
$0
61
$226,334
356
$273,647
53
$149,271
1
$12,580
42
$260,262
4
$203,000
APPLICATIONS WITHDRAWN
2
$293,000
18
$222,492
114
$253,781
9
$108,300
0
$0
14
$201,786
0
$0
FILES CLOSED FOR INCOMPLETENESS
0
$0
10
$258,900
63
$273,404
3
$265,547
0
$0
0
$0
0
$0
Aggregated Statistics For Year 2006 (Based on 1 full and 2 partial tracts)
A) FHA, FSA/RHS & VA Home Purchase Loans
B) Conventional Home Purchase Loans
C) Refinancings
D) Home Improvement Loans
F) Non-occupant Loans on < 5 Family Dwellings (A B C & D)
G) Loans On Manufactured Home Dwelling (A B C & D)
Number
Average Value
Number
Average Value
Number
Average Value
Number
Average Value
Number
Average Value
Number
Average Value
LOANS ORIGINATED
2
$307,500
266
$234,893
558
$246,338
91
$123,879
60
$258,462
5
$239,376
APPLICATIONS APPROVED, NOT ACCEPTED
0
$0
59
$209,234
140
$242,596
13
$139,700
17
$241,491
0
$0
APPLICATIONS DENIED
1
$312,000
99
$242,101
346
$257,533
75
$113,616
42
$229,722
4
$181,805
APPLICATIONS WITHDRAWN
0
$0
49
$233,724
207
$254,806
34
$193,947
15
$189,880
1
$260,000
FILES CLOSED FOR INCOMPLETENESS
1
$260,000
10
$244,490
44
$278,850
1
$20,000
3
$295,333
0
$0
Aggregated Statistics For Year 2005 (Based on 1 full and 2 partial tracts)
A) FHA, FSA/RHS & VA Home Purchase Loans
B) Conventional Home Purchase Loans
C) Refinancings
D) Home Improvement Loans
E) Loans on Dwellings For 5+ Families
F) Non-occupant Loans on < 5 Family Dwellings (A B C & D)
G) Loans On Manufactured Home Dwelling (A B C & D)
Number
Average Value
Number
Average Value
Number
Average Value
Number
Average Value
Number
Average Value
Number
Average Value
Number
Average Value
LOANS ORIGINATED
1
$138,000
770
$230,024
656
$223,346
102
$138,850
1
$300,000
126
$235,139
3
$46,543
APPLICATIONS APPROVED, NOT ACCEPTED
0
$0
108
$235,511
111
$224,079
10
$88,200
0
$0
18
$218,608
1
$87,000
APPLICATIONS DENIED
0
$0
153
$222,092
311
$235,347
82
$111,441
1
$36,000
37
$224,811
11
$142,463
APPLICATIONS WITHDRAWN
0
$0
159
$233,649
277
$229,786
33
$219,781
0
$0
34
$192,565
4
$229,400
FILES CLOSED FOR INCOMPLETENESS
0
$0
32
$216,742
77
$230,633
5
$60,000
0
$0
5
$190,600
0
$0
Aggregated Statistics For Year 2004 (Based on 1 full and 2 partial tracts)
A) FHA, FSA/RHS & VA Home Purchase Loans
B) Conventional Home Purchase Loans
C) Refinancings
D) Home Improvement Loans
E) Loans on Dwellings For 5+ Families
F) Non-occupant Loans on < 5 Family Dwellings (A B C & D)
G) Loans On Manufactured Home Dwelling (A B C & D)
Number
Average Value
Number
Average Value
Number
Average Value
Number
Average Value
Number
Average Value
Number
Average Value
Number
Average Value
LOANS ORIGINATED
4
$225,500
451
$173,966
467
$172,069
56
$111,169
1
$138,880
57
$171,084
4
$159,560
APPLICATIONS APPROVED, NOT ACCEPTED
0
$0
69
$173,921
104
$165,601
7
$95,714
0
$0
6
$155,128
0
$0
APPLICATIONS DENIED
0
$0
124
$174,895
215
$169,243
47
$98,802
0
$0
19
$139,692
1
$41,770
APPLICATIONS WITHDRAWN
1
$192,000
116
$177,842
158
$165,618
24
$108,650
0
$0
10
$175,000
0
$0
FILES CLOSED FOR INCOMPLETENESS
0
$0
10
$185,577
60
$186,160
0
$0
0
$0
1
$150,000
0
$0
Aggregated Statistics For Year 2003 (Based on 1 full and 2 partial tracts)
A) FHA, FSA/RHS & VA Home Purchase Loans
B) Conventional Home Purchase Loans
C) Refinancings
D) Home Improvement Loans
E) Loans on Dwellings For 5+ Families
F) Non-occupant Loans on < 5 Family Dwellings (A B C & D)
Number
Average Value
Number
Average Value
Number
Average Value
Number
Average Value
Number
Average Value
Number
Average Value
LOANS ORIGINATED
30
$199,461
308
$153,334
595
$133,442
30
$37,627
2
$568,500
49
$128,070
APPLICATIONS APPROVED, NOT ACCEPTED
4
$132,932
42
$149,270
91
$141,264
7
$26,000
0
$0
11
$134,272
APPLICATIONS DENIED
5
$122,128
61
$149,345
253
$148,359
25
$40,384
0
$0
14
$169,214
APPLICATIONS WITHDRAWN
5
$157,712
28
$176,950
204
$150,777
1
$17,610
0
$0
4
$129,000
FILES CLOSED FOR INCOMPLETENESS
0
$0
10
$157,670
35
$137,298
2
$78,000
0
$0
3
$112,900
Aggregated Statistics For Year 2002 (Based on 1 full tract)
A) FHA, FSA/RHS & VA Home Purchase Loans
B) Conventional Home Purchase Loans
C) Refinancings
D) Home Improvement Loans
F) Non-occupant Loans on < 5 Family Dwellings (A B C & D)
Number
Average Value
Number
Average Value
Number
Average Value
Number
Average Value
Number
Average Value
LOANS ORIGINATED
12
$168,250
152
$143,178
362
$124,318
29
$33,552
24
$102,208
APPLICATIONS APPROVED, NOT ACCEPTED
0
$0
20
$137,400
55
$130,000
14
$32,786
3
$133,667
APPLICATIONS DENIED
0
$0
25
$125,760
179
$114,358
33
$30,121
9
$110,556
APPLICATIONS WITHDRAWN
0
$0
11
$130,364
133
$137,256
10
$20,900
1
$164,000
FILES CLOSED FOR INCOMPLETENESS
0
$0
5
$75,000
21
$128,571
0
$0
0
$0
Aggregated Statistics For Year 2001 (Based on 1 full tract)
A) FHA, FSA/RHS & VA Home Purchase Loans
B) Conventional Home Purchase Loans
C) Refinancings
D) Home Improvement Loans
F) Non-occupant Loans on < 5 Family Dwellings (A B C & D)
Number
Average Value
Number
Average Value
Number
Average Value
Number
Average Value
Number
Average Value
LOANS ORIGINATED
33
$139,273
104
$114,923
330
$117,430
14
$29,214
16
$101,062
APPLICATIONS APPROVED, NOT ACCEPTED
1
$175,000
17
$86,000
48
$123,250
5
$37,200
4
$60,500
APPLICATIONS DENIED
2
$132,000
26
$86,654
206
$97,786
17
$30,706
5
$70,400
APPLICATIONS WITHDRAWN
1
$87,000
14
$124,214
139
$119,036
7
$25,714
6
$107,667
FILES CLOSED FOR INCOMPLETENESS
0
$0
4
$72,750
31
$115,839
1
$26,000
2
$92,500
Aggregated Statistics For Year 2000 (Based on 1 full tract)
A) FHA, FSA/RHS & VA Home Purchase Loans
B) Conventional Home Purchase Loans
C) Refinancings
D) Home Improvement Loans
E) Loans on Dwellings For 5+ Families
F) Non-occupant Loans on < 5 Family Dwellings (A B C & D)
Number
Average Value
Number
Average Value
Number
Average Value
Number
Average Value
Number
Average Value
Number
Average Value
LOANS ORIGINATED
64
$119,156
147
$88,986
72
$79,500
18
$36,667
2
$146,500
11
$76,364
APPLICATIONS APPROVED, NOT ACCEPTED
4
$110,500
14
$87,357
23
$76,130
15
$37,800
0
$0
2
$38,000
APPLICATIONS DENIED
5
$107,800
31
$86,742
98
$67,622
27
$35,815
0
$0
5
$34,000
APPLICATIONS WITHDRAWN
5
$125,600
16
$100,188
59
$87,271
6
$26,000
0
$0
1
$76,000
FILES CLOSED FOR INCOMPLETENESS
1
$111,000
0
$0
15
$89,267
0
$0
0
$0
1
$35,000
Aggregated Statistics For Year 1999 (Based on 1 full and 1 partial tracts)
A) FHA, FSA/RHS & VA Home Purchase Loans
B) Conventional Home Purchase Loans
C) Refinancings
D) Home Improvement Loans
E) Loans on Dwellings For 5+ Families
F) Non-occupant Loans on < 5 Family Dwellings (A B C & D)
Detailed PMIC statistics for the following Tracts:0034.00
, 0035.00
2005 - 2018 National Fire Incident Reporting System (NFIRS) incidents
Based on the data from the years 2005 - 2018 the average number of fires per year is 17. The highest number of reported fire incidents - 60 took place in 2017, and the least - 1 in 2005. The data has a growing trend.
When looking into fire subcategories, the most incidents belonged to: Outside Fires (56.0%), and Mobile Property/Vehicle Fires (22.4%).
Fire incident types reported to NFIRS in Zip Code 95360


+$16,327
-$7,562
(% of AGI for various income ranges: -5.3% for AGIs below $10k, -0.1% for AGIs $25k-50k, 0.3% for AGIs $50k-75k, 2.3% for AGIs over 100k) Nearest zip codes: 95363, 95313, 95387, 95322, 95385, 95358.


 Based on the data from the years 2005 - 2018 the average number of fires per year is 17. The highest number of reported fire incidents - 60 took place in 2017, and the least - 1 in 2005. The data has a growing trend.
 When looking into fire subcategories, the most incidents belonged to: Outside Fires (56.0%), and Mobile Property/Vehicle Fires (22.4%).