Patterson: Fire Incidents, Louisiana (LA)
Where are fire incidents reported in Patterson, LA
Something went wrong! Please refresh the page.
|
| |||||||||||||||||||||||||||||||||||||||||||||||||||||||||||||||||||||||||||||||||||||||||||||||||||||||||||||
| Other | 77 | |||||||||||||||||||||||||||||||||||||||||||||||||||||||||||||||||||||||||||||||||||||||||||||||||||||||||||||
2002 - 2018 National Fire Incident Reporting System (NFIRS) incidents
- Incident types reported to NFIRS in Patterson, LA
- 27135.8%Fire
- 26635.1%Hazardous Condition
- 15119.9%Rescue & EMS
- 486.3%False Alarm
- 131.7%Service Call
- 70.9%Good Intent Call
- 10.1%Severe Weather
- 10.1%Special Incident
- Fire incident types reported to NFIRS in Patterson, LA
- 11542.4%Structure Fires
- 8431.0%Outside Fires
- 4717.3%Mobile Property/Vehicle Fires
- 259.2%Other
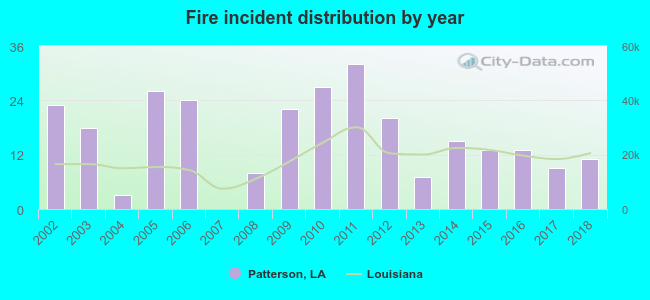 According to the data from the years 2002 - 2018 the average number of fire incidents per year is 16. The highest number of fire incidents - 32 took place in 2011, and the least - 0 in 2007. The data has a declining trend.
The average number of yearly fire incidents per 10k residents in Patterson, LA compared to nearest cities:
(Note: Based on data for the last 3 years, including only cities with population 5,000 and above)
| Patterson: | 18.0 |
| Morgan City: | 8.9 |
| Franklin: | 76.9 |
| Jeanerette: | 144.7 |
| Schriever: | 20.9 |
| Central: | 0.7 |
| Thibodaux: | 55.5 |
| Gray: | 16.1 |
| Donaldsonville: | 74.7 |
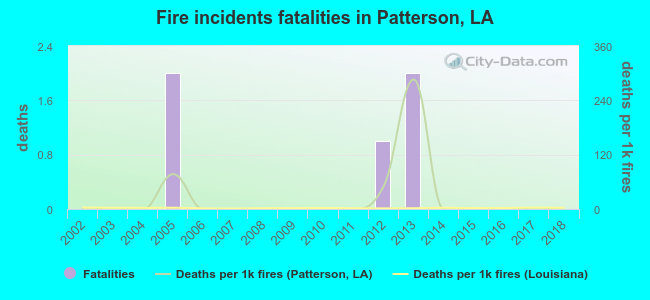 Based on the data from the years 2002 - 2018 the average number of fire-related yearly deaths is 0. The highest number of deaths - 2 took place in 2005, and the lowest - 0 in 2002. The data has a constant trend.
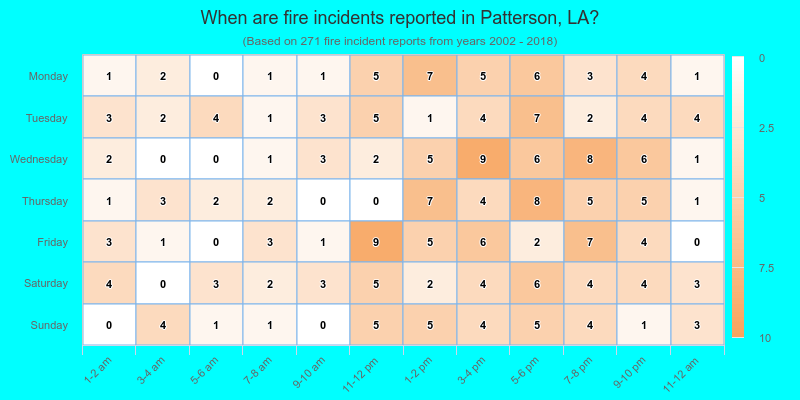
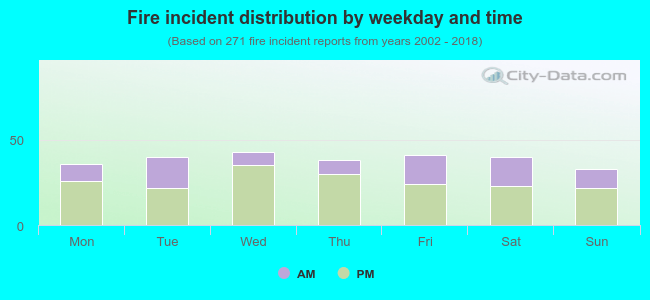 32.8% incidents where reported in the morning and 67.2% in the evening. The most fires (15.9%) took place on Wednesday, and the least (12.2%) on Sunday.
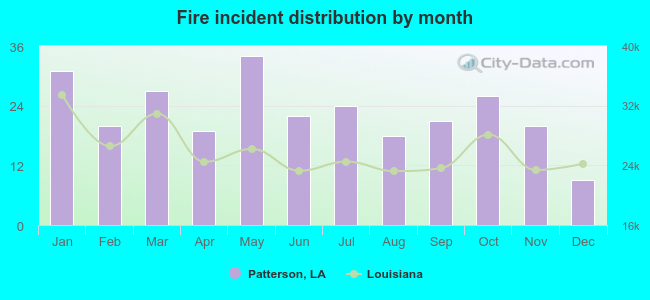 According to the 271 reports from years 2002 - 2018 most fires (12.5%) took place during May, and the least (3.3%) in December.
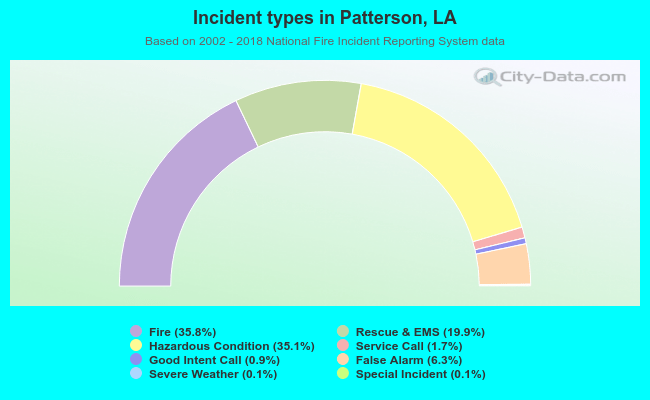 Out of all 758 cases reported during the years 2002 - 2018, the most belonged to the categories: Fire (35.8%), Rescue & EMS (35.1%), and Overpressure Rupture (19.9%).
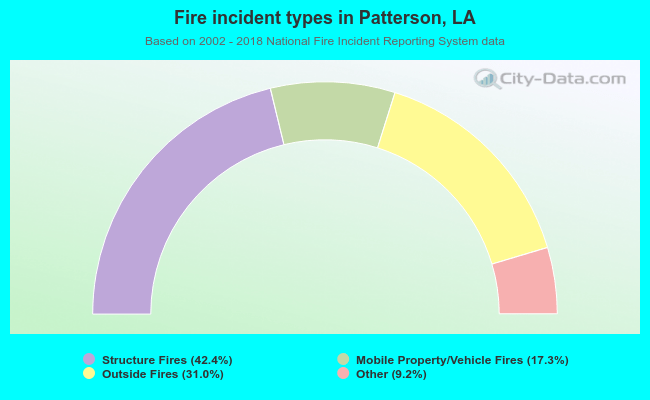 When looking into fire subcategories, the most incidents belonged to: Structure Fires (42.4%), and Outside Fires (31.0%).