Pepper Pike: Fire Incidents, Ohio (OH)
Where are fire incidents reported in Pepper Pike, OH
Something went wrong! Please refresh the page.
|
| |||||||||||||||||||||||||||||||||||||||||||||||||||||||||||||||||||||||||||||||||||||||||||||||||||||||||||||
2002 - 2018 National Fire Incident Reporting System (NFIRS) incidents
- Incident types reported to NFIRS in Pepper Pike, OH
- 2,50848.6%Rescue & EMS
- 1,03620.1%False Alarm
- 82716.0%Hazardous Condition
- 2915.6%Fire
- 2865.5%Service Call
- 1893.7%Good Intent Call
- 120.2%Overpressure Rupture
- 100.2%Severe Weather
- Fire incident types reported to NFIRS in Pepper Pike, OH
- 17459.8%Structure Fires
- 5619.2%Outside Fires
- 5318.2%Mobile Property/Vehicle Fires
- 82.7%Other
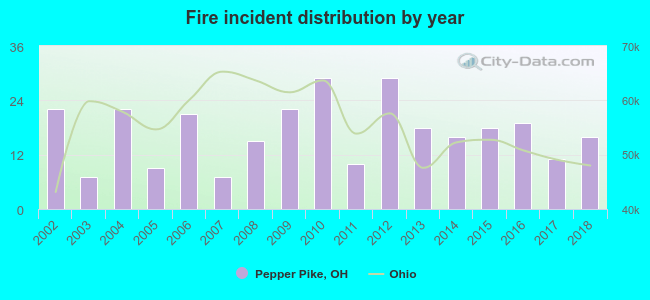 Based on the data from the years 2002 - 2018 the average number of fires per year is 17. The highest number of reported fires - 29 took place in 2010, and the least - 7 in 2003. The data has a declining trend.
The average number of yearly fire incidents per 10k residents in Pepper Pike, OH compared to nearest cities:
(Note: Based on data for the last 3 years, including only cities with population 5,000 and above)
| Pepper Pike: | 24.7 |
| Beachwood: | 34.5 |
| Mayfield Heights: | 26.7 |
| Lyndhurst: | 28.4 |
| University Heights: | 50.2 |
| Warrensville Heights: | 5.3 |
| Shaker Heights: | 34.3 |
| South Euclid: | 30.5 |
| Highland Heights: | 34.7 |
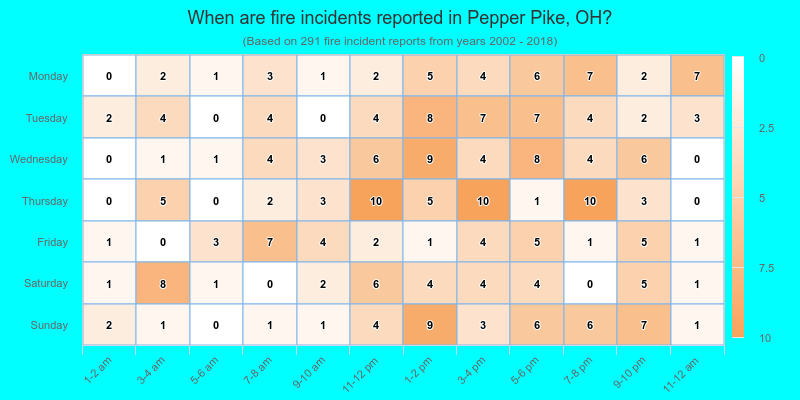
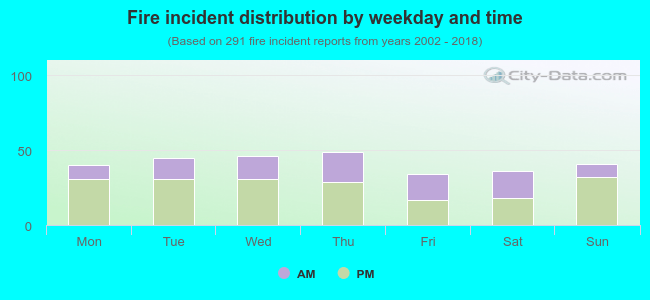 35.1% incidents where reported in the morning and 64.9% in the evening. The most fires (16.8%) took place on Thursday, and the least (11.7%) on Friday.
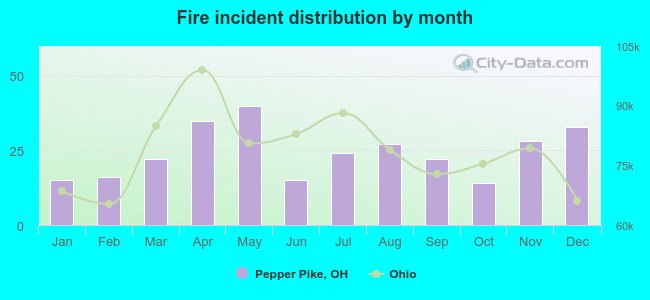 Based on the 291 fire incidents from years 2002 - 2018 most fires (13.7%) took place during May, and the least (4.8%) in October.
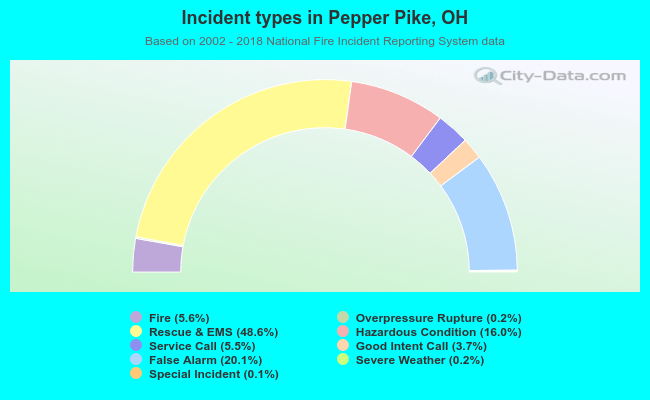 Out of all 5,163 cases reported during the years 2002 - 2018, the most belonged to the categories: Rescue & EMS (48.6%), False Alarm (20.1%), and Hazardous Condition (16.0%).
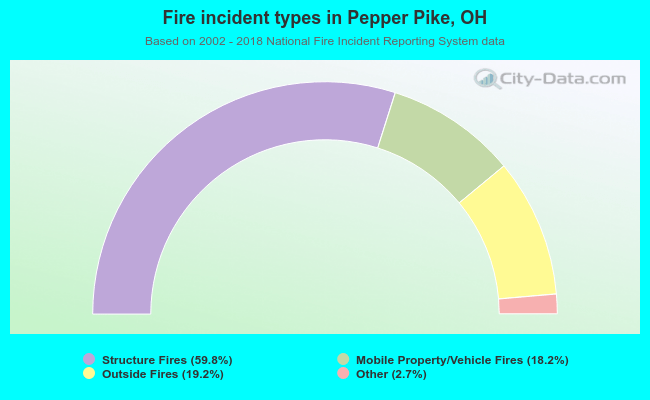 When looking into fire subcategories, the most incidents belonged to: Structure Fires (59.8%), and Outside Fires (19.2%).