Picayune: Fire Incidents, Mississippi (MS)
Where are fire incidents reported in Picayune, MS
Something went wrong! Please refresh the page.
| Fire incidents reported | |
|---|---|
| Sreet name | Count |
| INTERSTATE 59 | 132 |
| CANAL ST | 108 |
| MEMORIAL BLVD | 90 |
| HIGHWAY 11 | 76 |
| 43 HWY | 72 |
| HWY 43 | 70 |
| JACKSON LANDING RD | 70 |
| BEECH ST | 68 |
| 11 HWY | 60 |
| I59 | 60 |
| HIGHWAY 43 HWY | 58 |
| HAUGH AVE | 54 |
| SYCAMORE RD | 54 |
| HIGHWAY 11 HWY | 50 |
| LIBERTY RD | 50 |
| PALESTINE RD | 50 |
| TELLY RD | 46 |
| FRONTAGE RD | 44 |
| GOODYEAR BLVD | 36 |
| MAIN ST | 32 |
| SIXTH AVE | 32 |
| UNION SCHOOL RD | 32 |
| COOPER RD | 30 |
| ELOISE ST | 30 |
| KINGSWAY DR | 30 |
| BLANKS AVE | 28 |
| CAESAR RD | 28 |
| HERRIN DR | 28 |
| INTERSTATE 59 INT | 28 |
| JACKSON LANDING | 26 |
| Other | 1,342 |
2003 - 2018 National Fire Incident Reporting System (NFIRS) incidents
- Incident types reported to NFIRS in Picayune, MS
- 2,91438.3%Fire
- 2,66635.0%Rescue & EMS
- 84011.0%Hazardous Condition
- 5297.0%False Alarm
- 3785.0%Service Call
- 2513.3%Good Intent Call
- 130.2%Overpressure Rupture
- 100.1%Special Incident
- 80.1%Severe Weather
- Fire incident types reported to NFIRS in Picayune, MS
- 1,29144.3%Outside Fires
- 81127.8%Structure Fires
- 48816.7%Other
- 32411.1%Mobile Property/Vehicle Fires
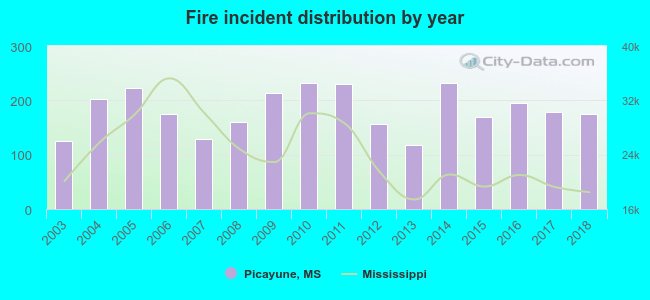 Based on the data from the years 2003 - 2018 the average number of fire incidents per year is 182. The highest number of reported fire incidents - 231 took place in 2010, and the least - 118 in 2013. The data has an increasing trend.
The average number of yearly fire incidents per 10k residents in Picayune, MS compared to nearest cities:
(Note: Based on data for the last 3 years, including only cities with population 5,000 and above)
| Picayune: | 170.6 |
| Diamondhead: | 24.9 |
| Waveland: | 76.9 |
| Pass Christian: | 159.5 |
| Long Beach: | 30.0 |
| Gulfport: | 58.2 |
| Biloxi: | 53.3 |
| Columbia: | 154.6 |
| Ocean Springs: | 102.1 |
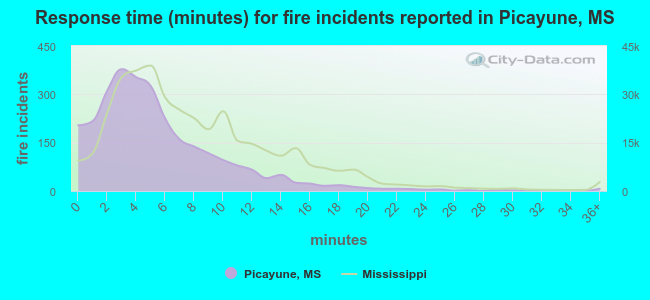 The median response time based on all reported fire incidents is 4 minutes. This is lower than the state median value.
The median response time in Picayune, MS compared to nearest cities:
(Note: Based on data for all years, including only cities with at least 500 fire incidents)
| Picayune: | 4 minutes |
| Pearl River: | 8 minutes |
| Kiln: | 10 minutes |
| Slidell: | 6 minutes |
| Bogalusa: | 4 minutes |
| Lacombe: | 7 minutes |
| Poplarville: | 11 minutes |
| Waveland: | 4 minutes |
| Bay St. Louis: | 5 minutes |
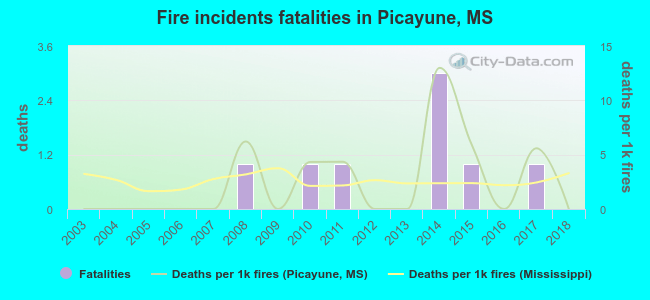 Based on the reports from the years 2003 - 2018 the average number of fire-related fatalities per year is 1. The highest number of deaths - 3 took place in 2014, and the lowest - 0 in 2003. The data has a constant trend.
The average number of fatalities per 1,000 fires is 2. This indicator was the highest - 13 in 2014, and the lowest 0 in 2003. The trend for fatalities per 1,000 incidents is constant. Compared to the Mississippi value the number of fatalities per 1,000 fire incidents is similar.
Based on the reports from the years 2003 - 2018 the average number of fire-related fatalities per year is 1. The highest number of deaths - 3 took place in 2014, and the lowest - 0 in 2003. The data has a constant trend.
The average number of fatalities per 1,000 fires is 2. This indicator was the highest - 13 in 2014, and the lowest 0 in 2003. The trend for fatalities per 1,000 incidents is constant. Compared to the Mississippi value the number of fatalities per 1,000 fire incidents is similar.Deaths per 1,000 incidents in Picayune, MS compared to nearest cities:
(Note: Based on data for all years, including only cities with at least 2,500 fire incidents)
| Picayune: | 2.7 |
| Slidell: | 1.8 |
| Bogalusa: | 2.2 |
| Covington: | 2.3 |
| Mandeville: | 0.7 |
| Saucier: | 2.0 |
| Lumberton: | 1.6 |
| Gulfport: | 2.3 |
| New Orleans: | 1.9 |
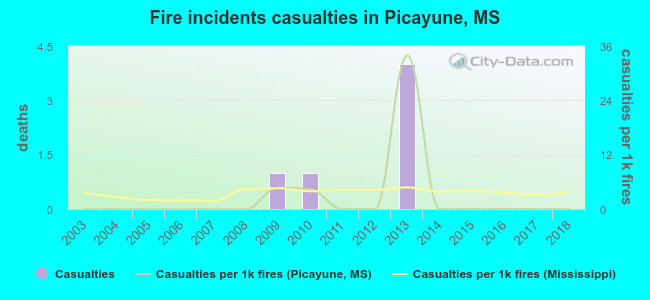 Based on the data from the years 2003 - 2018 the average number of fire-related yearly casualties is 0. The highest number of reported injuries - 4 took place in 2013, and the lowest - 0 in 2003. The data has a constant trend.
The average number of casualties per 1,000 fire incidents is 3. This indicator was the highest - 34 in 2013, and the lowest 0 in 2003. The trend for injuries per 1,000 incidents is constant. Compared to the state value the number of injuries per 1,000 incidents is lower.
Based on the data from the years 2003 - 2018 the average number of fire-related yearly casualties is 0. The highest number of reported injuries - 4 took place in 2013, and the lowest - 0 in 2003. The data has a constant trend.
The average number of casualties per 1,000 fire incidents is 3. This indicator was the highest - 34 in 2013, and the lowest 0 in 2003. The trend for injuries per 1,000 incidents is constant. Compared to the state value the number of injuries per 1,000 incidents is lower.Casualties per 1,000 incidents in Picayune, MS compared to nearest cities:
(Note: Based on data for all years, including only cities with at least 500 fire incidents)
| Picayune: | 2.1 |
| Pearl River: | 3.2 |
| Kiln: | 3.4 |
| Slidell: | 6.2 |
| Bogalusa: | 2.2 |
| Lacombe: | 1.5 |
| Poplarville: | 1.5 |
| Waveland: | 1.0 |
| Bay St. Louis: | 3.9 |
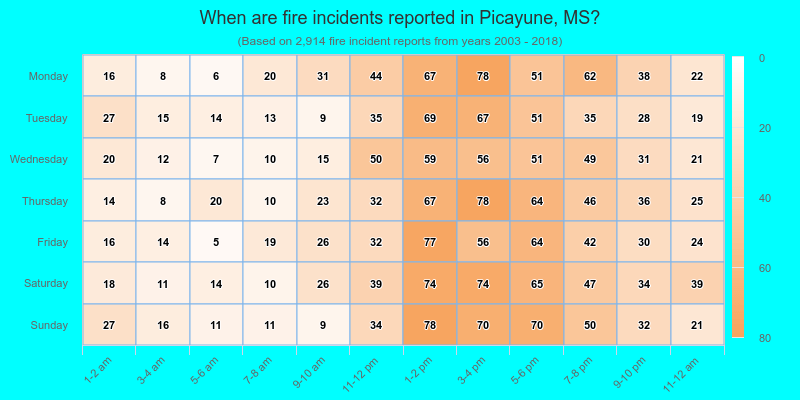
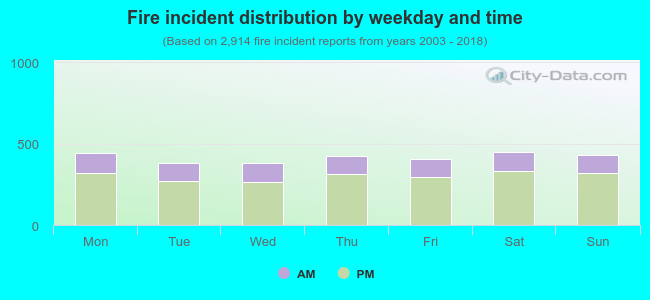 27.4% incidents where reported in the morning and 72.6% in the evening. The most fires (15.5%) took place on Saturday, and the least (13.1%) on Wednesday.
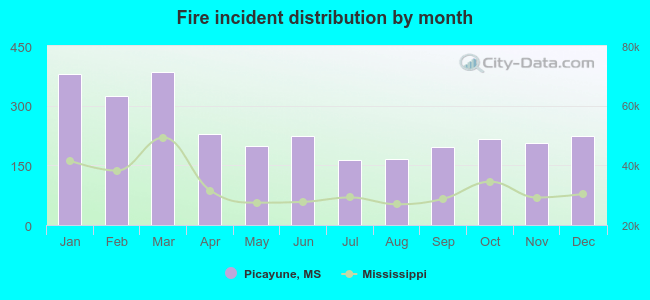 Based on the 2,914 fire incident reports from years 2003 - 2018 most fires (13.2%) took place during March, and the least (5.6%) in July.
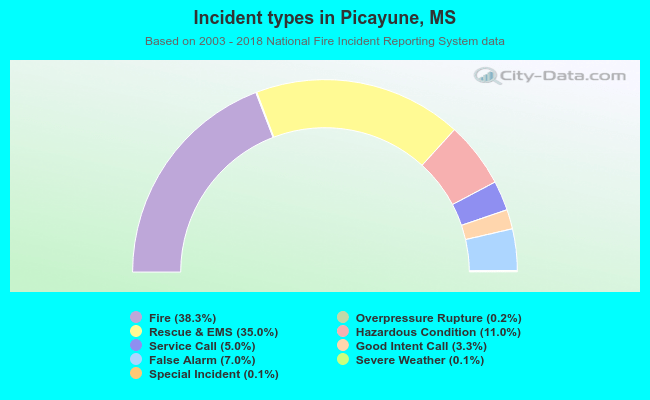 Out of all 7,609 cases reported during the years 2003 - 2018, the most belonged to the categories: Fire (38.3%), Rescue & EMS (35.0%), and Hazardous Condition (11.0%).
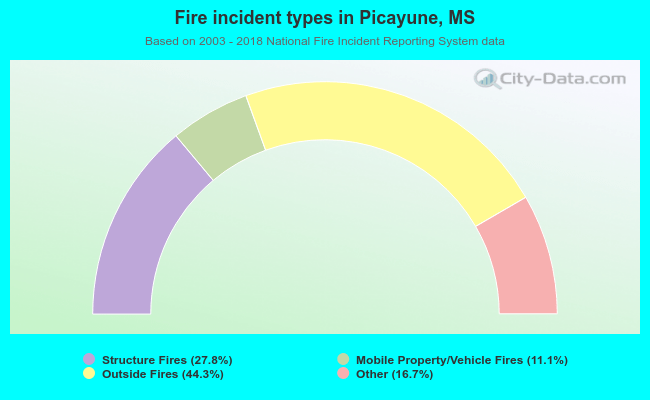 When looking into fire subcategories, the most reports belonged to: Outside Fires (44.3%), and Structure Fires (27.8%).