Piney Green: Fire Incidents, North Carolina (NC)
Where are fire incidents reported in Piney Green, NC
Something went wrong! Please refresh the page.
|
| |||||||||||||||||||||||||||||||||||||||||||||||||||||||||||||||||||||||||||||||||||||||||||||||||||||||||||||
2003 - 2018 National Fire Incident Reporting System (NFIRS) incidents
- Incident types reported to NFIRS in Piney Green, NC
- 17437.6%Fire
- 14030.2%Hazardous Condition
- 9821.2%Good Intent Call
- 275.8%Rescue & EMS
- 163.5%False Alarm
- 71.5%Service Call
- 10.2%Overpressure Rupture
- Fire incident types reported to NFIRS in Piney Green, NC
- 8247.1%Structure Fires
- 5833.3%Outside Fires
- 2011.5%Mobile Property/Vehicle Fires
- 148.0%Other
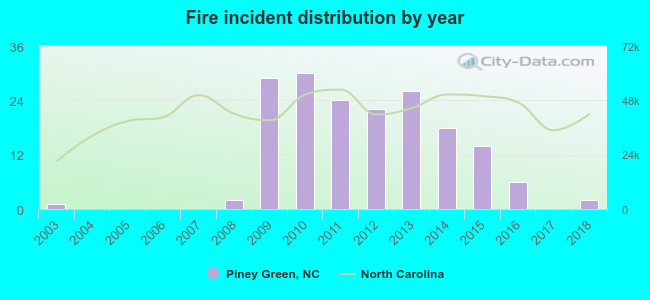 According to the data from the years 2003 - 2018 the average number of fire incidents per year is 11. The highest number of reported fires - 30 took place in 2010, and the least - 0 in 2004. The data has a growing trend.
The average number of yearly fire incidents per 10k residents in Piney Green, NC compared to nearest cities:
(Note: Based on data for the last 3 years, including only cities with population 5,000 and above)
| Piney Green: | 3.0 |
| Jacksonville: | 37.7 |
| Half Moon: | 4.4 |
| Havelock: | 30.4 |
| James City: | 11.0 |
| New Bern: | 57.9 |
| Morehead City: | 61.9 |
| Kinston: | 81.3 |
| Ogden: | 1.5 |
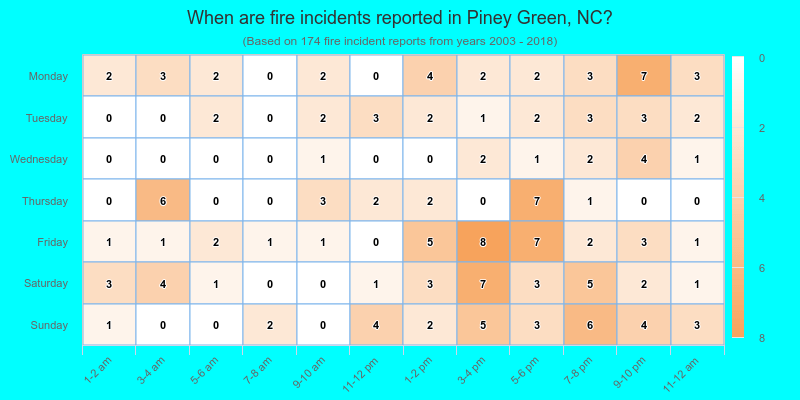
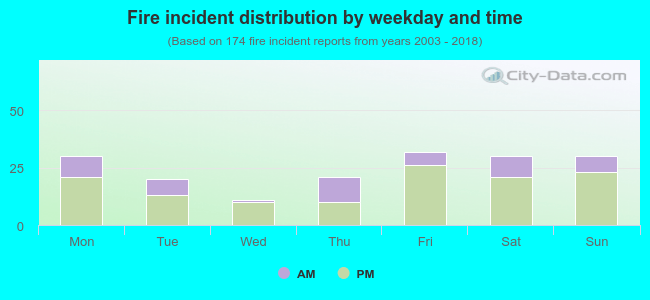 28.7% incidents where reported in the morning and 71.3% in the evening. The most fires (18.4%) took place on Friday, and the least (6.3%) on Wednesday.
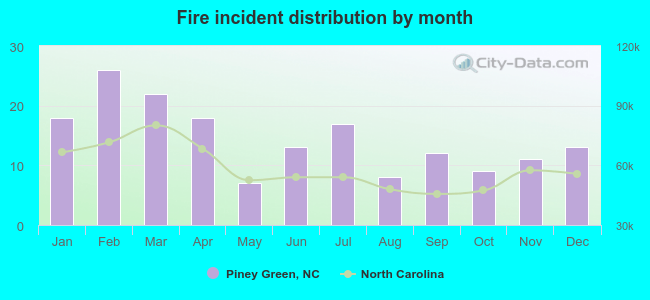 Based on the 174 reports from years 2003 - 2018 most fires (14.9%) took place during February, and the least (4.0%) in May.
 Out of all 463 cases reported during the years 2003 - 2018, the most belonged to the categories: Fire (37.6%), Hazardous Condition (30.2%), and Good Intent Call (21.2%).
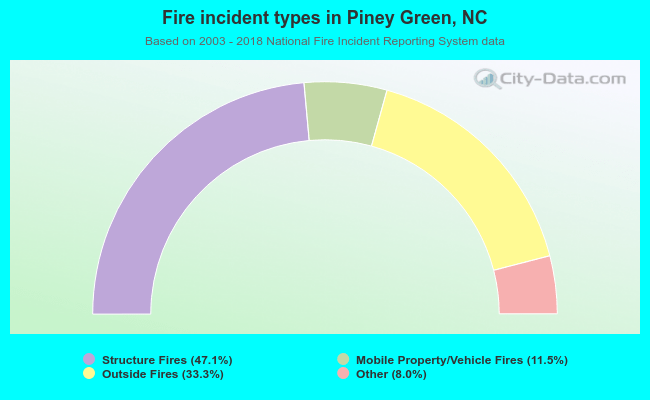 When looking into fire subcategories, the most incidents belonged to: Structure Fires (47.1%), and Outside Fires (33.3%).