Shrewsbury: Fire Incidents, Massachusetts (MA)
Where are fire incidents reported in Shrewsbury, MA
Something went wrong! Please refresh the page.
| Fire incidents reported | |
|---|---|
| Sreet name | Count |
| BOSTON TP | 284 |
| BOSTON TPKE | 250 |
| MAIN ST | 204 |
| COMMONS DR | 118 |
| QUINSIGAMOND AVE | 116 |
| HARTFORD TPKE | 98 |
| HARTFORD TP | 96 |
| SHREWSBURY GREEN DR | 80 |
| YORKSHIRE TER | 76 |
| GRAFTON ST | 72 |
| HOLDEN ST | 62 |
| OAK ST | 60 |
| 290 | 48 |
| MAPLE AVE | 48 |
| JULIO DR | 44 |
| SPRING ST | 44 |
| SOUTH ST | 42 |
| ARBOR DR | 40 |
| FLORAL ST | 38 |
| LAKE ST | 38 |
| AVALON WAY | 34 |
| PROSPECT ST | 34 |
| SHREWSBURY | 34 |
| WALNUT ST | 30 |
| BOYLSTON ST | 28 |
| HILLANDO DR | 28 |
| BOYLSTON CIR | 24 |
| MEMORIAL DR | 24 |
| BOW ST | 22 |
| EDGEMERE BLVD | 20 |
2002 - 2018 National Fire Incident Reporting System (NFIRS) incidents
- Incident types reported to NFIRS in Shrewsbury, MA
- 12,91655.9%Rescue & EMS
- 3,29914.3%Hazardous Condition
- 2,54911.0%False Alarm
- 2,0618.9%Fire
- 1,4536.3%Service Call
- 6913.0%Good Intent Call
- 970.4%Special Incident
- 270.1%Severe Weather
- Fire incident types reported to NFIRS in Shrewsbury, MA
- 1,14455.5%Structure Fires
- 60729.5%Outside Fires
- 27113.1%Mobile Property/Vehicle Fires
- 391.9%Other
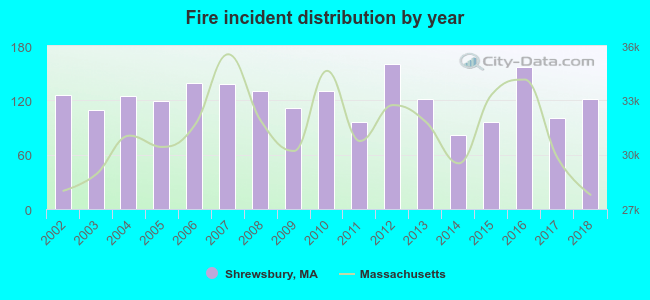 Based on the data from the years 2002 - 2018 the average number of fire incidents per year is 121. The highest number of fires - 160 took place in 2012, and the least - 82 in 2014. The data has a dropping trend.
The average number of yearly fire incidents per 10k residents in Shrewsbury, MA compared to nearest cities:
(Note: Based on data for the last 3 years, including only cities with population 5,000 and above)
| Shrewsbury: | 35.5 |
| Worcester: | 74.5 |
| Northborough: | 77.8 |
| Grafton: | 8.1 |
| West Boylston: | 39.6 |
| Millbury: | 51.5 |
| Holden: | 19.8 |
| Auburn: | 39.3 |
| Clinton: | 88.9 |
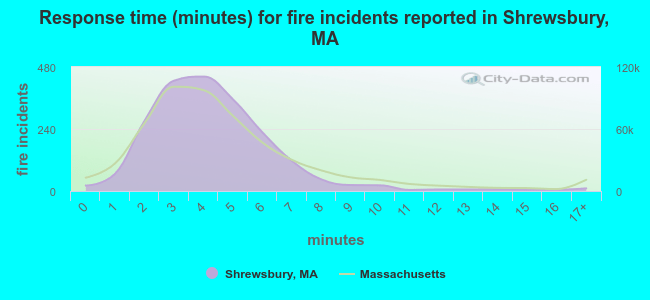 The median response time based on all reported fire incidents is 4 minutes. This is similar to the Massachusetts median value.
The median response time in Shrewsbury, MA compared to nearest cities:
(Note: Based on data for all years, including only cities with at least 500 fire incidents)
| Shrewsbury: | 4 minutes |
| Worcester: | 4 minutes |
| Northborough: | 6 minutes |
| Westborough: | 5 minutes |
| Millbury: | 6 minutes |
| Holden: | 6 minutes |
| Auburn: | 4 minutes |
| Clinton: | 3 minutes |
| Upton: | 5 minutes |
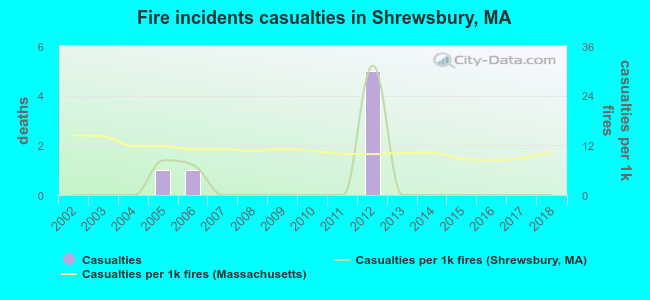 Based on the data from the years 2002 - 2018 the average number of fire-related yearly casualties is 0. The highest number of casualties - 5 took place in 2012, and the lowest - 0 in 2002. The data has a constant trend.
The average number of casualties per 1,000 fire incidents is 3. This indicator was the highest - 31 in 2012, and the lowest 0 in 2002. The trend for injuries per 1,000 incidents is constant. Compared to the Massachusetts value the number of casualties per 1,000 fire incidents is much lower.
Based on the data from the years 2002 - 2018 the average number of fire-related yearly casualties is 0. The highest number of casualties - 5 took place in 2012, and the lowest - 0 in 2002. The data has a constant trend.
The average number of casualties per 1,000 fire incidents is 3. This indicator was the highest - 31 in 2012, and the lowest 0 in 2002. The trend for injuries per 1,000 incidents is constant. Compared to the Massachusetts value the number of casualties per 1,000 fire incidents is much lower.Casualties per 1,000 incidents in Shrewsbury, MA compared to nearest cities:
(Note: Based on data for all years, including only cities with at least 500 fire incidents)
| Shrewsbury: | 3.4 |
| Worcester: | 2.6 |
| Northborough: | 18.2 |
| Westborough: | 10.5 |
| Millbury: | 23.2 |
| Holden: | 15.1 |
| Auburn: | 2.5 |
| Clinton: | 5.5 |
| Upton: | 1.6 |
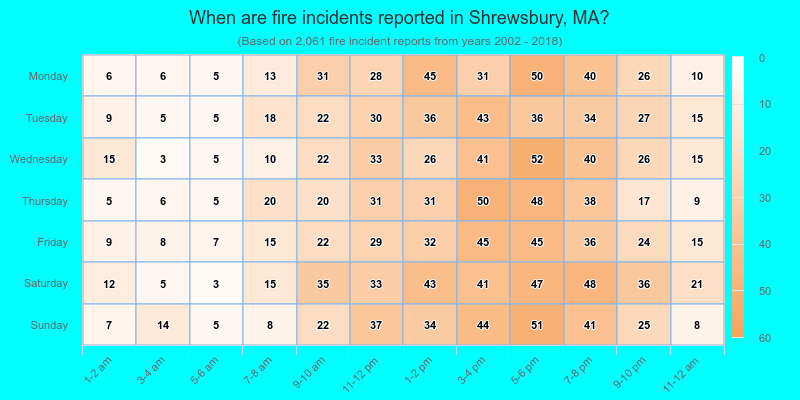
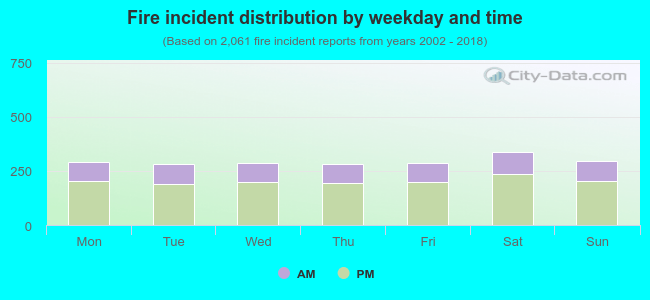 31.0% incidents where reported in the morning and 69.0% in the evening. The most fires (16.4%) took place on Saturday, and the least (13.6%) on Tuesday.
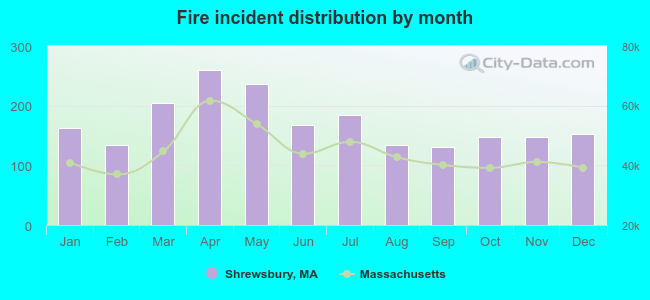 Based on the 2,061 fires from years 2002 - 2018 most fires (12.6%) took place during April, and the least (6.3%) in September.
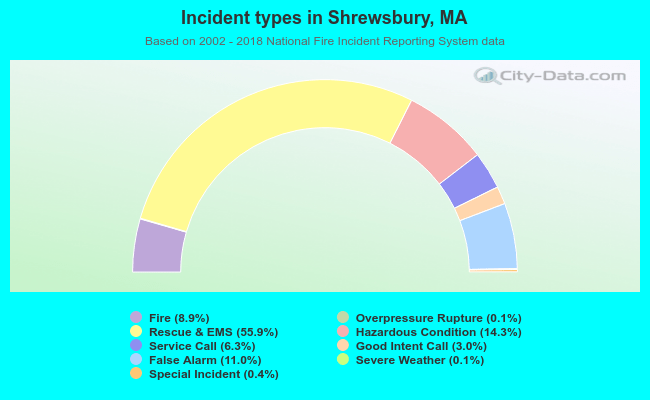 Out of all 23,116 cases reported during the years 2002 - 2018, the most belonged to the categories: Rescue & EMS (55.9%), Hazardous Condition (14.3%), and False Alarm (11.0%).
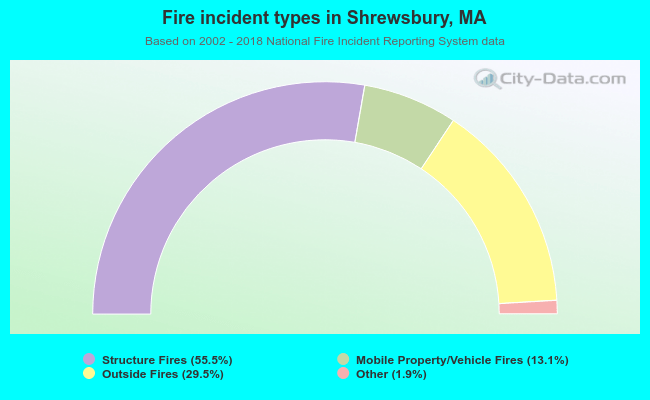 When looking into fire subcategories, the most reports belonged to: Structure Fires (55.5%), and Outside Fires (29.5%).