West Frankfort: Fire Incidents, Illinois (IL)
Where are fire incidents reported in West Frankfort, IL
Something went wrong! Please refresh the page.
| Fire incidents reported | |
|---|---|
| Sreet name | Count |
| MAIN ST | 130 |
| ELM ST | 112 |
| LINDELL ST | 110 |
| MAIN | 102 |
| OAK ST | 98 |
| ST. LOUIS ST | 88 |
| 7TH ST | 74 |
| DOUGLAS ST | 66 |
| 4TH ST | 62 |
| CLARK ST | 62 |
| EMMA ST | 58 |
| TAFT ST | 52 |
| 5TH ST | 46 |
| 6TH ST | 46 |
| HORN ST | 46 |
| STATE HWY 149 | 46 |
| POPLAR ST | 44 |
| ST LOUIS ST | 44 |
| ADAMS ST | 40 |
| CHARLES ST | 38 |
| NOLEN | 36 |
| JEFFERSON ST | 32 |
| TAYLOR RD | 32 |
| GARDNER ST | 30 |
| 8TH ST | 28 |
| 9TH ST | 28 |
| COUNTRY CLUB RD | 28 |
| 5 TH. ST | 26 |
| OLD JOHNSTON CITY RD | 26 |
| PARKHILL ST | 26 |
| Other | 270 |
2002 - 2018 National Fire Incident Reporting System (NFIRS) incidents
- Incident types reported to NFIRS in West Frankfort, IL
- 6,27466.2%Rescue & EMS
- 1,92620.3%Fire
- 5625.9%Hazardous Condition
- 2792.9%Service Call
- 2302.4%Good Intent Call
- 1511.6%False Alarm
- 300.3%Special Incident
- 130.1%Overpressure Rupture
- 110.1%Severe Weather
- Fire incident types reported to NFIRS in West Frankfort, IL
- 85944.6%Outside Fires
- 79241.1%Structure Fires
- 22411.6%Mobile Property/Vehicle Fires
- 512.6%Other
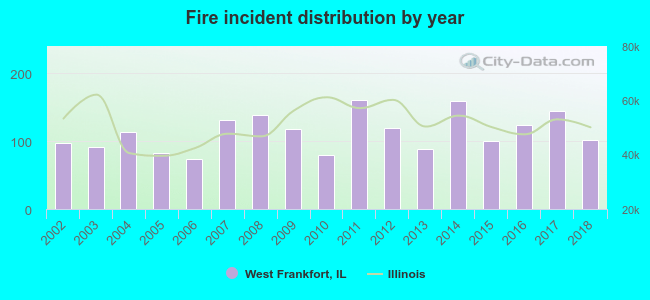 According to the data from the years 2002 - 2018 the average number of fires per year is 113. The highest number of reported fires - 160 took place in 2011, and the least - 74 in 2006. The data has an increasing trend.
The average number of yearly fire incidents per 10k residents in West Frankfort, IL compared to nearest cities:
(Note: Based on data for the last 3 years, including only cities with population 5,000 and above)
| West Frankfort: | 153.5 |
| Benton: | 150.6 |
| Herrin: | 51.6 |
| Marion: | 107.8 |
| Carterville: | 69.3 |
| Du Quoin: | 63.8 |
| Carbondale: | 52.3 |
| Harrisburg: | 71.4 |
| Murphysboro: | 108.4 |
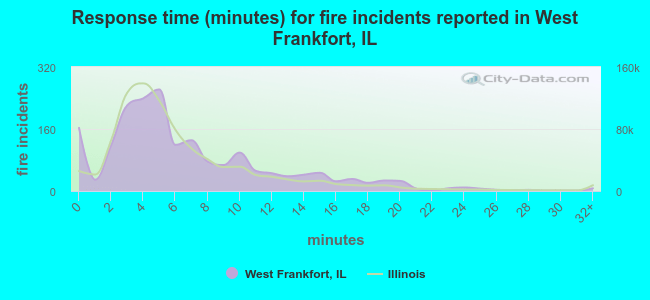 The median response time based on all reported fire incidents is 5 minutes. This is close to the Illinois median value.
The median response time in West Frankfort, IL compared to nearest cities:
(Note: Based on data for all years, including only cities with at least 500 fire incidents)
| West Frankfort: | 5 minutes |
| Johnston City: | 6 minutes |
| Mitchell: | 5 minutes |
| Benton: | 4 minutes |
| Herrin: | 4 minutes |
| Marion: | 5 minutes |
| Carterville: | 6 minutes |
| Carbondale: | 4 minutes |
| Harrisburg: | 4 minutes |
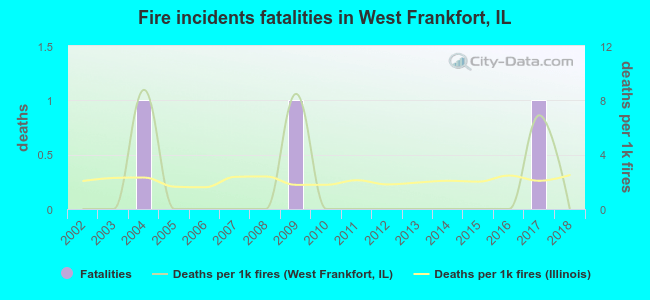 Based on the data from the years 2002 - 2018 the average number of fire-related yearly deaths is 0. The highest number of deaths - 1 took place in 2004, and the lowest - 0 in 2002. The data has a constant trend.
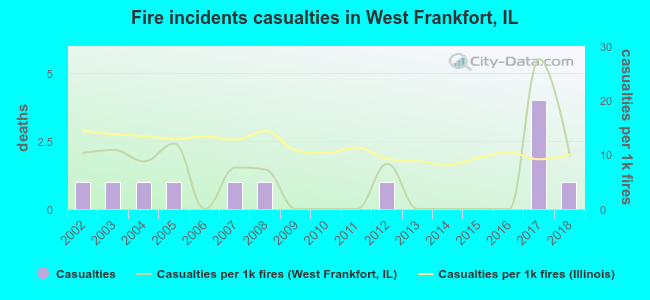 Based on the data from the years 2002 - 2018 the average number of fire-related casualties per year is 1. The highest number of injuries - 4 took place in 2017, and the lowest - 0 in 2006. The data has a constant trend.
The average number of casualties per 1,000 fire incidents is 6. This indicator was the highest - 28 in 2017, and the lowest 0 in 2006. The trend for injuries per 1,000 fires is decreasing. Compared to the state value the number of casualties per 1,000 fires is lower.
Based on the data from the years 2002 - 2018 the average number of fire-related casualties per year is 1. The highest number of injuries - 4 took place in 2017, and the lowest - 0 in 2006. The data has a constant trend.
The average number of casualties per 1,000 fire incidents is 6. This indicator was the highest - 28 in 2017, and the lowest 0 in 2006. The trend for injuries per 1,000 fires is decreasing. Compared to the state value the number of casualties per 1,000 fires is lower.Casualties per 1,000 incidents in West Frankfort, IL compared to nearest cities:
(Note: Based on data for all years, including only cities with at least 500 fire incidents)
| West Frankfort: | 6.2 |
| Johnston City: | 1.3 |
| Mitchell: | 5.9 |
| Benton: | 7.0 |
| Herrin: | 3.8 |
| Marion: | 6.2 |
| Carterville: | 1.8 |
| Carbondale: | 24.0 |
| Harrisburg: | 6.9 |
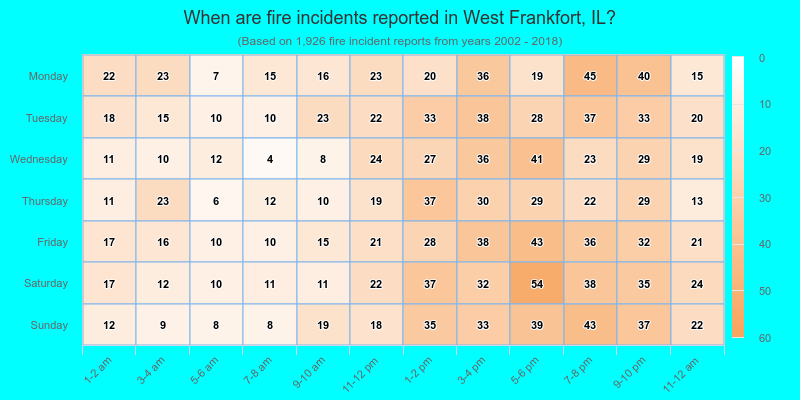
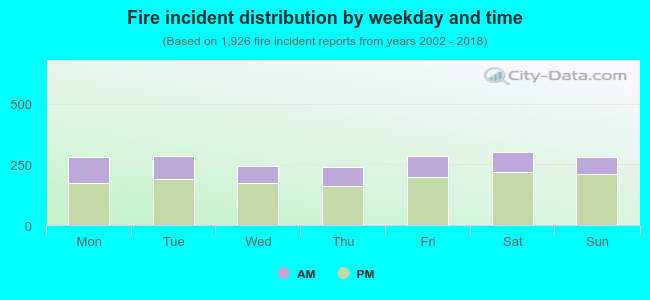 31.2% incidents where reported in the morning and 68.8% in the evening. The most fires (15.7%) took place on Saturday, and the least (12.5%) on Thursday.
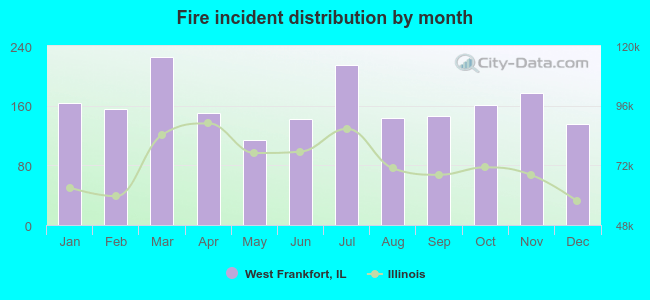 According to the 1,926 fires from years 2002 - 2018 most fires (11.7%) took place during March, and the least (5.9%) in May.
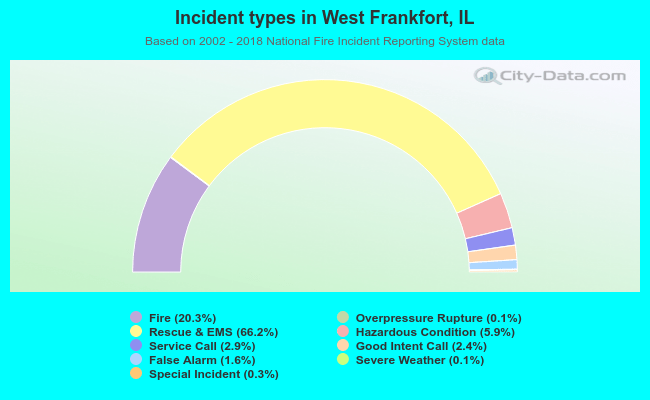 Out of all 9,476 cases reported during the years 2002 - 2018, the most belonged to the categories: Rescue & EMS (66.2%), Fire (20.3%), and Hazardous Condition (5.9%).
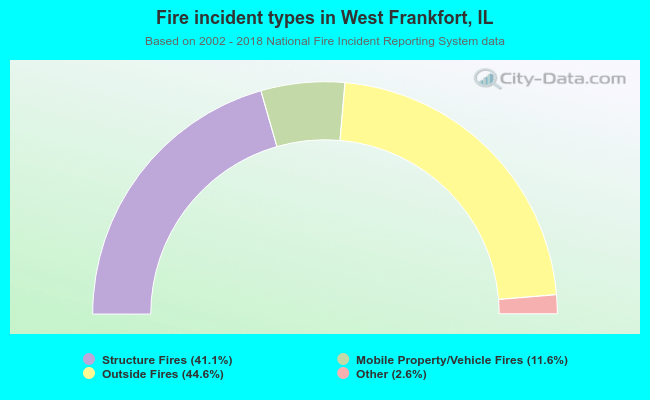 When looking into fire subcategories, the most reports belonged to: Outside Fires (44.6%), and Structure Fires (41.1%).