Please register to participate in our discussions with 2 million other members - it's free and quick! Some forums can only be seen by registered members. After you create your account, you'll be able to customize options and access all our 15,000 new posts/day with fewer ads.
I was wondering if you could zoom in on the Camden/Burlington County areas around Philly.
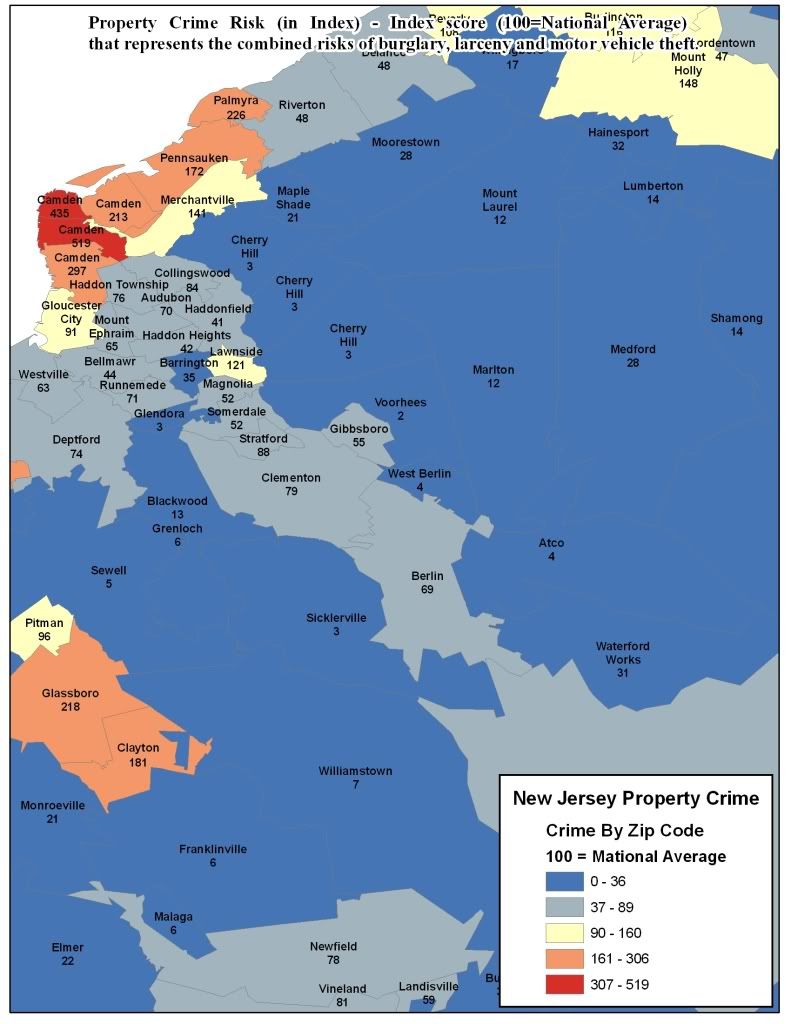
Here you are, Camden County violent and property crime map:
An observation, and some might take offense to this. The map around Philly is very interesting, because there are many more suburbs here in lighter blue in comparable proximity to Philly than there are to NYC in Bergen/Passaic. If you take a cumulative analysis of these zips, I'd venture to say both levels of crime are somewhat higher than Northern NJ.
Thanks for this Mike. How accurate would you say this is? For example, this map dictates that the Greenville section of Jersey City is safer (in both property and personal crime) than the Downtown/Waterfront section of JC. Greenville is considered one of the most unsafe zipcodes in NJ. What gives?
I'm calling BS on these numbers. Completely inconsistent with per-incident crime maps (which show the vast majority of homicides in Greenville)
It's possible that some of the projects get lumped into the downtown numbers, but still, the JC map seems completely back to front (Greenville isn't safer than the heights, JSQ, or anywhere else in Hudson county for that matter)
Also, I agree with Elflord and JerseyCity201. It's pretty hard to believe that Greenville is safer than Downtown JC. As a native of Hudson county, I've stomped around JC thousands of times and Greenville is a scary place (and I'm not easily frightened).
I think the map and data are pretty legit, but the numbers are off in some areas.
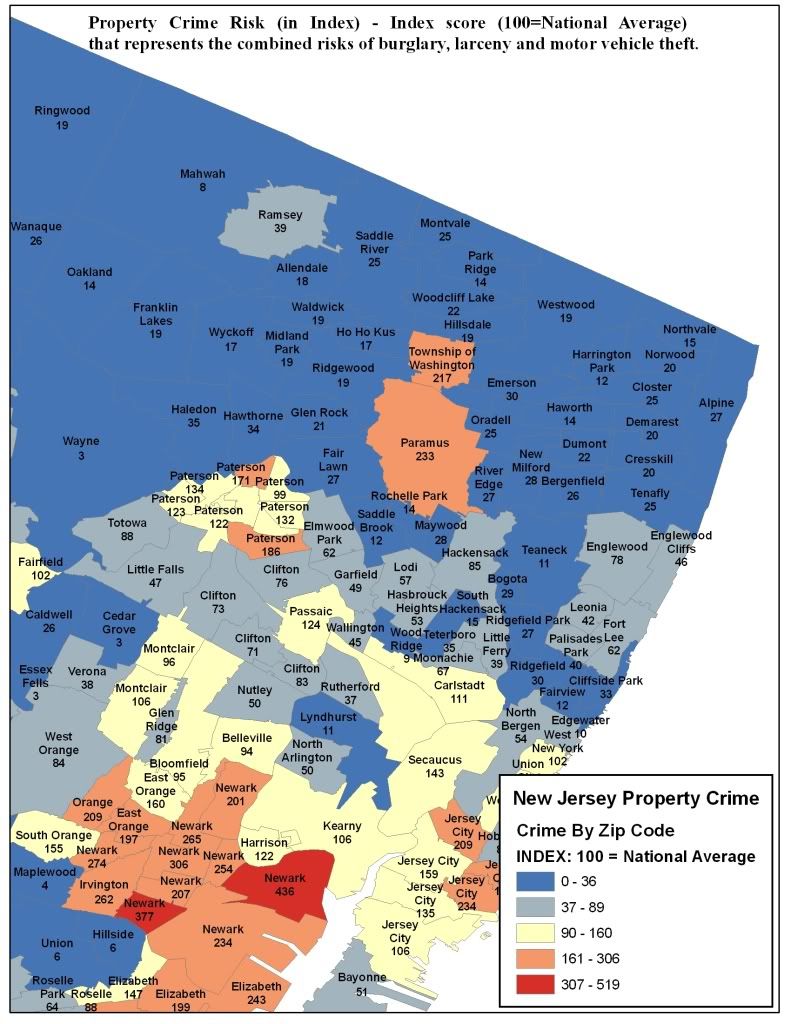
the colors in the second zoomed-in map of bergen county (shown below) do not match the numbers for washington township and paramus:
with a property crime risk of 217, washington township should be orange, not light yellow. and with a property crime risk of 233, paramus should be orange, not blue.
by contrast, in the zoomed-out property crime map that mike included in his initial post (http://i293.photobucket.com/albums/m...imebyzip-1.jpg), both washington township and paramus are colored orange. those are the two "orange blobs" that luckyshoes was asking about earlier in this thread (post #14).
mike, take a look at the bergen county section of that zoomed-out map - you'll see what i mean about paramus and washington township being colored orange.
i'm still mystified as to why the crime rate is so high for washington township, though. even its personal crime risk (rape/murder/assault/robbery) is unexpectedly high at 118, which makes no sense to me. that number has got to be off.
Big oops pBergen. Thanks for pointing it out. I've adjusted the symbology for the violent crime, because even though the map title was identical, and the labeling different, the color scheme was the same. I failed to change it. I don't want to bore you with any further technical jargon, but I suspect the Middlesex and Camden County maps will also need repair based off of your discovery.
I wonder, when it comes to Washington, are there a series of stores on Rt 17, or malls, that might enhance the property crime statistics? I know when I used to live in Northern NJ, before I left, that area was building north of Allendale. I wonder if that area is considered township of Washington on the map. There are a ton of retail stores on Rt 17 in that area, as I recall. It's right before you turn off on Ramsey Rd, into that village. Maybe I am dilusional!
Some of these numbers have to be bogus. Teaneck has a crime index of 11, Fairview has a crime index of 12, and Allendale has a crime index of 18? Saddle River has a crime index of 25?!?
There's NFW Allendale and Saddle River have more crime than Teaneck and definitely not Fairview. I know crime in Teaneck is low, but it's still way higher than in Allendale and Saddle River.
And Fairview? Different planet from the other three towns.
Please register to post and access all features of our very popular forum. It is free and quick. Over $68,000 in prizes has already been given out to active posters on our forum. Additional giveaways are planned.
Detailed information about all U.S. cities, counties, and zip codes on our site: City-data.com.

 Please register to participate in our discussions with 2 million other members - it's free and quick! Some forums can only be seen by registered members. After you create your account, you'll be able to customize options and access all our 15,000 new posts/day with fewer ads.