Please register to participate in our discussions with 2 million other members - it's free and quick! Some forums can only be seen by registered members. After you create your account, you'll be able to customize options and access all our 15,000 new posts/day with fewer ads.
keep in mind that Barrow had just finished its warmest October on record! The warmer-than-average conditions in northern Alaska can be attributed to the inadequate sea ice coverage. Elsewhere in the interior, temperatures colder than -40C have been recorded yesterday. Fairbanks recorded several daily lows below -33°C this week, not record-breaking for this time of the year though. The coldest temperatures in Canada will usually not be found in Nuvanut, but rather in the Yukon, as a matter of fact. Dawson, Yukon had a low of -34C last night, the lowest in Canada. The coldest air tends to aggregate around Eastern Alaska and the Yukon.
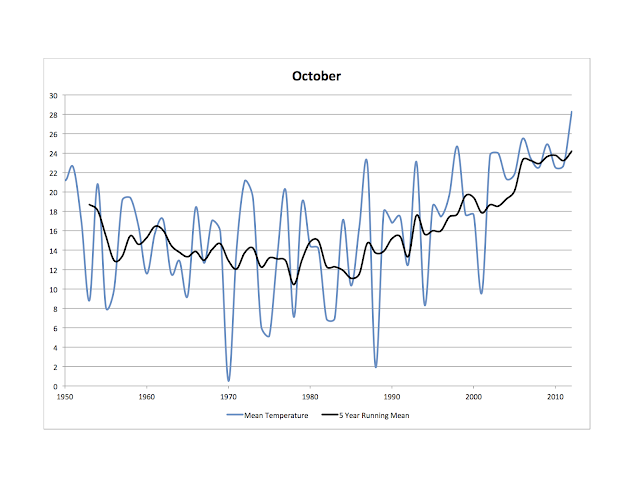
Interesting article. So basically, the five-year rolling average for October has gone up 9F since 1995 Considering that the warming has been out of control for ten years now I wonder how impressive that first graph would have looked like if compared to the more historically typical 1971-2000 averages? To anybody who follows it and knows the links - how are Arctic sea ice volumes as a whole looking compared to normal at this time of year?
Interesting article. So basically, the five-year rolling average for October has gone up 9F since 1995
Of course the autumn warming has been wild there, but aside from that, I think these local climate effects are really interesting - how the sea ice keeps the temperatures in fall cooler, and how climates can be altered like that. It's even more interesting how autumn warming is out of control but winters have been unaffected by those factors, obviously because sea ice is present in winter.
If the sea ice went away even in winter there would be a lot of warming because of that. Of course, I suppose that if Barrow got warm enough in winter to melt the ice I suppose that any additional warming from lack of sea ice would be insignificant . Winter ice forms as far south as the Great Lakes, and Barrow would have to warm by 40F to get up to even Chicago's level of warmth.
To give you an idea of how much a 40F warming would be, if you warmed all of North America by 40F, the average annual temperature of Minneapolis would be 86F, placing it deep inside the tropics. Winnipeg would have a climate similar to Miami, thus the tropics would extend to at least the 50th parallel.
A 40F cooling would be just as extreme. Florida would have a climate similar to Minnesota, and if the tropics cooled by 40F all locations along the equator would have a climate resembling La Paz.
Quote:
Considering that the warming has been out of control for ten years now I wonder how impressive that first graph would have looked like if compared to the more historically typical 1971-2000 averages?
Since there are already many "tall red bars" already, making them taller won't change the look of the graph that much.
Interesting article. So basically, the five-year rolling average for October has gone up 9F since 1995 Considering that the warming has been out of control for ten years now I wonder how impressive that first graph would have looked like if compared to the more historically typical 1971-2000 averages? To anybody who follows it and knows the links - how are Arctic sea ice volumes as a whole looking compared to normal at this time of year?
Using 1971-2000 as a comparison period would just shift the entire graph up but won't change the shape of the graph. Sea ice volume can be found from PIOMAS:
Using 1971-2000 as a comparison period would just shift the entire graph up but won't change the shape of the graph. Sea ice volume can be found from PIOMAS:
Yes, I realise that, but was just trying to work out how much warmer the new averages are compared to the old ones without bothering to do any actual calculations Probably would have only made 2-3F of difference, so there would still only have 29 of 31 nights above average.
No sign of anything wintry here yet, and nor do I realistically expect any. We've only had two lying snowfalls and two ice days in November in the past 20 years, and all of them towards the end of the month.
Yes, I realise that, but was just trying to work out how much warmer the new averages are compared to the old ones without bothering to do any actual calculations Probably would have only made 2-3F of difference, so there would still only have 29 of 31 nights above average.
keep in mind that Barrow had just finished its warmest October on record! The warmer-than-average conditions in northern Alaska can be attributed to the inadequate sea ice coverage.
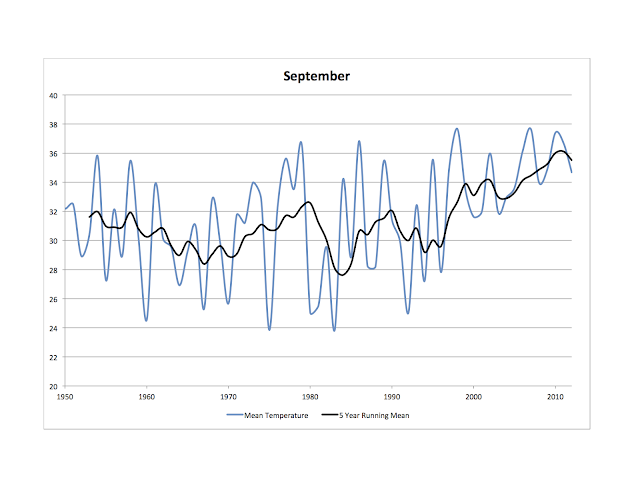
To see if decreased sea ice makes sense as being responsible for the warmer Octobers, I made graphs similar to the quoted blog posts of September, October and November. Moving the date of sea ice formation should affect October more so than the other months. From the webcams on this site:
it looks like sea ice used to form in mid October but the date has moved to sometime in November, so the effect of sea ice on temperature (lack of sea ice = more maritime influence) would be greatest in October. Amusingly, the "mass balance sensor" from that group is out because it was damaged by a polar bear. Here are my graphs:
Temperatures in °F, obviously. The weather station I used, only goes back to 1949; the blog that used earlier data must have combined with another site, which could introduce a discrepancy. From my graphs, it appear all months are ather variable, but the recent October change has been the most consistent.
it looks like sea ice used to form in mid October but the date has moved to sometime in November, so the effect of sea ice on temperature (lack of sea ice = more maritime influence) would be greatest in October. Amusingly, the "mass balance sensor" from that group is out because it was damaged by a polar bear. Here are my graphs:
From the charts, October has skyrocketed upwards, September has warmed more moderately, and November warmed in the 1990's but has stalled since 2000. I would imagine that, all other things being equal, there would be a "ceiling", a temperature that would be reached once the sea ice is completely gone in October. After all, the warming from lack of sea ice maxes out once the sea ice is all gone, right? Of course, in real-life climate things are not equal.
There is no doubt this morning that the stratosphere is at a historically cold levels at 70 MB and up to 10 MB. The 70 MB level is in fact the coldest that has ever been seen. The reason?
The sun is becoming rather active and that increased activity leads to a destruction of ozone which leads to a rapid cooling of the stratosphere and ionosphere. Now you might think this is a serious problem for my forecast. Well, it’s not yet but something to certainly watch.
The reason why I am not concerned yet is because of where the cold anomalies are setting up. The cold anomalies continue to be focused over the North Pole, northeastern Europe, and Asia which explains why the heights in these locations have been above normal.
An interesting concern is that the Polar Vortex would have the potential to be VERY strong over North America. This could have two potential out comes depending on how the Polar Vortex is positioned. This could lead to a VERY cold, I’m talking Arctic cold, over much of eastern North America for this winter but whether that means stormy or dry will depend on whether this PV sets up towards the northern Plains or towards southeastern Canada. A position in the northern Plains would support the trough axis to be positioned such that the eastern side of the trough will be over the East coast, this is the stormy side of a trough axis. However, if the PV sets up around southeastern Canada, that would lead to a suppression of the storm track to the south and a very cold yet dry weather pattern, unless you live near the Great Lakes where Lake Effect snow would be a problem. The set up of the Polar Vortex IS uncertain and won’t be forecastable until December.
You might be asking me, why am I so sure that we won’t see a repeat of last year? Good question! Well, it’s all about how the 500 MB pattern is setting up. Remember, last year while North America had a nice break from winter, much of eastern Europe and western Asia did not. Those locations had relatively warm stratospheric temperatures and lead to what ever cold air that did develop towards those locations. This year, we see a similar set up but towards North America. Combined this aspect with the well above normal snow growth in North America and what has already been an active and cold weather pattern this late Fall and I think you can see where we are heading.
Interesting. Normally a weaker PV (and the associated -AO) is better for snowfall, but it appears that a strong polar vortex will set up, at least in the earlier part of winter. Normally that would mean a +AO (like last winter), but the AO is forecast to go negative, deeply negative in fact. Also, I think he's referring to the fact that the bulk of the stratospheric cold is on the other side of the world. So, this dude may be onto something.
Please register to post and access all features of our very popular forum. It is free and quick. Over $68,000 in prizes has already been given out to active posters on our forum. Additional giveaways are planned.
Detailed information about all U.S. cities, counties, and zip codes on our site: City-data.com.

 Please register to participate in our discussions with 2 million other members - it's free and quick! Some forums can only be seen by registered members. After you create your account, you'll be able to customize options and access all our 15,000 new posts/day with fewer ads.

 Considering that the warming has been out of control for ten years now I wonder how impressive that first graph would have looked like if compared to the more historically typical 1971-2000 averages? To anybody who follows it and knows the links - how are Arctic sea ice volumes as a whole looking compared to normal at this time of year?
 . Winter ice forms as far south as the Great Lakes, and Barrow would have to warm by 40F to get up to even Chicago's level of warmth.
 Probably would have only made 2-3F of difference, so there would still only have 29 of 31 nights above average.